
 ?Mathematical formulae have been encoded as MathML and are displayed in this HTML version using MathJax in order to improve their display. Uncheck the box to turn MathJax off. This feature requires Javascript. Click on a formula to zoom.
Abstract
The COVID-19 pandemic has expedited the growth of e-commerce in South Africa, as in global markets, strengthening online shopping exchange relationships. Businesses seek advanced models of the online shopping dimensions that are appropriate for tailoring services to customers. The data collected included customers’ perceived information quality, privacy concerns, perceived security, product variety, and product delivery as antecedents of customer satisfaction, while information quality and satisfaction were specified as key determinants of customer loyalty. A total of 287 completed responses were analysed using structural equation modelling. The results indicate that the customer satisfaction of online shoppers is influenced by product delivery, perceived security, information quality, and product variety. Customer satisfaction and information quality determine customers’ loyalty towards web stores. In its originality, the paper reveals that product delivery and satisfaction relationship are moderated by e-commerce experience exceeding five years. The paper concludes with managerial implications for online shopping in aiming to build customer loyalty.
PUBLIC INTEREST STATEMENT
South Africa ranks the 37th largest market for e-commerce, with an annual growth rate (CAGR 2021-2025) of 8.16%, or an estimated market volume of US$6,898m by 2025. Now, since the unprecedented events of COVID-19, there is a noticeable shift in consumer behaviour and changes in their expectations, resulting in the growth of e-commerce estimated to increase significantly as consumers drift from in-store shopping to online channels. The number of users is expected to reach 33.4m by 2025. Managers now want to know the online shopping dimensions that could enhance customer satisfaction (i.e., navigation, information quality, web design, security, etc.), and customer loyalty, thus, generate profit. Results show positive significant effects of product delivery, perceived security, information quality, and product variety on customer satisfaction. In turn, satisfaction and information quality determine customer loyalty. Enhancing product delivery services and customer satisfaction is a key marketing strategy for building long-term e-commerce customer loyalty.
1. Introduction
E-commerce growth has grown exponentially in recent years. An e-commerce transaction starts when the seller advertises products on a website, and customers show acceptance, evaluate the products’ features, prices, and delivery options, buy products of interest, and then check out (Ribadu & Rahman, Citation2019). Tailoring these products to specific markets and targeted customer groups increases online retail sales volumes and reduces the costs for updated information that customers access, showing the important role that e-commerce plays in determining how effective online retailers can leverage innovative technologies to deliver customer satisfaction value (Gupta et al., Citation2020).
The existing research in the literature seeks to measure the factors affecting customer satisfaction in e-retail such as information quality, perceived security, and privacy concerns (Ahmad et al., Citation2017; Rita et al., Citation2019; Vasic et al., Citation2019). In 2017, global retail e-commerce sales reached US$2.3 trillion, an increase of 24.8% over the previous year (eMarketer, Citation2018), leading to global e-retail sales contributing 10.2% of the overall global retail sales. This figure was expected to reach 17.5% in 2021 (Chiu & Cho, Citation2019; Statista, Citation2018), amounting to US$4.9 trillion (Vakulenko et al., Citation2019). The South African e-commerce market, estimated to have been worth US$3bn in net sales in 2019, was expected to grow by an average compound annual growth rate (CAGR) of 13% from 2019 to 2024 (Schaefer & Bulbulia, Citation2021). Achieving these financial objectives requires a clear and strategic approach to understanding the online shopping attributes that have an impact on the development of customer satisfaction and loyalty towards web stores in South Africa.
Although one key advantage of the Internet is its ability to simplify information searches and to facilitate transactions (Bilgihan, Citation2016), improvements in innovative website technology usage require e-retailers not only to present product information but also cultivate positive relationships with customers by offering a satisfying shopping experience (i.e., ease of navigation, information quality, web design, security, etc.), which is fundamental for the long-term success of online retail (Brusch et al., Citation2019; Sharma & Aggarwal, Citation2019). Thus this study aims to measure the moderating effects of online shopping experiences in the e-retail sector of South Africa.
When interacting with a seller’s website, online customers navigate the web pages and search for relevant product information before they generate a purchase intention or a commitment to buy (Mortimer et al., Citation2016; Pandey & Chawla, Citation2018; Tzeng et al., Citation2020). Customers search for fun, enjoyment, recreation, and amusement when shopping online, including deals and bargains for goods (Alavi et al., Citation2016), and comparing prices from different online retailers and choosing the lowest acceptable competing price (Pandey et al., Citation2019). In addition to searching for enjoyment and pleasurable shopping, consumers search for modern products, look for trendy styles, and seek product diversity (Alavi et al., Citation2016). Shih (Citation2004) found that consumers who recognise the importance of information quality prefer to purchase physical or digital products from a website that facilitates online payments. As payments are processed through a debit or credit card in online shopping, consumers also give attention to information about the e-retailer as a source of protection (Vasic et al. Citation2018). Dimensions such as fulfilment, ease of use, reliability, security, and privacy are important for websites that market products that need physical delivery (Yang et al., Citation2005), and customers’ demand for delivery deadlines, security, and reliable e-commerce services is very high (Garcia et al., Citation2020). Shih (Citation2004) reports a significant and positive impact of website security on users’ acceptance of taking online delivery. In general, his overall model explained 26.5% of the variance in customers’ acceptance of online delivery.
Notably, creating and maintaining customer satisfaction through its antecedents is an appropriate and necessary strategy for developing customer satisfaction. Managers who understand the factors driving customers’ satisfaction and their choice of online store help their businesses to benchmark and guide future improvements (Vasic et al. Citation2018). Online marketing research postulates that consumers shop online for benefits, including the variety of products and the assurance of reliable delivery options (Torkzadeh & Dhillon, Citation2002; Xiao et al., Citation2018), which contribute significantly to greater website satisfaction (Alavi et al., Citation2016; Ladeira et al., Citation2016; Tzeng et al., Citation2020), better attitudes toward online shopping (Park et al., Citation2015), and greater online store loyalty (Garcia et al., Citation2020; Pandey & Chawla, Citation2018; Pandey et al., Citation2019).
The current study is the first to show the inclusion of measures of both product variety and product delivery in the online retail framework in the context of an emerging market such as South Africa. The study examines the moderating effects of e-commerce experience on the relationships between online shopping attributes, customer satisfaction, and loyalty towards web stores. The study theorises and tests a conceptual model with information quality, privacy concerns, perceived security, product variety, and product delivery as antecedents of customer satisfaction and loyalty towards retail websites. The research findings endeavor to improve the managerial implications of online retailing in the context of a modern society, and to enhance the existing literature by projecting how the e-commerce experience moderates the online shopping behaviour of South Africans.
Following this introduction, the paper discusses the literature, outlining the effects of the variables in the model, and defines its hypotheses. The paper then explains the research methodology used in data collection and data analysis. Thereafter the results are presented and discussed, and the paper ends with theoretical and managerial implications, including the limitations of the study.
2. Literature review
In South Africa, total retail spending increased from 1.2% in 2016 to 1.8% in 2017, with retail sales reaching the R1 trillion mark. This growth accounted for an increase of 22% annually from 2016, or R8 billion in extra value. In developed economies, the overall retail spending on online shopping has advanced (e.g., Britain is 19%, Australia is 7.2%, the United States of America is 10%, France is 14%, and Germany is 17%). Against these figures, the online retail market in South Africa is lagging behind, and many opportunities exist for growth in this market (Prinsloo, Citation2018). By 2018, the African e-commerce market was estimated at US$50 billion, and South African retail sales were expected to increase in the e-commerce channel share of total retail sales from 0.26% in 2011 to 1.93% in 2020 (Dennis & Piatti, Citation2015). To accelerate the growth of the e-commerce market, rigorous research is needed to understand the online shopping behavioural responses of South Africans towards e-commerce.
Online retailers should strive to achieve the strongest possible customer loyalty as their goal. As confirmed in the literature, this is influenced by satisfaction and various quality factors (Brusch et al., Citation2019). Studies continue to examine the impact of various factors on e-commerce satisfaction and loyalty (Al-dweeri et al., Citation2019; Faraoni et al., Citation2018; Garcia et al., Citation2020). Recent studies suggest that, when a website design can save shoppers time, makes it easy to use, offers information about product variety, and delivers items quickly, customers can become highly satisfied (Brusch et al., Citation2019; Raman, Citation2019). However, the measures of product variety and product delivery are seldom found in various e-service quality scales in the literature. Despite their significance as crucial e-commerce factors that influence customer satisfaction and loyalty, product variety and product delivery are hardly ever measured in the literature (Brusch et al., Citation2019; Haridasan & Fernando, Citation2018). Ahmad et al. (Citation2017), Brusch et al. (Citation2019), and Rita et al. (Citation2019) recommend including the variety of available products and delivery in future studies as key factors that might contribute to building e-loyalty. In closing this gap, this study builds and tests a conceptual model that examines the influence of information quality, privacy concerns, perceived security, product variety, and product delivery on online shopping customer satisfaction and loyalty in South Africa.
The literature indicates that product delivery, product variety, and product return are indispensable factors in customer service (Arora & Aggarwal, Citation2018; Raman, Citation2019). Rudansky-Kloppers (Citation2014) shows that convenience, delivery, and time saving are key motives for customers’ online shopping, while branding was the least relevant factor. She urges e-retailers in South Africa to improve their web design and product descriptions, price policies, advertisements, and delivery options, which would enhance online shopping, online customer satisfaction, and online sales, and ultimately close the gap between online shopping in South Africa and that in global markets. Business-to-Consumer (B2C) e-commerce in South Africa is largely untapped, and the competitive environment in online retail remains largely fragmented (Dennis & Piatti, Citation2015), with many traditional retailers’ websites competing with mainstream online stores (such as bidorbuy.co.za and Takealot.com). Rivalry is intensified by the rapid rate at which these online stores attract customers’ attention, and this eliminates the market opportunities for many traditional retailers to develop e-commerce customer loyalty.
E-loyalty refers a “consumer’s intention to purchase from a specific website, and not change to another website” (Cyr, Citation2008, p. 48). Today it is very difficult to identify a product that cannot be bought on Amazon.com or Amazon Marketplace (Brusch et al., Citation2019), which raises the guiding research questions of this study: Which online shopping attributes affect customers’ satisfaction and loyalty towards web stores in South Africa?, and How does the e-commerce experience moderate the interrelationships among online shopping attributes, customer satisfaction, and customer loyalty? Despite the exponential growth of e-commerce in South Africa (Dennis & Piatti, Citation2015), research has not yet been conducted to identify and examine the online shopping attributes that affect customer satisfaction and loyalty, moderated by e-commerce experience, which is a unique contribution of this study.
A discussion of the development of hypotheses to enhance the understanding of the paths in the conceptual model follows.
3. Information quality and customer satisfaction
Information quality refers to “a consumer’s perception of the accuracy, relevance, timeliness, completeness, consistency and the format of information presented on the website about products and transactions” (DeLone & McLean, Citation2003, p. 15). Product information pertains to detailed information about product features, consumer recommendations, evaluation reports, etc., and service information pertains to FAQs, promotional notifications, membership information, orders and delivery information, etc. (Tzeng et al., Citation2020). Customers generally expect quality information about products or services to help them make smarter purchase decisions, whether they are shopping in a physical store or online (Cyr, Citation2008); and potential customers on the Internet are particularly attentive to the quality of website information to help them make good purchasing decisions (C. Kim et al., Citation2008). Information quality is an important attribute for shoppers in an evaluation of the effect of website use, especially during the pre-purchase information search for products and services in e-retail (Tzeng et al., Citation2020). Without the opportunity to evaluate the physical product, shoppers act on incomplete information that might be incorrect, and face the consequences of risk or uncertainty in their purchase decisions (C. Kim et al., Citation2008). “E-retail perceived risk” refers to customers’ belief that online purchases could have serious consequences, such as losses caused by the Internet retailer, such as the non-delivery of products and the unauthorised use of the personal information that customers disclose (Fortes & Rita, Citation2016). Thus a well-designed website helps consumers to navigate and find the relevant quality information easily, reduces their uncertainty, and minimises e-retailer’s efforts to deliver post-purchase satisfaction (C. Kim et al., Citation2008; Luo et al., Citation2012; J. v. Chen et al., Citation2013).
Customers who are dissatisfied with a website’s information content will leave the website without making any purchases (Cyr, Citation2008). Research shows that websites that present quality information positively and significantly increase customer satisfaction (Sabiote et al., Citation2012; Szymanski & Hise, Citation2000; Tzeng et al., Citation2020). Park and Kim (Citation2003) found that product information quality is the most significant factor directly influencing user satisfaction, and that it is stronger than service information quality. Websites that present information quality help to cultivate consumer loyalty. Wang et al. (Citation2009) confirmed that information quality and the perceived value of firm-supported online communities directly and significantly affect customer trust, but that only information quality has a direct and significant impact on consumer loyalty. Al-Tit (Citation2020) found that the information quality provided on an online store represents the e-retailer’s quality dimension that contributes to developing consumer loyalty, as long as it is accurate, relevant, etc. Given these findings, the hypotheses proposed for the present study are:
Hypothesis 1: Information quality positively affects customer satisfaction with online retail websites
Hypothesis 2: Information quality positively affects customer loyalty to online retail websites
4. Privacy concerns and customer satisfaction
“Privacy concerns” refers to a person’s beliefs about the risks and the potentially negative consequences of sharing private information (Gogus & Saygın, Citation2019). “Internet privacy concerns” is a multi-dimensional concept. First, e-retailers relate them to concerns about the data collection process itself; second, the term refers to the inadequate use of this information (Roca et al., Citation2009). Users’ concern about organisational information privacy practices include collection, errors, unauthorised access, and the secondary use of data (Hwang & Kim, Citation2007).
Privacy concerns involves the protection of consumers’ information that is collected (with or without their knowledge) during their interaction with the online system, and that might influence the use of the system (Kassim & Abdullah, Citation2008). In particular, the unauthorised use of consumers’ personal information and communication issues such as the use of email are the main obstacles that reduce end-users’ intention to purchase goods or services online (Salo & Karjaluoto, Citation2007). Online retailers must increase their perceived privacy protection, which refers to consumers’ perception that the e-retailer will protect the confidential information that is disclosed during the online transaction from unauthorised use or theft (C. Kim et al., Citation2008). An enhanced perception of privacy increases consumers’ willingness to share private information on the Internet and to complete online purchases (Belanger et al., Citation2002), which indicates that perceived privacy is a key factor in consumers’ acceptance of online retail services (Roca et al., Citation2009). Consumer risk perceptions and concerns about online shopping relate to privacy. If consumers perceive the seller as unlikely to protect their privacy, they perceive a more significant risk that their personal information will be improperly used (C. Kim et al., Citation2008). Customers will refuse to disclose private information when websites request it (Roca et al., Citation2009), and will perceive a considerable injustice if they are not satisfied with the e-retailer’s actual information practice (Malhotra et al., Citation2004). Sabiote et al. (Citation2012) reveal the significant influence of privacy on the satisfaction of customers from cultures with a high level of uncertainty avoidance. Given these findings, a hypothesis proposed for the present study is:
Hypothesis 3: Privacy concerns positively affect customer satisfaction with online retail websites
5. Perceived security and customer satisfaction
“Security” refers to the ability of the website to protect customers’ private information that is shared during online transactions from unauthorised use or disclosure (Belanger et al., Citation2002; Roca et al., Citation2009). Security is a multidimensional concept. The dimension first relates to data and transaction security, while the second relates to the authenticity of consumers (Vasic et al. Citation2018). Perceived security is the most important and challenging issue for customers who want to purchase products or services online, especially if the vulnerabilities come from the website that facilitates the transaction (Belanger et al., Citation2002; M. Kim et al., Citation2011). If customers perceive that the website’s security assurance meets their expectation levels, they will disclose financial or personal information and will intend to purchase with comfort, which reveals the essence of security in acquiring and retaining customers as regular online store services patriots (Park & Kim, Citation2003). “Perceived security” refers to the subjective probability in customers’ eyes that information they share on the Internet during the online transactions, and that is storage, will not be stolen, or saved or shared with unauthorised parties (M. Kim et al., Citation2011). Customers subjectively believe in the evaluation of the probability that the transaction is secure (Chang & Chen, Citation2009), as the key consideration in the acceptance of e-commerce is not merely the objective security of the website, but consumers’ perceived subjective risk (Roca et al., Citation2009). If perceived security risk decreases, satisfaction with online retail services’ performance increases, showing that consumers’ positive perception of security will positively affect their satisfaction (Massad et al., Citation2006; Park & Kim, Citation2003; Szymanski & Hise, Citation2000). Given these findings, a hypothesis proposed for the present study is:
Hypothesis 4: Perceived security positively affects customer satisfaction with online retail websites
6. Product variety and customer satisfaction
“Product variety” refers to the depth or breadth of a retail store’s product assortment (Chang, Citation2011). Product variety, type of product, and well-known brands are different product factors pertaining to the quality of the products and services for sale, which entail the wide range of products and services that can be purchased online, and the brands that a retail store provides (Rudansky-Kloppers, Citation2014).
As consumers may not actively evaluate the actual number of products, they rely instead on various cues to evaluate product variety, product displays, and product organisation, which may influence perceived product variety in brick-and-mortar stores (Broniarczyk et al., Citation1998). Thus they view products through filtered web pages, rather than seeing them displayed together on the same page. That is, consumers do not perceive visual merchandise in isolation, but consider additional dimensions related to visual display when developing their perceptions (Park et al., Citation2015), such as colour, variety of product displays, and the ease of locating them (Ladeira et al., Citation2016), which shows that e-retailer must have a large product selection (Brusch et al., Citation2019). Chang (Citation2011) suggested that researchers examine product variety perceptions specifically in an online shopping setting, and thereby extend the studies that have concentrated only on brick-and-mortar shopping behaviour. Research indicates that perceived, rather than actual, product variety affects consumer behaviour (Kahn & Wansink, Citation2004). Chang (Citation2011) studied the effect of product variety on consumers’ preferences and choices. Despite the disputable direction of this effect, he concluded that the product category in an online store affects perceived variety, such that an appropriate categorisation helps consumers to navigate the website easily and with greater pleasure, which generates better attitudes toward the online retail store and increases purchase intentions. The literature shows that a larger product assortment relates to greater satisfaction, as it enhances the chances of a match between the consumer’s preference and the available alternatives (Chang, Citation2011; Lancaster, Citation1990). Brusch et al. (Citation2019) found that the product portfolio strongly affects the satisfaction of customers of a niche provider. Given these findings, a hypothesis proposed for the present study is:
Hypothesis 5: Product variety positively affects customer satisfaction with online retail websites
7. Delivery and customer satisfaction
“Fulfilment” refers to activities that ensure that customers receive what they have ordered, and includes the time of delivery, order accuracy, and delivery condition (Rita et al., Citation2019). Consumers rate delivery price guides, delivery guarantees, and delivery schedules as key information that they expect prior to online shopping (Darley et al., Citation2010; Page-Thomas et al., Citation2006). Customers also evaluate the attributes of delivery time, such as (1) the overall minimisation of delivery time, (2) alerts about any potential delays in shipping, and (3) a shipment tracking number (Raman, Citation2019; Sharma & Aggarwal, Citation2019). The multichannel literature posits that customers evaluate a utility function, including the acquisition utility (i.e., product quality, promotions, and purchase costs) and the transaction utility (i.e., benefits of reduced search cost, convenience, and fast home delivery), when making purchase decisions (Chintagunta et al., Citation2012).
Customer services that are important in online retail, such as easy return policies and faster delivery services, significantly affect consumers’ purchase decisions (Raman, Citation2019), which indicates that faster and timely home deliveries increase the sense of value that customers receive from their online purchase (Hult et al., Citation2019). In fact, product delivery affects all the fundamental value proposition objectives (Lin et al., Citation2011). Even if customers feel comfortable when they have faith in the company’s delivery, regardless of the channel of shopping (Hult et al., Citation2019), timely delivery of the product is one of the foremost expectations that online shoppers have of online retailers (Raman, Citation2019). Shih (Citation2004) found a strong and significantly positive impact of individual attitudes towards online shopping on users’ acceptance of taking online delivery. As consumers ascribe immense importance to the completion of online transactions and the delivery of products in online shopping (Raman, Citation2019), e-retailers should provide customers with superior service quality by ensuring delivery timeliness, order accuracy, and excellent delivery conditions (Rita et al., Citation2019). Delivery factors such as perceived delivery time positively affect customer satisfaction (Brusch et al., Citation2019; Chou et al., Citation2015). Timely and reliable delivery improves satisfaction so that shoppers repurchase, which shows that timely delivery increases customer satisfaction (Lin et al., Citation2011). Consequently, the longer that customers have to wait between ordering and receiving the product, the greater the chances that they will feel anxious and discontented (Chou et al., Citation2015; Raman, Citation2019), as delays negatively affect customer satisfaction (Liu et al., Citation2008). Tzeng et al. (Citation2020) indicated that the entire delivery procedure of returned item logistics affects customer’s patience, as well as producing online shopping displeasure. Given these findings, a hypothesis proposed for the present study is:
Hypothesis 6: Product delivery positively affects customer satisfaction with online retail websites
8. Customer satisfaction and customer loyalty
Customer satisfaction is a central tenet of interest in the field of marketing (Chiu & Cho, Citation2019), and is considered to be the primary marketing objective (Kotler, Citation2000). The traditional marketing literature has generally acknowledged a cumulative satisfactory experience as crucial to helping satisfaction episodes to become holistic and to affecting loyalty (Garbarino & Johnson, Citation1999; Oliver, Citation1999). This paper is anchored in the domain of studies (Chang & Chen, Citation2009; Kassim & Abdullah, Citation2008; Massad et al., Citation2006) that view satisfaction as the outcome of customers’ cumulative impressions of the performance of a specific website. The cumulative effect of a series of service encounters is a customer’s overall evaluation of the total purchase and consumption experience over a specific period, and is known to provide a robust evaluation of a firm’s performance (Fornell, Citation1992). In e-commerce, satisfaction is defined as an affective state that represents the consumer’s emotional reaction to the entire transaction experience with an online retailer (Faraoni et al., Citation2018; Pandey & Chawla, Citation2018). This shows that, when a customer feels satisfied, the affective components may become more relevant than the cognitive aspects (Kassim & Abdullah, Citation2008). In comparison with cognitive experience, affective experience significantly influences the satisfaction of customers and positive word-of-mouth in a successful shopping context (Barari et al., Citation2020); thus satisfaction is defined as a consumer’s affective attitude towards a relationship (Menidjel et al., Citation2020).
In the literature, satisfaction is the level of gratification a buyer reaches after comparing the purchase experience and the perceived expectations with the post-purchase experience (D. J. Kim et al., Citation2009), which shows that the direct determinant of satisfaction is expectation (Maditinos & Theodoridis, Citation2010). D. J. Kim et al. (Citation2009) defined “expectation” as a consumer’s belief about what he or she should or will obtain after a specific online transaction. They argued that expectations are not only important sources of relevant information (along with confirmation) to arrive at a level of satisfaction, but also that customers are biased toward adjusting their satisfaction level so that it is consistent with their prior expectations. Nevertheless, unless expectations are met in the total shopping, purchase, or service experience, there is less likelihood that customers will feel satisfied or lean towards building loyalty to an e-retailer (Anderson & Srinivasan, Citation2011). Only shoppers who experience a series of discrete satisfying experiences with the online retailer will progress to the stage of loyalty (Massad et al., Citation2006). Menidjel et al. (Citation2020) found that satisfaction positively influences customers’ behavioural loyalty. However, consumer loyalty related to repurchase behaviour will manifest in a weak commitment, as consumers repurchase the same brand because the search for alternatives is not worth the time and effort it would need (Oliver, Citation1999). Thus attitudinal loyalty is the strongest commitment held by the consumer towards the brand (Chaudhuri & Holbrook, Citation2001).
Although satisfaction relates to the attitudinal levels of loyalty, and is the single most important determinant of customer loyalty in both online and offline settings (Li et al., Citation2015; Slack & Singh, Citation2019), satisfaction plays a key role and greatly affects e-commerce consumer loyalty, owing to faceless transaction exchanges (Castaneda, Citation2011; Ribbink et al., Citation2004). Satisfied customers are more loyal to a brand or a store than customers who rely on other reasons, such as time restrictions and information deficits; and the Internet extends this concept further, because online customers spend a long time in searching for and collecting quality product or store information; and this largely influences their purchase decision (Ahmad et al., Citation2017). Cyr (Citation2008) shows that online satisfaction strongly relates to the loyalty of Canadian, German, and Chinese consumers. Given these findings, a hypothesis proposed for the present study is:
Hypothesis 7: Customer satisfaction positively affects customer loyalty to online retail websites
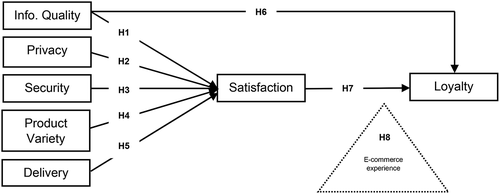
Cumulatively, the present work proposes the research model shown in .
Figure 1. Proposed research model
9. Methodology
9.1. Sampling and data collection
A quantitative research study that was descriptive in nature was conducted to examine the effects of online shopping attributes on customer satisfaction and loyalty towards tweb stores in South Africa, moderated by e-commerce experience. The study sampled both male and female respondents in the age group ranging from 18 to 60 years old who had more than six months’ online shopping experience. With a 37% e-commerce penetration in South Africa, about 22 million consumers shopped online in 2020, and this number is expected to grow by 44% to 32 million users by 2024, as the most prominent reasons for an increase in online shopping include convenience (26%) and the effects of COVID-19 restrictions (25%) (Schaefer & Bulbulia, Citation2021). A non-probability convenience sampling method was used to select 305 online shoppers in Gauteng Province, South Africa using Yamane’s (Citation1967, p. 886) formula (n = 22, 000 000 respondents from /1 + 22, 000 000(0.05)2 = 305). This formula is expressed as: where “N” is the sample size, “n” is the population size (total number of active subscribers), and “e” is the sample error (0.05). This sample size formula is recommended to calculate the sample size (Israel, Citation1992). The sample size was equivalent to those in studies of online retail services (350 in Alavi et al., Citation2016, p. 316 in Al-dweeri et al., Citation2019, p. 250 in Faraoni et al., Citation2018, p. 351 in Z. Chen et al., Citation2012). To achieve total sample representativeness, the filter questions identified customers who purchased products and services regularly from online stores and retailers’ websites. Respondents in Gauteng Province who were willing to participate in the study by self-administering the questionnaires were targeted. Gauteng Province has the largest share of the South African population: it is home to around 14.7 million people, or 25.4% of the total population (StatsSa, Citation2018. p. 1). In economic terms, the gross domestic product by region (GDP-R) in Gauteng Province reached R455 billion in 2015 (Creecy, Citation2016), surpassing other provinces, which has been the trend over the past 20 years (Mushongera et al., Citation2017). In technology terms, Gauteng Province has used the Universal Access and Service Fund (UASF) to establish free public Wi-Fi networks, creating opportunities for more people to be online (Gillwald et al., Citation2018). However, many South Africans use the Internet for social networking (73%), educational purposes (44%), work-related reasons (27%), employment searches (27%), and Internet banking (17%); only a small fraction use it for online shopping (10%) and government services (8%), with income as the primary driver of online banking and shopping (Gillwald et al., Citation2018).
The ethical behaviour of the researcher (i.e., protecting respondents’ right to the confidentiality of the data disclosed) and the ethical treatment of the participants (i.e., informed consent, debriefing about the purpose of the study, and protecting privacy) were all followed to guide the research process. The data collected was processed (i.e., cleaned, edited, coded, and tabulated) in the Statistical Package for the Social Sciences (SPSS) version 27 for Microsoft Windows to analyse the descriptive statistics. A total of 287 completed questionnaires resulted in a 94.09% sample response rate, of which 61.3% were female and 38.3% were male. The demographic profiles of the respondents are presented in .
Table 1. Demographic profiles
10. Measures
The survey questionnaire, written in English, contained the filtering questions and a covering letter outlining the purpose of the study. The respondents completed two sections; Section A collected data on demographic factors such as age, gender, monthly spending in Rands, the websites preferred for purchases, the length of their e-commerce experience, and the kinds of products purchased. The data used to test the significant effect of the independent variables on the dependent variables was captured in Section B, comprising empirically validated scale items from the e-commerce literature. Information quality [IQ] measured six items, and perceived security [PS] measured four items, all adapted from Park and Kim (Citation2003). Privacy concerns [PS] measured three items adapted from Z. Chen et al. (Citation2012). Product variety [PV] measured five items adapted from Liu et al. (Citation2008). Product delivery [PD] measured four items adapted from Z. Chen et al. (Citation2012) and Liu et al. (Citation2008). Customer satisfaction [CS] measured four items adapted from Kassim and Abdullah (Citation2008) and Ribbink et al. (Citation2004). Customer loyalty [CS] measured four items adapted from Ribbink et al. (Citation2004). All 30 scale items in the questionnaire were aligned with the purpose of this study, and each respondent was asked to evaluate the relevance of each item, with their responses being measured using a five-point Likert scale ranging from 1 = strongly disagree to 5 = strongly agree.
11. Results
The descriptive statistics, such as mean, median, and standard deviation (Pallant, Citation2010), were tested using SPSS version 27 for Microsoft Windows. Before analysing and testing the measurement model, the data was diagnosed for outliers. A multicolleniarity test was conducted. The tolerance and variance inflation factor (VIF) showed that multicollinearity did not exist in the variables measured in this study, as the VIF was below 0.5 and the tolerance value was greater than 0.20 (J. F. Hair et al., Citation2012). If the value of the VIF is very small (less than 0.10), it would indicate that the multiple correlation with other variables is high, suggesting the possibility of multicollinearity. Notably, the independent variables in the conceptual model did not indicate any threat to the dependent factors (Pallant, Citation2010). An exploratory factor analysis (EFA) revealed the Kaiser-Meyer-Olkin (KMO) measure of sampling adequacy (Kaiser, Citation1970, Citation1974) = 0.892, and Bartlett’s test of sphericity (Bartlett, Citation1954), with approx. chi-square = 5790.980, with degree of freedom = 435, which is significant at p < .000. Tabachnick and Fidell (Citation2007) believe that the KMO index should range from 0 to 1, with a value of 0.6 showing a good factor analysis. The results indicated the seven-factor model components with eigen values above 1 [privacy concerns = 1.062; 73.43%], [product delivery = 1.286; 69.89%], [customer satisfaction = 1.573; 65.60%], [customer loyalty = 2.200; 60.36%], [perceived security = 2.624; 53.03%], [product variety = 3.397; 44.28%], and [information quality = 9.886; 32.96%]. These seven components together explained 73.43% of the variance. presents the rotated component matrix using principal component analysis, with the varimax rotation method and Kaiser normalisation, with rotation converged in six iterations. In EFA, all the scale items with factor loadings above 0.60 are considered acceptable (Bagozzi & Yi, Citation1988), showing the internal consistency reliability of the seven-factor model. The factor loadings ranged from the lowest (product delivery [PD1 = 0.630]) to the highest (perceived security [PS2 = 0.882]). In respect of Cronbach’s alpha (Cronbach, Citation1951), four items for customer satisfaction had a Cronbach’s alpha = 0.920. Six items of information quality had a Cronbach’s alpha = 0.903. Customer loyalty had four items with a Cronbach’s alpha = 0.894. Perceived security with four items had a Cronbach’s alpha = 0.891. Product variety had five items with a Cronbach’s alpha = 0.853. Product delivery with five items had a Cronbach’s alpha = 0.852. Last, privacy concerns had three items with a Cronbach’s alpha = 0.829. All the factors had Cronbach’s alpha values greater than 0.7, as recommended by Malhotra (Citation2007). Thus a composite reliability greater than 0.7 shows a good construct reliability, and the Cronbach’s alpha may not be of use (J. F. Hair et al., Citation2012).
Table 2. The rotated component matrix
The parametric tests (i.e., t-tests, analysis of variance) showed assumptions about the population from which the sample was drawn. These included the assumptions related to the shape of the population distribution (i.e., normally distributed) (Pallant, Citation2010). For example, Appendix A shows that the data collected from the 287 respondents on their perceptions of the online shopping attributes and their impact on the satisfaction and loyalty dimensions ranged from 1 to 5 for all items measured. The values of the mean ranged from the lowest (customer loyalty [CL3 = 3.64]) to the highest (product delivery [PD4 = 4.33]). The values of the standard deviation ranged from the lowest (product variety [PV3 = 0.663]) to the highest (perceived security [PS2 = 1.191]).
The descriptive statistics also provide information about the distribution of the scores for the continuous variables (skewness and kurtosis). Appendix A shows the measures of skewness and kurtosis that were used to test the extent to which items were plotted or scattered on the normal standard distribution (Pallant, Citation2010). The skewness value indicates the symmetry of the distribution; if the distribution is perfectly normal, the skewness and kurtosis values will equal zero. With a standard error of skewness value equal to 0.144 and a standard error of kurtosis equal to 0.287, Appendix A shows no positive skewness values (items do not group on the left at the low values), whereas the negative skewness values ranging from the lowest (customer loyalty [CL3 = -0.627]) to the highest (information quality [IQ4 = -1.194]) show a grouping of items at the high end (right-hand side of the graph). Positive kurtosis values ranging from the lowest (perceived security [PS3 = 0.222]) to the highest (product variety [PV1 = 4.262]) show that the distribution was rather peaked (items grouped in the centre) with long thin tails. The kurtosis values below zero [>0] show a distribution that was relatively flat (too many cases in the extremes). The corrected item-total correlation values show the degree to which each item correlates with the total score, while low values (less than 0.3) indicate that the item is measuring a different phenomenon from the scale as a whole (Pallant, Citation2010). As shown in Appendix A, the corrected item-total correlations ranged from the lowest product variety [PV2 = 0.588]) to the highest (customer satisfaction [CS2 = 0.863]). All these values were above 0.5, indicating a good internal consistency and reliability of the factors (Pallant, Citation2010). The squared multiple correlations ranged from the lowest (product delivery [PD1 = 0.375]) to the highest (customer satisfaction [CS2 = 0.749]). The values close to 1 show a strong correlation between the factors (Malhotra, Citation2007). The measurement model is presented in the next section.
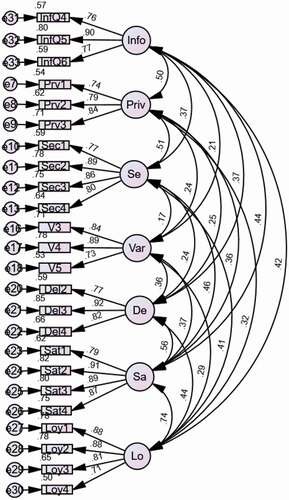
12. Measurement model
The seven-factor model in the study was tested in AMOS version 27 for Microsoft Windows using structural equation modelling, which is a two-step analytical procedure for first testing the measurement model and then the structural model (J. C. Anderson & Gerbing, Citation1988). The aim was to obtain a robust explanation of the relationships proposed in the conceptual model that were developed on the basis of an extensive literature review. First, the measurement model for all seven constructs was tested using a confirmatory factor analysis (CFA) of the interrelationships among the factors, which were allowed to inter-correlate freely (J. C. Anderson & Gerbing, Citation1988). The first step in a reflective measurement model assessment involves examining the indicator loadings. As Hair et al. (Citation2019) recommended, loadings above 0.708 indicate that the construct explains more than 50% of the indicator’s variance, thus providing acceptable item reliability. Appendix A shows that the factor loadings of the standardised regression weights of the first CFA ranged from the lowest (product delivery [PD2 β = 0.644; t-value = 12.084]) to the highest (customer satisfaction [CS2 β = 0.907; t-value = 17.634]). The second step was to assess internal consistency reliability. While values between 0.60 and 0.70 are viewed as acceptable in exploratory research, values between 0.70 and 0.90 range from satisfactory to good, while values of 0.95 and higher are problematic, as they indicate the items’ redundancy, thereby reducing construct validity (Hair et al. Citation2019). The confirmatory factor analysis resulted in four items ([PV1 = 0.656], [PV2 = 0.644], [PV5 = .686], and [PD1 = 0.653]) being between 0.60 and 0.70. J. F. Hair et al. (Citation2014) recommended that the model also be diagnosed to determine the path coefficient values, standardised on a range from -1 to +1, with the coefficients closest to +1 showing strong positive relationships, while the coefficients closest to -1 represent strong negative relationships. According to Jöreskog et al. (Citation1999), a correct model contains standardised residual covariances of less than 2 in absolute value. Therefore the items [PD1 = 0.65], [PV2 = 0.64], and [PV1 = 0.63] were each deleted after rotation. Privacy concerns had a strong correlation with information quality [0.52], which had six items with factor loadings above 0.7; and so the lowest [IQ6 = 0.76] and [QI5 = 0.73] were each deleted after rotation. Guided by the descriptive statistics, the lowest mean value [IQ2 = 4.09; std dev. = 0.793] had the highest factor loading [IQ2 = 0.83] and was deleted first, followed by [IQ1 = 0.72] and [IQ3 = 0.68]. Thereafter the factor loadings of all the items in the variables were above 0.7, verifying the convergent validity of the data (Hair et al. Citation2019), showing “a positive correlation among all the items of each factor” (Pallant, Citation2010, p. 183).
The scales were further verified by determining the average variance extracted (AVE) above 0.50, which indicates the discriminant and convergent validity (Fornell & Larcker, Citation1981). An AVE of 0.50 shows that the factor accounts for more than half of the variance of its scale indicators (J. F. Hair et al., Citation2014). Support is provided for convergent validity when each item has outer loadings above 0.70 and when each construct’s average variance extracted (AVE) is 0.50 or higher (J. F. Hair et al., Citation2014). shows the results for discriminant validity, while and Appendix A present the standardised factor loadings of the measurement model above 0.7, which shows composite reliability (J. F. Hair et al., Citation2014) and is viewed as highly acceptable for internal consistency reliability (J. F. Hair et al., Citation2012). The composite reliability (CR) for each factor exceeded the minimum recommended value of 0.70, which indicates an acceptable reliability for all the factor correlations (Fornell & Larcker, Citation1981). The average variance extracted (AVE) tests “the amount of variance that is captured by the construct in relation to the amount of variance due to measurement error” (Fornell & Larcker, Citation1981. p. 45), with the minimum acceptable value for AVE of 0.50 showing that all seven constructs in this study had a reliable measurement structure.
Finally, to test the discriminant validity of all constructs, Fornell and Larcker (Citation1981) insist on examining whether any two constructs are distinctive or dissimilar. For example, the square root (√) of the AVE for every factor is compared with the factor correlation coefficients with other factors (Fornell & Larcker, Citation1981). The results of the square root of AVE for each variable (bold values) were greater than the correlation of each factor in the model, which showed discriminant validity (Hair et al. 1992) represented by the square root (√) of the AVE, shown in bold (>0.7) in .
Given the discriminant validity of the measurement model, the model was assessed for a good fit. The ratio of chi-square minimum to degree of freedom (CMIN/DF) was 349.431/231 = [1.513], which was below the acceptable cut-off criterion of 3.00 (Hair et al. 2006). Hair et al. (2006) state that indices such as GFI, CFI, IFI, and TLI must be greater than 0.9 and that the root mean square error of approximation (RMSEA) value must be less than 0.1. Given the sensitivity of chi-square statistics to the sample size, other indices can be used (Hair et al. 2006). In the absence of GFI and AGFI, the measurement model showed good fit indices values of CFI = [0.973], TLI = [0.965], IFI = [0.973], RFI = [0.903], and NFI = [0.925]. The RMSEA was found to be 0.041, below the cut-off level of 0.6 (Schreiber et al., Citation2006). These values were found to be high in each case for loadings in the measurement model (see ), thus resulting in convergent validity, as shown in Appendix A and confirmed by the statistical significance of the variables established through the “t” test statistic (critical ratio).
shows the estimates of the correlations among the exogenous variables, ranging from the lowest between perceived security and product variety [PS <–> PV = 0.168] to the highest between customer loyalty and customer satisfaction [CL <–> CS = 0.738]. The lowest estimate of the squared multiple correlations was for customer loyalty [CL4 = 0.498]. In other words, the error variance of CL4 was 49.8% of the variance of CL4 itself. The highest estimate of the squared multiple correlations was for product delivery [PD3 = 0.853]. In other words, the error variance of PD3 was 85.3% of the variance of PD3 itself.
Figure 2. Measurement model
13. Structural model
Structural equation modelling can be calculated with a maximum likelihood estimation to evaluate the specified paths in the hypothesised model (J. C. Anderson & Gerbing, Citation1988). The five exogenous variables and the two endogenous variables were tested to ascertain the strength of the proposed model and of the hypotheses. The overall fit indices for the structural model were as follows: CMIN/df = 350.958/235 = [1.493]; CFI = [0.974]; NFI = [0.925]; IFI = [0.974]; TFI = [0.904]; TLI = [0.966]; RMSEA = [0.040]. All the fit indices showed a good fit between the structural model and the data, thus providing a sounder basis for testing the hypothesised paths in the conceptual model (see ). The general findings are shown in . shows that four of the five observed variables of product delivery [β = 0.375; t-value = 5.911, p < 0.001], perceived security [β = 0.279; t-value = 4.396, p < 0.001], information quality [β = 0.159; t-value = 2.424, p < 0.015], and product variety [β = 0.148; t-value = 2.617, p < 0.009] were found to have a positive and significant impact on customer satisfaction. Customer satisfaction [β = 0.689; t-value = 10.542, p < 0.001] and Information quality [β = 0.119; t-value = 2.135, p < 0.033] had a positive and significant influence on customer loyalty. Four hypotheses [H6, H4, H1, and H4] were accepted as predictors of online shopping customer satisfaction, while two [H7 and H2] were accepted as determinants of customer loyalty. Privacy concerns [H3] did not affect customer satisfaction in this study.
Figure 3. Structural model
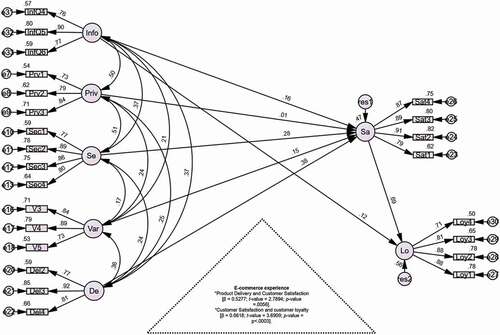
Table 3. Discriminant validity
Table 4. Structural model results
The final model’s structural path coefficients and the squared multiple correlation coefficients in the model are shown in . Customer satisfaction had 0.47 and customer loyalty had 0.56. This indicates that product delivery, perceived security, information quality, and product variety explained 48% of the variance in online shopping customer satisfaction, while satisfaction and information quality explained 56% of the variance in customer loyalty. The overall findings supported six of the seven tested hypotheses.
14. E-commerce experience (control variable)
In the e-commerce literature, Prashar et al. (Citation2017) indicate the importance of future research to measure Internet usage experience and online shopping experience as moderating variables. Menidjel et al. (Citation2020) tested relationship length as a moderator of the influence of consumer personality attributes on perceived relationship investment, relationship quality, and loyalty in the retail industry. Pappas et al. (Citation2014) confirmed that experience has moderating effects on the relationships between performance expectancy and satisfaction, and between satisfaction and repurchase intention. Despite this empirical evidence in the literature, no research shows a multicategory view of the moderating effect of e-commerce experience on the impact of online shopping dimensions on customer satisfaction and loyalty. To close this gap, this study used the PROCESS regression technique of Hayes (Citation2013) to test the role of e-commerce experience, following the nomological validity of this study (i.e., the results supporting the theoretical views of the related literature) (Malhotra, Citation2007).
Considering satisfaction as a customer’s overall contentment with the online experience driven by information quality, which were both significant determinants of online shopping customer loyalty in this study, this study investigated hypothesis 8, which examines the influence of multi-group e-commerce experience (i.e., categories of the length of time for which a customer has been using the website) on the interrelationships in the structural model. E-commerce experience (the control variable) was tested on multicategorical data (with an analysis of effect). The aim was to identify a group in the sample that best describes how e-commerce experience moderates the influence of perceived online shopping attributes on satisfaction and loyalty: was it for customers who fall into the categories of a long or a short length of time of e-commerce experience?
shows the results of the moderating effects in various categories of e-commerce experience, with two significant interaction effects. shows that the moderating effect of e-commerce experience, analysed from the sample of size of 287, was coded using e-commerce experience (the control variable) as a multicategorical variable. All the respondents in the sample fell into the first category of shoppers with at least six months’ experience or more (W1 = [-1.000]). Therefore the analysis began with the second category [code = W2].
Table 5. Moderation of e-commerce experience (control variable)
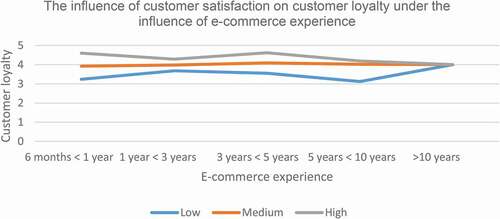
shows that the first regression model of the moderating effect of e-commerce experience on the influence of product delivery on customer satisfaction explained 32.3% of the variance [R = 0.3231], [R2 = 0.5684], and [F = 11.9338] significant at p < 0.0000. The constant sum of the effect [β = 1.9243; t-value = 2.2812; p-value = 0.0233] was significant [p < 0.0233] [LLCI = 0.2637; ULCI = 3.5849], and product delivery [β = 0.5277; t-value = 2.7894; p-value = 0.0056] [LLCI = 0.1553; ULCI = 0.9002] was significantly and directly affected. The results show the significant interaction effect [β = 1.0489; t-value = 2.6410; p-value = 0.0087] of e-commerce experience on the impact of product delivery on customer satisfaction [LLCI = .2670; ULCI = 1.8308]. The moderating effect of e-commerce experience [β = -4.6195; t-value = -2.7994; p < .0055] on the impact of product delivery on customer satisfaction was significant for online shoppers in the category of five years or longer but less than 10 years [LLCI = -7.8681; ULCI = -1.3710].
The second regression model of the moderating effect of e-commerce experience on the influence of customer satisfaction and customer loyalty explained 46.3% of the variance [R = 0.6805], [R2 = 0.4630], and [F = 21.5563], significant at p < 0.0000. Thus the constant sum of the effect [β = 1.1748; t-value = 1.4635; p-value = <0.1445] was not significant [LLCI = -0.4055; ULCI = 2.7551], although customer satisfaction [β = 0.6618; t-value = 3.6909; p-value = p < 0.0003] [LLCI = .3088; ULCI = 1.0148] was significantly and directly affected. E-commerce experience had a significant interaction effect [β = -2.2209; t-value -1.9986; p-value = 0.0466] on the impact of customer satisfaction on customer loyalty [LLCI = -4.4085; ULCI = -0.0333]. The moderating effect of e-commerce experience [β = 0.5309; t-value = 1.9529; p < 0.0518] on the impact of customer satisfaction on customer loyalty was significant for online customers in the category of five years or longer but less than 10 years [LLCI = -0.0043; ULCI = 1.0661]. shows the results of the moderation of e-commerce on the relationship between product delivery and customer satisfaction. presents the findings of the moderation of e-commerce on the relationship between customer satisfaction and customer loyalty.
Figure 4. Moderation of e-commerce on the relationship between product delivery and satisfaction
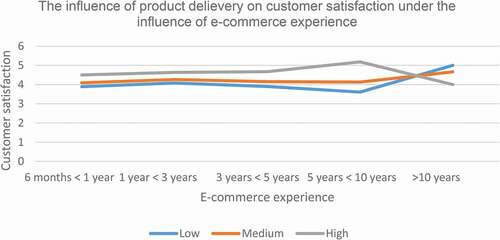
Figure 5. Moderation of e-commerce on the relationship between customer satisfaction and loyalty
More interestingly, Schaefer and Bulbulia (Citation2021) show the usage of online services for purchases by frequency of online shopping in a sample of 940 online shoppers in South Africa, in which 42% of online shoppers use an online retailer (e.g., Takealot, Superbalist) monthly, 21% weekly, 5% daily, and 1% more than once a day. However, support for Amazon among South African online shoppers decreased from 53% in 2014 to 13% in 2018. The biggest concerns included the delivery cost and the import duties that make Amazon products very expensive in South Africa. Clearly, as more online products are now bought locally, it would be expected that Amazon would open distribution and warehouse facilities (fulfilment centres) in South Africa (Prinsloo, Citation2018). Amazon has also moved into supplying its own branded products (AmazonBasics). Its position as a platform for buyers and sellers gives the company information about which products are selling at what prices and to which customers. Some merchants have accused Amazon of using this data to copy their products and to introduce cheaper (and more highly visible) versions on its website (Guterres, Citation2019). These market conditions necessitate an analysis of customers’ preferred online shopping websites, to examine the confidence of customers when purchasing from their preferred websites. gives the descriptive statistics of the websites preferred by South African online shoppers, analysed using bootstrap sampling at a 95% level of confidence. Takealot.com [n = 108; 35.4%] had [LLCI = 30.2; ULCI = 41.3], showing that, of the number of online shoppers who prefer Takealot.com [n = 108; 35.4%], about 41.3% [std error = 2.9] confidently purchase from this website. This was followed by Spree.com [n = 48; 15.7%] with [LLCI = 11.5; ULCI = 20.0], indicating that, of the online shoppers who prefer Spree.com [n = 48; 15.7%], about 20% [std error = 2.2] confidently purchase from this website. Last, Amazon.com [n = 37; 12.1%] had [LLCI = 8.5; ULCI = 15.7], revealing that, among the online shoppers who prefer Amazon [n = 37; 12.1%] about 15.7% [std error = 1.9] confidently prefer to purchase from this website. Thus there could have been many online shoppers in this study [n = 60; 19.7%] who preferred to purchase from websites other than Takealot.com, Zando.ac.za.
Table 6. Websites preferred when making online purchases
15. Discussion and implications
Considering the growth of the e-commerce sector in South Africa, researchers have offered very limited convincing evidence about understanding online shoppers’ behaviour. Given the signs of the exponential growth of the e-commerce industry in South Africa and globally, the strategic approach is for online retailers to acquire an understanding of the online shopping attributes that satisfy online consumers and develop loyalty towards their websites. With a lack of studies that examine the relationship between the online shopping attributes that influence the behaviour of online consumers in emerging market economies such as South Africa, a clear understanding of e-commerce marketing strategies for converting Internet consumers into loyal online store shoppers is needed. This study examined customers’ perceptions of online shopping attributes and the behaviours of satisfaction and loyalty with a consideration of the moderating effect of e-commerce experience in South Africa. The main purpose of the present study was examine the impact of perceived information quality, privacy concerns, perceived security, product variety, and product delivery on online shopping customer satisfaction and loyalty, if any. This study has reported the validity of product delivery, product variety, perceived security, and information quality as significant predictors of customer satisfaction. The results of this study have further validated the significant relationship between customer satisfaction and customer loyalty, between and information quality and customer loyalty.
This paper is in the stream of the literature on the Delone and McLean’s Information System success theory and on Oliver’s expectation disconfirmation theory in order to explain the influence of online shopping attributes on online consumers’ behaviour. The golden thread in this paper is its ability collectively to measure the factors influencing online consumers’ satisfaction and loyalty in the South African context by validating the moderating role of e-commerce experience. The results of this research corroborate the proposed conceptual model, providing empirical evidence that supports six of the seven hypotheses. Four of the five predictors of customer satisfaction showed relative important variance. Information quality had a weaker impact on customer satisfaction than the other online shopping factors. This showed the importance of improving customer satisfaction by focusing on the other e-commerce elements in the model ahead of information quality. The results of the scientific analysis in this study showed that the factors that affect satisfactory online shopping outcomes relate to product delivery, product variety, perceived security, and information quality as key antecedents of satisfaction. whose role in the business exchange that aims to develop customer relationships in the long term will influence customer loyalty towards an online shopping website.
Product delivery, perceived security, product variety, and information quality were identified as the determinants of customer satisfaction in the online shipping context in the South African e-commerce industry. This supports the results of Rudansky-Kloppers (Citation2014), who found product variety to be a key sub-component in the product factors identified in the model in South Africa. Similarly, Z. Chen et al. (Citation2012) and Liu et al. (Citation2008) found that product variety and delivery performance were relevant factors affecting online shopping satisfaction. This shows that timely delivery and the opportunity for customers to choose from a wide range of products are relevant strategic implications for online managers. Online retailers should provide a flexible order fulfillment, including a variety of product delivery options (Vakulenko et al., Citation2019; Xiao et al., Citation2018), and also prioritise being competent in delivering the right order on time, which would improve customer satisfaction and loyalty (Haridasan & Fernando, Citation2018; Khan et al., Citation2019). Customers should be provided with quality information, making them aware of delays in order to reduce their disappointment when the delivery time is not met. This study revealed satisfaction and information quality as significant determinants of customer loyalty. As customers’ needs, perceptions, and preferences differ, it is advisable to offer a variety of products of different sizes, features, colours, etc. Advances in e-commerce address these concerns through clear products displays, product reviews, prices, delivery options, etc. (Ribadu & Rahman, Citation2019). This study confirmed the key role of the moderating effect of e-commerce experience in the online shopping context of the emerging African market, supporting the e-commerce literature (Menidjel et al., Citation2020; Prashar et al., Citation2017) that confirms the importance of research studies that measure the Internet usage experience and e-commerce experience as moderating factors. Pappas et al. (Citation2012) verified the moderating effect of experience on the relationship of certain antecedents with satisfaction, and on the relationship of satisfaction with repurchase intention. More effort is needed to mitigate consumer concerns about online security; and enhancing e-commerce experiences (e.g., delivery efficiency) could help to generate high levels of shopper satisfaction, which in turn would increase their loyalty (Chou et al., Citation2015). This study reveals the moderating effect of e-commerce experience, implying that customers would be highly satisfied with their online shopping experiences if e-retailers could guarantee the quick delivery of items. Although e-retailers claim to offer superior freshness and quality, it is important to note that shoppers often face the perceived risk that the quality of the purchased product might deteriorate before delivery (Mortimer et al., Citation2016). This is similar to the finding of Raman (Citation2019) that quick product delivery and easy product returns will significantly enhance shoppers’ positive experience. The moderating effect of e-commerce experience is strong for shoppers with five to ten years of e-commerce experience.
16. Theoretical contributions
Supporting the findings of earlier studies that have examined the impact of delivery on online shoppers’ buying behaviour (Chou et al., Citation2015; Lin et al., Citation2011), the present work has confirmed that delivery has a strong and significant impact on online shoppers’ satisfaction. This paper supports the results from previous studies (Brusch et al., Citation2019; Rudansky-Kloppers, Citation2014) that show the impact of broad product variety on customer satisfaction. In this study, the perceived security of online shopping is considered the second most important determinant of customer satisfaction. This result supports the observation that perceived security risk affects e-commerce customer satisfaction (Massad et al., Citation2006). As perceived security significantly contributes to the development of customer satisfaction (Chang & Chen, Citation2009), web stores offering security features will have reliable and satisfied consumers (Vasic et al. Citation2018). Information quality was found to be a weak determinant of online service satisfaction. However, this finding confirms that information quality is also an antecedent of online user satisfaction (DeLone & McLean, Citation2003), which implies that online shoppers perceive information quality to be an important dimension in the development of online satisfaction. While the impact of privacy concerns on customer satisfaction is confirmed in earlier research studies (Ahmad et al., Citation2017; Al-dweeri et al., Citation2019), privacy concerns did not have a significant influence on customer satisfaction in this study. This could be attributed to online customers’ expectation that e-retailers would abide by the privacy policies stipulated on their websites. Consumers perceive that online retailers are obliged not to share or distribute private information that customers have disclosed on the website. Notably, the results show that South Africans’ concerns about website security are a barrier to online shopping despite the privacy policy statements given on online shopping websites.
The results conclude that customer satisfaction significantly and directly affects customer loyalty. This corroborates the empirical evidence in the e-commerce literature showing that customer satisfaction would positively affect customer loyalty (Ahmad et al., Citation2017; Brusch et al., Citation2019; Hult et al., Citation2019)—a result also echoed in the marketing literature (Chandrashekaran et al., Citation2007; Oliver, Citation1999). This generally implies that those e-retailers that offer a more satisfactory e-commerce shopping experience develop customers who are loyal to their websites. Since the consumer experience of service from a website is mainly concerned with item delivery time (Chou et al., Citation2015), the results show that the relationships between product delivery and satisfaction and between satisfaction and loyalty are moderated by e-commerce experience. This implies that presenting quality information on an online shopping website and ensuring timely delivery determine the satisfaction of customers whose e-commerce experience exceeds five to ten years.
17. Managerial implications
The findings of the current research offer insights for e-retailers to consider in relation to product delivery, perceived security, product variety, and information quality as the key considerations for online shopping customer satisfaction and loyalty. Prior research has not measured, but has recommended, the inclusion of product delivery and product variety in future studies as important factors affecting customer satisfaction. The study offers managerial implications to e-retailers by identifying the online shopping attributes that could improve online shopping satisfaction and customer loyalty. This paper extends the existing knowledge of the online shopping behaviour of consumers in the e-commerce context, thus revealing and sharing insights that are relevant to individuals and businesses with a common interest in the theoretical implications, including the managerial strategies that would be suitable for growing B2C e-commerce in emerging economies such as South Africa. The study found product delivery, followed by perceived security, product variety, and information quality of online shopping websites, to be positive and significant determinants of online shoppers’ satisfaction, which in turn influences customer loyalty. It is important for managers of websites to present quality information because of its positive and significant impact on cultivating customer loyalty to their website. This confirms the results in the literature (Al-Tit, Citation2020; Wang et al. Citation2009) that confirm that information quality directly and significantly affects consumer loyalty. Thus the delivery of products and the improved satisfaction of customers would develop loyalty among customers with e-commerce experience of between five and ten years, especially those who confidently purchase from Takealot.com. Consequently, because missing contact information, inaccurate order deliveries, and incomplete after-sales service are barriers between sellers and buyers (Yen & Lu, Citation2008), food e-retailers need constantly to focus attention on the use-by date for the home delivery of goods (Faraoni et al., Citation2018), whereas jewellery retailers should focus on the attributes that drive consumers’ online shopping, such as product variety, value for money, packaging, tangible attribute verification, safe transactions, and delivery (Haridasan & Fernando, Citation2018).
Reflecting on the results of this study, e-commerce operators who devote more attention to cooperating with the delivery supplier to provide a higher-quality delivery, such as the correct order, on time, and improved product variety, would enhance shoppers’ satisfaction with and loyalty to their websites. The results suggest that e-vendors need to guarantee the security of online shopping transactions (i.e., with data authentication certificates, cryptography, encryption, socket layers, trust marks, etc.). Online store managers who cannot ofer all the necessary information will forfeit the opportunity to achieve customer satisfaction. Managers without agreements with delivery services if products are broken during the delivery, or if no party is responsible for damage, will destroy customer satisfaction. There is a growing agreement that, in e-retailing as in traditional retailing, satisfaction is not just a key performance outcome or driver of consumers’ continuous behaviour: it is also a major predictor of customer loyalty, and leads to an e-retailer’s endurance and success. Thus website managers need to keep their promises of timely delivery and secure online transactions, offer a wide variety of products, and present quality information to meet or exceed online shoppers’ expectations. This is consistent with prior research studies (Anderson & Srinivasan, Citation2003; D. J. Kim et al., Citation2009; M. Kim et al., Citation2011; Ribbink et al., Citation2004), in that the results of this study show that an increase in customer satisfaction positively affects customer loyalty. The unique contribution of this study rests on the moderating effect of e-commerce experience on the impact of product delivery on customer satisfaction and on customer satisfaction and loyalty. In addition, managers need to know the confidence levels that customers hold when purchasing from websites in South Africa. This is important when aiming to develop satisfaction and to sustain enduring loyalty.
The study offers practical implications for e-marketers and online retailers. The main finding of this study confirms the influence of delivery on customer satisfaction, which in turn, influences the loyalty of online shoppers to a website. The paper supports e-retailers by giving them insights into the dynamics of the influence of various antecedents on customer satisfaction with website-related services. It is apparent that customer satisfaction can be increased by fast delivery times, including a range of delivery options that convince customers about a company’s speed. As expected, an online store must make precise deliveries at the correct times. Delivery had the highest impact on customer satisfaction in this study, suggesting that managers should ensure the delivery of the product in a good condition and within the stipulated time. Collaborating with partners from several delivery courier services and enabling customers to select their preferred service might be an excellent idea. It is crucial routinely to monitor and react to the pricing and promotional strategies of competitors without reducing the variety of products and/or brands, and to maintain web-store design and service-delivery efficiency. Various delivery options, messages about the delivery’s status, and updates on delivery times would enhance customer satisfaction. In addition to guaranteeing the timeliness of delivery, protecting transaction security, offering a wide product selection range, and presenting quality information on the website would contribute to successful online shopping in South Africa. A website that satisfies consumers’ information needs by presenting high quality information, such as accurate updates on products and services information, helps its consumers to make a choice. It would also be beneficial to link this information to consumer safety tips for online purchases.
Online shopping managers need to understand how consumers evaluate their experience of online shopping. This should be underpinned by a clear direction and implementation of various online shopping attributes that are specifically tailored to meet the needs and expectations of the targeted markets. As found in the present study, delivery, followed by perceived security, product variety, and information quality, have a significant and positive impact on online shoppers’ satisfaction, while information quality and satisfaction are determinants of loyal behavioural outcomes. E-retailers should maintain a consistent focus on timely delivery, ensure the implementation and the regular tracking and upgrading of security tools (such as cryptography, encryption, socket layers, and digital signatures) to protect online transactions, and expand the variety of goods and services of the highest quality. It is always beneficial to present accurate and relevant information on e-retail sites. These interventions would increase the satisfaction of South African online shoppers. Specifically, customers expect the delivery of the correct products at the correct time. Customers might tolerate slower financial transactions if such transactions accompanied strong security; but they expect the accurate and prompt delivery of products. The effective implementation of these values would improve customer satisfaction, which—together with the quality information offered on the website—would build strong customer loyalty to the website. The direct impact of delivery on satisfaction, and that of satisfaction on loyalty, is strengthened by e-commerce experience of more than five years. In general, satisfaction is a major contributor to online customer loyalty in South Africa.
18. Limitations and future research
Given the nature of a cross-sectional study, the current study has a few inherent limitations that need to be revisited in future studies. The data was collected from online customers with a particular focus on measuring perceptions relating to their preferred web stores in South Africa. To enlarge the scope of the research and to cross-validate the results, it would be ideal to adopt a multi-cultural research perspective. Future research could target other geographic areas, measure consumers’ attitudes and emotions involved in online shopping, and include other important factors that determine the demand for online shopping. It would be interesting to measure consumers’ engagement and perceived value in online purchasing and to understand their perceived risks, purchasing culture, and views about privacy legislation on the safety of private data, including service support before and after an online purchase. Owing to the rapid growth of e-commerce globally, competition in online shopping has intensified; thus future studies could account for the evolving trends of this medium of transaction, and conduct longitudinal studies to measure the important role of human–computer interactions to understand how to build satisfaction, trust, and loyalty in online shopping.
Important future scientific directions could include examining causes and effects and a multi-group analysis technique in SPSS PROCESS regression to assess the influence of other moderators in the model, such as gender and spending, and to test their influence on the dependent variable. Thus the current study has not examined the model for mediation effects. Since switching to competitors is only a click away, it would be beneficial to include measures that assess online shoppers’ attitudinal and behavioral loyalty against switching costs. The measurement scales used in this study could be validated and assessed to verify their reliability and to improve the generalisability of the results.
Additional information
Funding
Notes on contributors

Thabang Excellent Mofokeng
Thabang Excellent Mofokeng completed Baccalaureus Technologiae Degree in Marketing Management, and Master’s Degree in Marketing Management, both from Vaal University of Technology, and his PhD in Marketing Management from North West University, South Africa. He completed Post-graduate Diploma in Higher Education from University of Johannesburg, South Africa. He had been working in academia for the last 10 years. Moreover, he has been teaching at Undergraduate and Graduate programs at University of Johannesburg for the last 3 years. He had also been working as a BCom Marketing Programme coordinator, and a lecturer at the Department of Marketing, School of Consumer Intelligence and Information Systems, College of Business and Economics, University of Johannesburg, South Africa. His research interest includes services marketing, e-commerce marketing, retail marketing, and consumer behaviour. He is an emerging researcher aiming to publish research articles in both national and international journals. He is now a lecturer in Marketing Management.
References
- Ahmad, A., Rahman, O., & Khan, M. N. (2017). Exploring the role of website quality and hedonism in the formation of e-satisfaction and e-loyalty: Evidence from internet users in India. Journal of Research in Interactive Marketing, 11(3), 246–33. https://doi.org/https://doi.org/10.1108/JRIM-04-2017-0022
- Alavi, S. A., Rezaei, S., Valaei, N., & Ismail, W. K. W. (2016). Examining shopping mall consumer decision-making styles, satisfaction and purchase intention. The International Review of Retail, Distribution and Consumer Research, 26(3), 272–303. https://doi.org/https://doi.org/10.1080/09593969.2015.1096808
- Al-dweeri, R. M., Moreno, A. R., Montes, F. J. R., Obeidat, Z. M., & Al-dwairi, K. M. (2019). The effect of e-service quality on Jordanian students’ e-loyalty: An empirical study in online retailing. Industrial Management & Data Systems, 119(4), 902–923. https://doi.org/https://doi.org/10.1108/IMDS-12-2017-0598
- Al-Tit, A. (2020). E-commerce drivers and barriers and their impact on e-customer loyalty in small and medium-sized enterprises (SMEs). Verslas: Teorija Ir praktika/Business: Theory and Practice, 21(1), 146–157. https://doi.org/https://doi.org/10.3846/btp.2020.11612
- Anderson, J. C., & Gerbing, D. W. (1988). Structural equation modeling in practice: A review and recommended two-step approach. Psychological Bulletin, 103(3), 411–423. https://doi.org/https://doi.org/10.1037/0033-2909
- Anderson, R. E., & Srinivasan, S. S. (2003). E-satisfaction and e-loyalty: A contingency framework. Psychology & Marketing, 20(2), 123–138. https://doi.org/https://doi.org/10.1002/mar.10063
- Anderson, R. E., & Srinivasan, S. S. (2011). Customer satisfaction and loyalty in e‑markets: A PLS path modeling approach. Journal of Marketing Theory and Practice, 19(2), 221–234. https://doi.org/https://doi.org/10.2753/MTP1069-6679190207
- Arora, N., & Aggarwal, A. (2018). The role of perceived benefits in formation of online shopping attitude among women shoppers in India. South Asian Journal of Business Studies, 7(1), 91–110. https://doi.org/https://doi.org/10.1108/SAJBS-04-2017-0048
- Bagozzi, R. P., & Yi, Y. (1988). On the evaluation of structural equation models. Journal of the Academy of Marketing Science, 16(1), 74–94. https://doi.org/https://doi.org/10.1007/BF02723327
- Barari, M., Ross, M., & Surachartkumtonkun, J. (2020). Negative and positive customer shopping experience in an online context. Journal of Retailing and Consumer Services, 53, 101985. https://doi.org/https://doi.org/10.1016/j.jretconser.2019.101985
- Bartlett, M. S. (1954). A note on the multiplying factors for various chi square approximations. Journal of the Royal Statistical Society, 16(Series B), 296–298. https://www.jstor.org/stable/2984057
- Belanger, F., Hiller, J. S., & Smith, W. J. (2002). Trustworthiness in electronic commerce: The role of privacy, security, and site attributes. Journal of Strategic Information Systems, 11(3–4), 245–270. PII: S0963-8687(02)00018-5. https://doi.org/https://doi.org/10.1016/S0963-8687(02)00018-5
- Bilgihan, A. (2016). Gen Y customer loyalty in online shopping: An integrated model of trust, user experience and branding. Computers in Human Behavior, 61, 103–113. https://doi.org/http://dx.doi.org/10.1016/j.chb.2016.03.014
- Broniarczyk, S. M., Hoyer, W. D., & McAlister, L. (1998). Consumers’ perceptions of the assortment offered in a grocery category: The impact of item reduction. Journal of Marketing Research, XXXV, 166–176. https://doi.org/https://doi.org/10.2307/3151845
- Brusch, I., Schwarz, B., & Schmitt, R. (2019). David versus Goliath – Service quality factors for niche providers in online retailing. Journal of Retailing and Consumer Services, 50, 266–276. https://doi.org/https://doi.org/10.1016/j.jretconser.2019.05.008
- Castaneda, J. A. (2011). Relationship between customer satisfaction and loyalty on the Internet. Journal of Business Psychology, 26(3), 371–383. https://doi.org/https://doi.org/10.1007/s10869-010-9196-z
- Chandrashekaran, M., Rotte, K., Tax, S., & Grewal, R. (2007). Satisfaction strength and customer loyalty. Journal of Marketing Research, XLIV (1), 153–163. ISSN: 0022-2437. https://doi.org/https://doi.org/10.1509/jmkr.44.1.153
- Chang, C. (2011). The effect of the number of product subcategories on perceived variety and shopping experience in an online store. Journal of Interactive Marketing, 25(3), 159–168. https://doi.org/https://doi.org/10.1016/j.intmar.2011.04.001
- Chang, H. H., & Chen, S. W. (2009). Consumer perception of interface quality, security, and loyalty in electronic commerce. Information & Management, 46(7), 411–417. https://doi.org/https://doi.org/10.1016/j.im.2009.08.002
- Chaudhuri, A., & Holbrook, M. B. (2001). The chain of effects from brand trust and brand affect to brand performance: The role of brand loyalty. Journal of Marketing, 65(2), 81–93. https://doi.org/https://doi.org/10.1509/jmkg.65.2.81.18255
- Chen, J. V., Rungruengsamrit, D., Rajkumar, T. M., & Yen, D. C. (2013). Success of electronic commerce web sites: A comparative study in two countries. Information & Management, 50(6), 344–355. https://doi.org/http://dx.doi.org/10.1016/j.im.2013.02.007
- Chen, Z., Ling, K. C., Ying, C. X., & Meng, T. C. (2012). Antecedents of online customer satisfaction in China. International Business Management, 6 (2), 168–175. ISSN: 1993-5250. https://doi.org/https://doi.org/10.3923/ibm.2012.168.175
- Chintagunta, P. K., Chu, J., & Cebollada, J. (2012). Quantifying transaction costs in online/off-line grocery channel choice. Marketing Science, 31(1), 96–114. https://doi.org/http://dx.doi.org/10.1287/mksc.1110.0678
- Chiu, W., & Cho, H. (2019). E-commerce brand: The effect of perceived brand leadership on consumers’ satisfaction and repurchase intention on e-commerce websites. Asia Pacific Journal of Marketing and Logistics, 33(6), 1339-1362. https://doi.org/https://doi.org/10.1108/APJML-10-2018-0403
- Chou, S., Chen, C., & Lin, J. (2015). Female online shoppers: Examining the mediating roles of e-satisfaction and e-trust on e-loyalty development. Internet Research, 25(4), 542–561. https://doi.org/https://doi.org/10.1108/IntR-01-2014-0006
- Creecy, B. (2016). Socio-economic review and outlook 2016. Gauteng Provincial Government. Provincial Treasury, Republic of South Africa. Gauteng Provincial Government, Marshalltown. PR12/2016. p. 1–66.
- Cronbach, L. J. (1951). Coefficient alpha and the internal structure of tests. Psychometrika, 16(3), 297–335. https://doi.org/https://doi.org/10.1007/BF02310555
- Cyr, D. (2008). Modeling website design across cultures: Relationships to trust, satisfaction, and e-loyalty. Journal of Management Information Systems, 24(4), 47–72. https://doi.org/https://doi.org/10.2753/MIS0742-1222240402
- Darley, W. K., Blankson, C., & Luethge, D. J. (2010). Toward an integrated framework for online consumer behavior and decision making process: A review. Psychology & Marketing, 27(2), 94–116. https://doi.org/https://doi.org/10.1002/mar.20322
- DeLone, W. H., & McLean, E. R. (2003). The DeLone and McLean model of information systems success: A ten-year update. Journal of Management Information Systems, 19 (4), 9–30. ISSN: 0742–1222 DOI:https://doi.org/10.1080/07421222.2003.11045748
- Dennis, A., & Piatti, D. (2015). African powers of retailing: New horizons for growth. Deloitte & Touche. Creative Services at Deloitte.
- eMarketer. (2018). Retail e-commerce sales worldwide from 2014 to 2021. Retrieved June 6, 2019, from https://www.statista.com/statistics/379046/worldwide-retail-e-commerce-sales/:StatistaB2C-E-Commerce
- Faraoni, M., Rialti, R., Zollo, L., & Pellicelli, A. C. (2018). Exploring e-loyalty antecedents in B2C e-commerce: Empirical results from Italian grocery retailers. British Food Journal, 121(2), 574-589. https://doi.org/https://doi.org/10.1108/BFJ-04-2018-0216
- Fornell, C. (1992). A national customer satisfaction barometer: The Swedish experience. Journal of Marketing, 56(1), 6–21. https://doi.org/https://doi.org/10.1177/002224299205600103
- Fornell, C. G., & Larcker, D. F. (1981). Evaluating structural equation models with unobservable variables and measurement error. Journal of Marketing Research, 18(1), 39–50. https://doi.org/https://doi.org/10.1177/002224378101800104
- Fortes, N., & Rita, P. (2016). Privacy concerns and online purchasing behaviour: Towards an integrated model. European Research on Management and Business Economics, 22(3), 167–176. https://doi.org/http://dx.doi.org/10.1016/j.iedeen.2016.04.002
- Garbarino, E., & Johnson, M. S. (1999). The different roles of satisfaction, trust, and commitment in customer relationships. Journal of Marketing, 63(2), 70–87. https://doi.org/https://doi.org/10.1177/002224299906300205
- Garcia, J. M., Freire, O. B. D., Santos, E. B. A., & Andrade, J. (2020). Factors affecting satisfaction and loyalty to online group buying. Revista de Gestao, 27(3), 211–228. https://doi.org/https://doi.org/10.1108/REGE-02-2018-0037
- Gillwald, A., Mothobi, O., & Rademan, B. (2018). The state of ICT in South Africa. Policy Paper no. 5, Series 5: After Access State of ICT in South Africa. Retrieved December 3, 2019, from https://researchictafrica.net/after-access-south-africa-state-of-ict-2017-south-africa-report_04/
- Gogus, A., & Saygın, Y. (2019). Privacy perception and information technology utilization of high school students. Heliyon, 5(5), e01614. https://doi.org/https://doi.org/10.1016/j.heliyon.2019.e01614
- Gupta, V., Gupta, L., & Dhir, S. (2020). Customer competency for improving firm decision-making performance in e-commerce. Foresight, 22(2), 205–222. https://doi.org/https://doi.org/10.1108/FS-06-2019-0053
- Guterres, A. (2019). Digital economy report 2019. Value creation and capture implications for developing countries. United Nations Organization. ISBN 978-92-1-112955-7
- Hair, J. F., Risher, J. F., Sarstedt, M., & Ringle, C. M. (2019). When to use and how to report the results of PLS-SEM. European Business Review, 311, 2–24. https://doi.org/https://doi.org/10.1108/EBR-11-2018-0203
- Hair, J. F., Jr, Sarstedt, M., Hopkins, L., & Kuppelwieser, V. G. (2014). Partial least squares structural equation modeling (PLS-SEM): An emerging tool in business research. European Business Review, 26(2), 106–121. https://doi.org/https://doi.org/10.1108/EBR-10-2013-0128
- Hair, J. F., Sarstedt, M., Ringle, C. M., & Mena, J. A. (2012). An assessment of the use of partial least squares structural equation modeling in marketing research. Journal of the Academy of Marketing Science, 40(3), 414–433. https://doi.org/https://doi.org/10.1007/s11747-011-0261-6
- Haridasan, A. C., & Fernando, A. G. (2018). Online or in-store: Unravelling consumer’s channel choice motives. Journal of Research in Interactive Marketing, 12(2), 215–230. https://doi.org/https://doi.org/10.1108/JRIM-07-2017-0060
- Hayes, A. F. (2013). Introduction to mediation, moderation, and conditional process analysis: A regression-based approach. ISBN 978-1-60918-230-4. http://www.afhayes.com/
- Hult, G. T. M., Sharma, P. N., Morgeson, F. V., III, & Zhang, Y. (2019). Antecedents and consequences of customer satisfaction: Do they differ across online and offline purchases? Journal of Retailing, 95(1), 10–23. https://doi.org/https://doi.org/10.1016/j.jretai.2018.10.003
- Hwang, Y., & Kim, D. J. (2007). Customer self-service systems: The effects of perceived web quality with service contents on enjoyment, anxiety, and e-trust. Decision Support Systems, 43(3), 746–760. https://doi.org/https://doi.org/10.1016/j.dss.2006.12.008
- Israel, G. D. (1992). Determining sample size. Fact Sheet PEOD-6. November, 1992. http://www.gjimt.ac.in
- Jöreskog, K. G., Sorbon, D., du Toit, S., & du Toit, M. (1999). LISREL 8: New statistical features. Scientific Software International.
- Kahn, B. E., & Wansink, B. (2004). The influence of assortment structure on perceived variety and consumption quantities. Journal of Consumer Research, 30 (4), 519–533. ISSN: 0093-5301. https://doi.org/https://doi.org/10.1086/380286
- Kaiser, H. F. (1970). A second generation Little Jiffy. Psychometrika, 35(4), 401–415. https://doi.org/https://doi.org/10.1007/BF02291817
- Kaiser, H. F. (1974). An index of factorial simplicity. Psychometrika, 39(1), 31–36. https://doi.org/https://doi.org/10.1007/BF02291575
- Kassim, N. M., & Abdullah, N. A. (2008). Customer loyalty in e-commerce settings: An empirical study. Electronic Markets, 18(3), 275–290. https://doi.org/https://doi.org/10.1080/10196780802265843
- Khan, M. A., Zubair, S. S., & Malik, M. (2019). An assessment of e-service quality, e-satisfaction and e-loyalty: Case of online shopping in Pakistan. South Asian Journal of Business Studies, 8(3), 283–302. https://doi.org/https://doi.org/10.1108/SAJBS-01-2019-0016
- Kim, C., Zhao, W., & Yang, K. H. (2008). An empirical study on the integrated framework of e-CRM in online shopping: Evaluating the relationships among perceived value, satisfaction, and trust based on customers’ perspectives. Journal of Electronic Commerce in Organizations, 6(3), 1–19. https://doi.org/https://doi.org/10.4018/jeco.2008070101
- Kim, D. J., Ferrin, D. L., & Rao, H. R. (2009). Trust and satisfaction, two stepping stones for successful e-commerce relationships: A longitudinal exploration. Information Systems Research, 20(2), 237–257. https://doi.org/https://doi.org/10.1287/isre.1080.0188
- Kim, M., Chung, N., & Lee, C. (2011). The effect of perceived trust on electronic commerce: Shopping online for tourism products and services in South Korea. Tourism Management, 32(2), 256–265. https://doi.org/https://doi.org/10.1016/j.tourman.2010.01.011
- Kotler, P. P. (2000). Marketing management International Edition. Prentice-Hall.
- Ladeira, W. J., Nique, W. M., Pinto, D. C., & Borges, A. (2016). Running for pleasure or performance? How store attributes and hedonic product value influence consumer satisfaction. The International Review of Retail, Distribution and Consumer Research, 26(5), 1–19. https://doi.org/https://doi.org/10.1080/09593969.2016.1182934
- Lancaster, K. (1990). The economics of product variety: A survey. Marketing Science, 9 (3), 189–206. ISSN: 0732-2399. https://doi.org/https://doi.org/10.1287/mksc.9.3.189
- Li, H., Aham-Anyanwu, N., Tevrizci, C., & Luo, X. (2015). The interplay between value and service quality experience: E-loyalty development process through the ETailQ scale and value perception. Electronic Commerce Research, 15(4), 585–615. https://doi.org/https://doi.org/10.1007/s10660-015-9202-7
- Lin, C., Wu, H., & Chang, Y. (2011). The critical factors impact on online customer satisfaction. Procedia Computer Science, 3, 276–281. https://doi.org/https://doi.org/10.1016/j.procs.2010.12.047
- Liu, H., He, M., Gao, F., & Xie, P. (2008). An empirical study of online shopping customer satisfaction in China: A holistic perspective. International Journal of Retail & Distribution Management, 36(11), 919–940. https://doi.org/https://doi.org/10.1108/09590550810911683
- Luo, J., Ba, S., & Zhang, H. (2012). The effectiveness of online shopping characteristics and well-designed websites on satisfaction. MIS Quarterly, 36(4), 1131–1144. https://doi.org/https://doi.org/10.2307/41703501
- Maditinos, D. I., & Theodoridis, K. (2010). Satisfaction determinants in the Greek online shopping context. Information Technology & People, 23(4), 312–329. https://doi.org/https://doi.org/10.1108/09593841011087789
- Malhotra, N. K. (2007). Marketing research: An applied orientation (5th ed.). Pearson Prentice Hall.
- Malhotra, N. K., Kim, S. S., & Agarwal, J. (2004). Internet users’ information privacy concerns (IUIPC): The construct, the scale, and a causal model. Information Systems Research, 15(4), 336–355. https://doi.org/https://doi.org/10.1287/isre.1040.0032
- Massad, N., Heckman, R., & Crowston, K. (2006). Customer satisfaction with electronic service encounters. International Journal of Electronic Commerce, 10(4), 73–104. https://doi.org/https://doi.org/10.2753/JEC1086-4415100403
- Menidjel, C., Bilgihan, A., & Benhabib, A. (2020). Exploring the impact of personality traits on perceived relationship investment, relationship quality, and loyalty in the retail industry. The International Review of Retail, Distribution and Consumer Research, 31(1), 1–24. https://doi.org/https://doi.org/10.1080/09593969.2020.1781228
- Mortimer, G., e Hasan, S. F., Andrews, L., & Martin, J. (2016). Online grocery shopping: The impact of shopping frequency on perceived risk. The International Review of Retail, Distribution and Consumer Research, 26(2), 202–223. https://doi.org/https://doi.org/10.1080/09593969.2015.1130737
- Mushongera, D., Zikhali, P., & Ngwenya, P. (2017). A multidimensional poverty index for Gauteng Province, South Africa: Evidence from quality of life survey data. Social Indicators Research, 130(1), 277–303. https://doi.org/https://doi.org/10.1007/s11205-015-1176-2
- Oliver, R. L. (1999). Whence consumer loyalty? Journal of Marketing, 63, 33–44. https://doi.org/https://doi.org/10.1177/00222429990634s105
- Page-Thomas, K., Moss, G., Chelly, D., & Yabin, S. (2006). The provision of delivery information online: A missed opportunity. International Journal of Retail & Distribution Management, 34(4/5), 258–277. https://doi.org/https://doi.org/10.1108/09590550610660224
- Pallant, J. (2010). SPSS survival manual. A step by step guide to data analysis using SPSS (4th ed.). McGraw-Hill/Open University Press. ISBN-13: 978-0-33-524239-9.
- Pandey, N., Tripathi, A., Jain, D., & Roy, S. (2019). Does price tolerance depend upon the type of product in e-retailing? Role of customer satisfaction, trust, loyalty, and perceived value. Journal of Strategic Marketing, 28(6), 1–20. https://doi.org/https://doi.org/10.1080/0965254X.2019.1569109
- Pandey, S., & Chawla, D. (2018). Online customer experience (OCE) in clothing e-retail. Exploring OCE dimensions and their impact on satisfaction and loyalty – Does gender matter? International Journal of Retail & Distribution Management, 46(3), 323–346. https://doi.org/https://doi.org/10.1108/IJRDM-01-2017-0005
- Pappas, I. O., Pateli, A. G., Giannakos, M. N. and Chrissikopoulos, V. (2012), Moderating effects of online shopping experience on customer satisfaction and repurchase intentions. International Journal of Retail & Distribution Management, 42(3), 187–204. doi:https://doi.org/10.1108/IJRDM-03-2012-0034
- Pappas, I. O., Pateli, A. G., Giannakos, M. N., & Chrissikopoulos, V. (2014). Moderating effects of online shopping experience on customer satisfaction and repurchase intentions. International Journal of Retail & Distribution Management, 42(3), 187–204. https://doi.org/https://doi.org/10.1108/IJRDM-03-2012-0034
- Park, C., & Kim, Y. (2003). Identifying key factors affecting consumer purchase behavior in an online shopping context. International Journal of Retail & Distribution Management, 31(1), 16–29. https://doi.org/https://doi.org/10.1108/09590550310457818
- Park, H. H., Jeon, J. O., & Sullivan, P. (2015). How does visual merchandising in fashion retail stores affect consumers’ brand attitude and purchase intention? The International Review of Retail, Distribution and Consumer Research, 25(1), 87–104. https://doi.org/https://doi.org/10.1080/09593969.2014.918048
- Prashar, S., Vijay, T. S., & Parsad, C. (2017). Effects of online shopping values and website cues on purchase behaviour: A study using S–O–R framework. The Journal for Decision Makers, 42(1), 1–18. https://doi.org/https://doi.org/10.1177/0256090916686681
- Prinsloo, D. A. (2018). Online shopping: Steady increase but still far behind. South African Council of Shopping Centres.
- Raman, P. (2019). Understanding female consumers’ intention to shop online: The role of trust, convenience and customer service. Asia Pacific Journal of Marketing and Logistics, 31(4), 1138–1160. https://doi.org/https://doi.org/10.1108/APJML-10-2018-0396
- Ribadu, M. B., & Rahman, W. N. (2019). An integrated approach towards Sharia compliance e-commerce trust. Applied Computing and Informatics, 15(1), 1–6. https://doi.org/http://dx.doi.org/10.1016/j.aci.2017.09.002
- Ribbink, D., Van Riel, A. C. R., Liljander, V., & Streukens, S. (2004). Comfort your online customer: Quality, trust and loyalty on the Internet. Managing Service Quality, 14(6), 446–456. https://doi.org/https://doi.org/10.1108/09604520410569784
- Rita, P., Oliveira, T., & Farisa, A. (2019). the impact of e-service quality and customer satisfaction on customer behavior in online shopping. Heliyon, 5(10), e02690. https://doi.org/https://doi.org/10.1016/j.heliyon.2019.e02690
- Roca, J. C., García, J. J., & De La Vega, J. J. (2009). The importance of perceived trust, security and privacy in online trading systems. Information Management & Computer Security, 17(2), 96–113. https://doi.org/https://doi.org/10.1108/09685220910963983
- Rudansky-Kloppers, S. (2014). Investigating factors influencing customer online buying satisfaction in Gauteng, South Africa. International Business & Economics Research Journal, 13(5), 1187–1198. https://doi.org/https://doi.org/10.19030/iber.v13i5.8784
- Sabiote, C. M., Frías, D. M., & Castañeda, J. A. (2012). E-service quality as antecedent to e-satisfaction: The moderating effect of culture. Online Information Review, 36(2), 157–174. https://doi.org/https://doi.org/10.1108/14684521211229011
- Salo, J., & Karjaluoto, H. (2007). A conceptual model of trust in the online environment. Online Information Review, 31(5), 604–621. https://doi.org/https://doi.org/10.1108/14684520710832324
- Schaefer, S., & Bulbulia, A. (2021). Digital commerce acceleration: Increased online purchases present new opportunities for digital commerce players South African online consumer shopping insights, February 2021. Deloitte Touche Tohmatsu Limited.
- Schreiber, J. B., Stage, F. K., King, J., Nora, A., & Barlow, E. (2006). Reporting structural equation modeling and confirmatory factor analysis results: A review. The Journal of Educational Research, 99(6), 323–337. https://doi.org/https://doi.org/10.3200/JOER.99.6.323-338
- Sharma, H., & Aggarwal, A. G. (2019). Finding determinants of e-commerce success: A PLS-SEM approach. Journal of Advances in Management Research, 16(4), 453–471. https://doi.org/https://doi.org/10.1108/JAMR-08-2018-0074
- Shih, H. (2004). An empirical study on predicting user acceptance of e-shopping on the web. Information & Management, 41(3), 351–368. https://doi.org/https://doi.org/10.1016/S0378-7206(03)00079-X
- Slack, N. J., & Singh, G. (2019). The effect of service quality on customer satisfaction and loyalty and the mediating role of customer satisfaction: Supermarkets in Fiji. The TQM Journal, 32(3), 543–558. https://doi.org/https://doi.org/10.1108/TQM-07-2019-0187
- Statista. (2018). E-commerce worldwide – Statistics & facts. Retrieved January 11, 2019, from www.statista.com/topics/871/online-shopping/
- Statistics, South Africa. (2018). Mid-year population estimates, 2018. Statistical release. P0302. Embargoed until: 23 July 2018, 11:00. Pretoria, 0001, South Africa.Release date: 31 July 2019
- Szymanski, D. M., & Hise, R. T. (2000). E-satisfaction: An initial examination. Journal of Retailing, 76(3), 309–322. https://doi.org/https://doi.org/10.1016/S0022-4359(00)00035-X
- Tabachnick, B. G., & Fidell, L. S. (2007). Using multivariate statistics (5th ed.). Pearson Education.
- Torkzadeh, G., & Dhillon, G. (2002). Measuring factors that influence the success of Internet commerce. Information Systems Research, 13(2), 187–204. https://doi.org/https://doi.org/10.1287/isre.13.2.187.87
- Tzeng, S., Ertz, M., Jo, M. J., & Sarigollu, E. (2020). Factors affecting customer satisfaction on online shopping holiday. Marketing Intelligence & Planning, 39(4). https://doi.org/https://doi.org/10.1108/MIP-08-2020-0346
- Vakulenko, Y., Shams, P., Hellström, D., & Hjort, K. (2019). Online retail experience and customer satisfaction: The mediating role of last mile delivery. The International Review of Retail, Distribution and Consumer Research, 29(3), 306–320. https://doi.org/https://doi.org/10.1080/09593969.2019.1598466
- Vasic, N., Kilibarda, M., and Kaurin, T. (2018). The Influence of Online Shopping Determinants on Customer Satisfaction in the Serbian Market. Journal of Theoretical and Applied Electronic Commerce Research, 14(2), 70–89. doi:https://doi.org/10.4067/S0718-18762019000200107
- Vasic, N., Kilibarda, M., & Kaurin, T. (2019). The influence of online shopping determinants on customer satisfaction in the Serbian market. Journal of Theoretical and Applied Electronic Commerce Research, 14(2), 70–89. https://doi.org/https://doi.org/10.4067/S0718-18762019000200107
- Wang, M. C., Wang, E. S., Cheng, J. M., & Chen, A. F. (2009). Information quality, online community and trust: a study of antecedents to shoppers’ website loyalty. International Journal of Electronic Marketing and Retailing, 29(3), 203–219. doi:https://doi.org/10.1504/IJEMR.2009.021806
- Xiao, Z., Wang, J. J., & Liu, Q. (2018). The impacts of final delivery solutions on e-shopping usage behaviour. The case of Shenzhen, China. International Journal of Retail & Distribution Management, 46(1), 2–20. https://doi.org/https://doi.org/10.1108/IJRDM-03-2016-0036
- Yamane, T. (1967). Statistics: An introductory analysis (2nd ed.). Harper and Row.
- Yang, Z., Cai, S., Zhou, Z., & Zhou, N. (2005). Development and validation of an instrument to measure user perceived service quality of information presenting web portals. Information & Management, 42(4), 575–589. https://doi.org/https://doi.org/10.1016/j.im.2004.03.001
- Yen, C., & Lu, H. (2008). Effects of e-service quality on loyalty intention: An empirical study in online auction. Managing Service Quality, 18(2), 127–146. https://doi.org/https://doi.org/10.1108/09604520810859193