
Abstract
This research examined how multi-sensory dimensions like sight, sound, and smell would influence customer attitudes toward quick-service restaurants, restaurant patronage intentions, food purchasing decisions, food consumption satisfaction, restaurant attachment, repurchase intention, and positive word of mouth in South African quick-service restaurants. The research embraced a quantitative approach. An online questionnaire was used to collect data from restaurant customers in the Bloemfontein metropolitan. The hypotheses were analysed by applying structural equation modelling. The results uncovered that the study variables were significantly associated and surprisingly, restaurant attachment had a negative and insignificant effect on positive word of mouth. This research adds new fresh knowledge to the established body of knowledge in the context of restaurant food consumption behaviour. This area has little research attention in developing African countries like South Africa.
Subjects:
PUBLIC INTEREST STATEMENT
With the emergence of globalisation, the restaurant industry in South Africa is one of the fastest-growing sectors. With the restaurant industry’s steady growth and a rise in consumer purchasing behaviour in this market, understanding the factors that lead to customers’ satisfaction when dining at such establishments is important. In addition, the current COVID-19 pandemic in South Africa, the restaurant industry’s distress necessitates solution-oriented studies. Via a customer-centric approach, this study addresses the existing awareness gap on the broader consumer behaviour literature, concentrating on multi-sensory aspects and behavioural intentions in the context of the South African restaurant industry.
1. Introduction
The restaurant industry in South Africa (SA) suffered a devastating blow due to the lockdown restrictions imposed through the Disaster Management Act of 57 of 2002 to contain the spread of COVID-19 (South African Government, Citation2021). Consequently, high-level lockdown restrictions resulted to a loss in sales and the closure of some big restaurant names in SA (Caboz, Citation2021). Restaurants that have already closed, including Pablo Eggs Go Bar, Myoga, Joburg bar and Kalk bay (Caboz, Citation2021). Businesstech (Citation2021) reports that the distress in the restaurant industry is further exacerbated by new regulations that include: (i) paying of employees a wage exceeding the national minimum wage and (ii) a wage increases of 1.5 per cent above inflation. The descendant in lockdown levels and loosening of regulations within the fourth quarter of 2020 and theants in lockdown levels and loosening of regulations within the fourth quarter of 2020 and the first quarter of 2021 provide hope to the surviving restaurants. However, such hope remains a mirage to most restaurant players unless they engage in customer-centric strategies that guarantee survival.
Consumer-centric strategists such as Kotler and Keller (Citation2016) argue that customers’ participation in the formulation of marketing strategies is by far one of the recommended approaches to survive a volatile environment such as that faced by SA restaurants during the COVID-19 pandemic. From this school of thought, the current study assessed the influence of consumer multi-sensory dimensions (i.e., sound, sight, and smell) on food purchase decisions within restaurant in SA from customers’ point of view. Such understanding assists management within the restaurant industry to formulate competitive marketing strategies driven by consumers’ opinions. It is imperative for restaurants to employ marketing strategies organisational vision, goals, marketing and financial objectives (Gujral et al., Citation2016). This study also addresses several gaps within the broader consumer behaviour literature, especially in customer multi-sensory dimensions and purchase decisions with the restaurant environment. Through this study, exciting debate and discourse arise in understanding the connection between multi-sensory dimensions, customer attitude and behavioural intentions (Popovic et al., Citation2019; De Villiers et al., Citation2018). As a corollary, several theoretical contributions also emerge through the investigation of the statistically significant connection between: (i) sound, sight, smell, customer attitudes, and restaurant patronage, (ii) customer attitudes, restaurant patronage and food purchase decisions, (iii) food purchase decisions and food consumption satisfaction, (iv) food consumption satisfaction, restaurant attachment, repurchase intention and positive word-of-mouth.
Given the preceding context, it is vital to highlight international studies concentrating on restaurant patronage behaviour. For example, Sthapit et al. (Citation2017) studied “the impact of food consumption emotions on tourist memories of a journey, place attachment, and behavioural intention” among visitors to Rovaniemi, Finland. Wei and Huang (Citation2017) investigated food traceability systems potential as elevators of best practice in corporate social responsibility for quick-service food restaurants in Japan. Ledikwe et al. (Citation2020) assessed the effect of word of mouth and electronic word of mouth in the fast food industry from a South African context. Wu et al. (Citation2019) conducted a study in Taiwan that looked at the connections between restaurant attachment, experiential relationship efficiency, and experiential relationship intentions. Akbari et al. (Citation2019) used a modified version of the theory of planned behaviour to investigate educated consumers’ intentions towards consuming genetically modified foods. In addition, Line, Hanks and Kim (Citation2017) researched at Florida State University in the United States of America and determined other customers’ effects on consumption behaviour in shared consumption spaces. Furthermore, Chivandi and Maziriri (Citation2017) examined food safety standards recognition and implementation in Zimbabwean branded fast-food outlets from the perspectives of consumers, staff, and management. Ardekani et al. (Citation2020) looked at consumers’ willingness to adopt genetically modified foods. Jia (Citation2020) contrasted restaurant tourists’ motivation and satisfaction from China and the United States by evaluating their online ratings and reviews. Furthermore, a study conducted at Sakarya University in Turkey looked into the effect of perceived food quality, price fairness, perceived value, and satisfaction on customers’ intentions to return and spread the word about organic food restaurants (Konuk, Citation2019). It’s also necessary to point out that these studies are preliminary. It is also worth noting that these studies have been performed in settings other than South Africa.
It is important to note that, even in South Africa, there is a lack of scholarly research that has explicitly studied restaurant consumption activity. Current studies have been examined at in several ways, for example, Mhlanga and Tichaawa (Citation2017) looked into the effect of social media on the customer experience in restaurants. Nel et al. (Citation2018) investigated customers’ perceptions and experiences of sit-down restaurants to help future and existing restaurateurs understand what is expected of them in order for their businesses to succeed. Research conducted at the University of the Free State looked into the relationship between satisfaction in relocating and delight in relocating restaurants and returning patronage in restaurants in a mall in Bloemfontein (Moolman, Citation2011). Coughlan and Saayman (Citation2018) researched the segmentation taxonomy based on international tourists’ culinary preferences to South Africa to assist South Africa in becoming a culinary travel destination. Furthermore, Mhlanga and Machingambi (Citation2016) investigated demographic variables on customer preferences in restaurants in South Africa’s Eastern Cape province.
Little is known about how selected multi-sensory dimensions such as sight, sound, and smell influence customer attitudes toward quick-service restaurants, restaurant patronage intention, food purchase decision, food consumption satisfaction, restaurant attachment, repurchase intention, and positive word of mouth in South African quick-service restaurants, as evidenced by the studies described above. Consequently, a study of this nature in a geographically distinct area, such as South Africa, could yield interesting results.
This article is structured as follows: first, a theoretical basis for the analysis is presented, then a theoretical model is presented, and then, the hypothesis is established. After that, the study design and methodology are discussed, followed by the findings and discussion. The implications, limitations, and future research directions are discussed in the article’s final sections.
2. THEORETICAL LENS
Various theories aim to predict and describe human behaviour. The principles of the Interpersonal attachment theory and position attachment are explored in this study. These theories are discussed in the subsequent sections.
2.1. Interpersonal attachment theory
This study will be anchored in the interpersonal attachment theory framework, which is deemed to provide an appropriate theoretical grounding for this study, to gain a clear understanding of the research’s context. In the 1930s, John Bowlby and Mary Ainsworth developed the interpersonal attachment theory. It was, however, extensively developed in the 1950s (Bretherton, Citation1992). Ethology, control systems theory, and psychoanalytic theory were used to develop the interpersonal attachment theory (Bretherton, Citation1992). As a result, this theory fundamentally altered how people thought about infant-mother bonds and how they were disrupted by separation, deprivation, and bereavement (Bowlby & Ainsworth, Citation2013).
According to Amin and Malin (Citation2012), a child experiences separation anxiety and depression as soon as a parent or significant other is no longer present. It would be on the consumer’s attachment to a restaurant and if the consumer expresses regret and sorrow when the object is no longer available in this case (Amin & Malin, Citation2012). On the other hand, Moussa and Touzani (Citation2013, p. 339) argue that many of attachment theory’s premises can be applied to the consumer-brand relationship. The basic underlying premise of attachment theory, according to Ismail and Ali (Citation2013, p. 55), is “Separation Distress,” which refers to the extent to which consumers show their emotions when exposed to real or imagined separation from an object of strong attachment. Thomson (Citation2006) suggests that attachment theory can contribute to marketing due to the attachment’s distinctive attributes. Therefore, restaurant managers of various fast service restaurants will benefit from a comprehensive understanding of what motivates customers to be satisfied and eventually become attached to a restaurant.
2.2. Place attachment theory
According to the place attachment theory, people form affectionate or emotive ties to a specific location, which can be seen as an extension of the interpersonal attachment theory. Most people have at least one place attached to them (Low & Altman, Citation1992). Since this theory is an extension of interpersonal attachment theory, it is important to compare and contrast the two theories and how they relate in the sense of position attachment theory versus interpersonal attachment theory. The place attachment theory, like the interpersonal attachment theory, implies that establishing bonds with a place can be beneficial to one’s physical and mental well-being (Scannell et al., Citation2016) both the interpersonal and place attachment theory involve the maintenance of a symbolic or physical closeness or proximity to the place or person of importance (The person or place with whom the bond is created with). Both theories imply that forming an attachment to an individual or a place offers a sense of safety and protection. The closer a person is to the object of their attachment, the better they feel. The final agreement between these two theories is that separation anxiety arises if an attachment figure is lost. Following the loss of a significant place or individual, a person will show signs of sadness, isolation, and even disorientation. Given the similarities in these two theories, it’s likely that places can fulfill psychological needs in the same way people do (Scannell et al., Citation2019). The place attachment theory was used in this study to look at the positive relation between food consumption satisfaction and restaurant attachment in order to understand better how customers develop an attachment to the restaurant and the dining elements can be improved to strengthen the consumer-restaurant place attachment possibilities.
3. Theoretical model and hypotheses formulation
depicts the theoretical model reflecting the distinct paths and connections between the constructs under investigation. The theoretical model illustrates ten constructs’ suggested interconnection: sound, sight, smell, consumer attitudes towards quick-service restaurants, food purchase decision, restaurant patronage intention, food consumption satisfaction, restaurant attachment, repurchase intention, and positive word of mouth. The following sections will review the literature on the study’s main variables. Moreover, the hypothesised connections between the study variables are discussed in the subsequent sections based on past studies and logically deriving from prior results.
Figure 1. Structural model
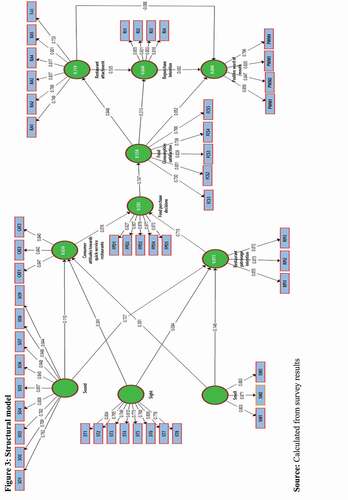
Figure 2. Theoretical model
3.1. Sound, sight, smell and consumer attitudes towards quick-service restaurants
It is imperative to illustrate how sound, sight, and smell can stimulate consumer attitudes towards quick-service restaurants. Close-related studies such as the one conducted by Mashao et al. (Citation2020) revealed that sound has a positive and significant impact on restaurant customers’ affective attitudes. Park et al. (Citation2008) found that visual stimulation (sight) significantly influences consumer attitudes. This is also in line with Dalle Ave et al. (Citation2015) who also found out that there is a positive relationship between sight and attitudes of coffee shop consumers. Moreover, in Yoon and Park (Citation2012) study of the effect of sensory appeal on attitude in coffee shops, it was discovered that there is a positive relationship between customers’ attitudes and the smell or scent. In light of this, the following hypotheses were developed:
H1: There is a positive relationship between restaurant sound and consumer attitudes towards quick-service restaurants
H2: There is a positive relationship between restaurant sight and consumer attitudes towards quick-service restaurants
H3: There is a positive relationship between restaurant smell and consumer attitudes towards quick-service restaurants
3.2. Sound, sight, smell and restaurant patronage intention
It is important to understand the connection between sound, sight, and smell and restaurant patronage intention. According to Hultén (Citation2011), sound, sight, and smell all play important roles in the customer experience while visiting a shop. Depending on the product or service that a store sells, each sense’s value can vary (Hultén, Citation2011; Hultén et al., Citation2009). Depending on the product being marketed and the relevant target market, the value of sound in terms of music and the work can differ. On the other hand, retailers will significantly benefit in terms of revenue and income from considering the sound sensory dimension (De Villiers et al., Citation2018). When it comes to sight, according to Anvar (Citation2016), if the visual sight is made appealing by using colour to communicate marketing messages, a positive response can be generated to satisfy the customer and inspire them to make a buying decision (Miller & Kahn, Citation2005).
Furthermore, De Villiers et al. (Citation2018) used a bakery as an example, stating that a bakery may concentrate on the scent of bread, which is an important tangible way to entice customers into the store (De Villiers et al., Citation2018). A clothing store might suggest using a fragrance or an earthy scent to attract customers to shop there or to stimulate store patronage behaviour. As a consequence, a restaurant will benefit from the allure of the scent of food. In this study, the following hypothesis were put to the test:
H4: There is a positive relationship between restaurant sound and restaurant patronage intention
H5: There is a positive relationship between restaurant sight and restaurant patronage intention
H6: There is a positive relationship between restaurant smell and restaurant patronage intention
3.3. Consumer attitudes towards quick-service restaurants and food purchase decisions
The relationship between consumer attitudes toward quick-service restaurants and food purchase decisions must be clarified. However, little research has been done so far to try and understand how consumers form attitudes and make decisions regarding genetically modified foods (Bredahl, Citation2001). Consumer attitudes were discovered by Popovic et al. (Citation2019) as factors affecting consumers’ decision to buy food in environmentally friendly packaging. According to Quah and Tan (Citation2009), attitudes are important determinants of organic food products purchasing decisions. Nonetheless, based on the claims mentioned above, which are backed by empirical proof, this study hypothesises that:
H7: There is a positive relationship between consumer attitudes towards quick-service restaurants and food purchase decision
3.4. Restaurant patronage intention and food purchase decision
It is crucial to figure out how restaurant patronage and food purchase decisions are linked. However, there is little research on the relationship between restaurant patronage intentions and food purchase decisions. As a result, the current investigation is required. Consumers face store patronage decisions daily, according to Thang and Tan (Citation2003). According to a related study, store patronage behavior has a positive and significant impact on purchase decisions (Maziriri et al., Citation2019). As a result, the current research proposes the following hypothesis:
H8: There is a positive relationship between restaurant patronage intention and food purchase decision
3.5. Food purchase decision and food consumption satisfaction
Consumers are satisfied or dissatisfied with product consumption and the decision-making process in terms of product availability, pre-purchase information, and product selection (Chang & Kukar‐Kinney, Citation2011, Chauke & Duh, Citation2019). According to Heitmann, Lehmann, and Herrmann (Citation2007), consumers are satisfied when they achieve choice goals such as high choice confidence and low expected regret. When it came to mall shopping in Malaysia, Alavi, Rezaei, Valaei, and Ismail (Citation2016) discovered that consumers were less satisfied when they bought for hedonic reasons (i.e., brand, fashion, and recreational consciousness).
On the other hand, they were more satisfied when they bought for utilitarian reasons, such as price and quality consciousness. Given that quick service, restaurant food is more likely to be purchased and consumed for utilitarian reasons, and one would expect consumers to be satisfied with their purchase and consumption decisions. Chauke and Duh (Citation2019) discovered that the decision to buy food has a positive impact on consumption satisfaction. Consequently,
H9: There is a positive relationship between food purchase decision and food consumption satisfaction
3.6. Food consumption satisfaction and restaurant attachment
In today’s highly competitive restaurant industry, appealing to customers’ psychological needs is an essential strategy for survival. Customer attachment is aligned to generate positive emotions in customers during and after consumption, stimulating their emotions and leaving a positive impression. Customer satisfaction has been identified as a factor in explaining brand loyalty (Han et al., Citation2018). When customers are satisfied with their consumption experience, they become associated with the brand and develop an emotional commitment (Ranaweera & Menon, Citation2013). Customers can get the most benefits, so the commitment is kept (e.g., low perceived risk, reduced information search cost). According to Lee et al. (Citation2020), satisfaction with a new restaurant positively impacts new restaurant attachment. Based on these findings, restaurant attachment is thought to be a result of food consumption satisfaction, which has significant implications for restaurant businesses. In other words, customers who are pleased with the food they have purchased in a restaurant have a strong emotional bond with the restaurant. As a result, it is possible to state that:
H10: There is a positive relationship between food consumption satisfaction and restaurant attachment
3.7. Food consumption satisfaction and positive word of mouth
The relationship between food consumption satisfaction and positive word of mouth must be clarified. Consumers will be satisfied and spread positive word-of-mouth messages if food consumption meets their expectations (Chang et al., Citation2014). Furthermore, consumers are more likely to recommend food products to others if they provide quality, value, and all expected benefits, or even better, if they exceed expectations (Lam et al., Citation2016). Lai (Citation2020) investigated the impact of satisfaction on word of mouth about Portuguese foods in Macau and discovered that satisfaction impacts word of mouth. Customer satisfaction has a positive impact on word-of-mouth intent (Konuk, Citation2019). According to W. G. Kim et al. (Citation2009), improving customer satisfaction in university foodservice establishments leads to positive word-of-mouth endorsement, strengthening customer loyalty while also enhancing the dining facility’s reputation and generating more revenue. Food satisfaction has a positive impact on tourist word-of-mouth, according to Khuong and Van Nga (Citation2018). As a result, it is proposed in this study that:
H11: There is a positive relationship between food consumption satisfaction and positive word of mouth
3.8. Food consumption satisfaction and repurchase intention
Customers frequently decide whether or not to purchase/repurchase a product/service after assessing whether their previous experiences with it were satisfactory/pleasurable (Ali et al., Citation2016; Jeon & Hyun, Citation2013; Prebensen et al., Citation2014). Han et al. (Citation2019) asserted and confirmed the link between customer satisfaction and repurchase intent. Variables related to food consumption satisfaction or dining satisfaction impact post-dining behavioral intentions in the foodservice industry (Kivela et al., Citation1999; Namkung & Jang, Citation2007; Ryu et al., Citation2012). Han and Hyun (Citation2017) discovered that the satisfaction of luxury hotel restaurant customers positively impacts the in-room dining experience. Furthermore, customer satisfaction with a restaurant’s food quality has been found to be a strong predictor of customer intent to return in some studies (Oh, Citation2000; Pettijohn et al., Citation1997; Qu, Citation1997). According to H. J. Kim et al. (Citation2013), Diner satisfaction has a significant positive relationship with revisit intentions. On the basis of these previous studies, the following hypothesis is proposed:
H12: There is a positive relationship between food consumption satisfaction and repurchase intention
3.9. Restaurant attachment and repurchase intention
In marketing studies, attachment has been used to describe the concept of loyalty. Attachment theory came into existence due to Bowlby’s (Citation1980) research into the emotional bonds that bind people. Its central principle is that a person who is emotionally attached to another person or object is more likely to pursue proximity and interaction with that person or object (Bowlby, Citation1980, pp. 38–39). Past studies have shown that extending this central principle to the field of product or brand marketing helps humanise a brand/product, potentially enabling it to play a more important role in a consumer’s lifeworld (Aaker, Citation1997; Swaminathan et al., Citation2009; Wallendorf & Arnould, Citation1988). As a result, attachments have been studied in a variety of business valleys to predict repurchase intention (Alexandris et al., Citation2006; Pedeliento et al., Citation2016). As a result, this study hypothesises that restaurant attachment can influence repurchase intention. Therefore, it can be hypothesised that:
H13: There is a positive relationship between restaurant attachment and repurchase intention
3.10. Repurchase intention and positive word of mouth
Customers who demonstrate loyalty to a business or brand convey their positive feelings about that brand/company (repurchase intentions) and other customers (word-of-mouth), according to Shah et al. (Citation2019). In the banking sector, Khan et al. (Citation2015) discovered a positive relationship between repurchase intentions and word of mouth (Khan et al., Citation2015). In the telecom sector, Roy (Citation2013) found a positive direct impact of repurchase intentions on word of mouth. Shah et al. (Citation2019) that repurchase intentions positively affect word of mouth in the fast-food sector in their research, which looked at how customer perceived ethicality affected repurchase intentions word-of-mouth. As a consequence of these consistent findings, it can be hypothesised that:
H14: There is a positive relationship between repurchase intention and positive word of mouth
3.11. Restaurant attachment and positive word of mouth
It is essential to understand the connection between restaurant attachment and positive word-of-mouth. Place attachment is proposed as a determinant of online word-of-mouth activity, according to Chen et al. (Citation2018). This is consistent with Dolbec and Chebat (Citation2013) findings, which show that attachment has consequences for marketing-relevant consumption behavior including repeat purchases and willingness to recommend a brand. Their findings are also in line with Mashao et al. (Citation2020), who hypothesised a correlation between restaurant attachment and positive word of mouth. As a result, it is possible to hypothesise that:
H15: There is a positive relationship between restaurant attachment and positive word of mouth
4. Methodological aspects
The research philosophy for this study was positivism. As a result, a quantitative research approach was used. The design was suitable for collecting information on sound, sight, and smell, and also customer attitudes toward quick-service restaurants, food purchasing decisions, restaurant patronage intentions, food consumption satisfaction, restaurant attachment, repurchase intention, and positive word of mouth. Furthermore, the technique enables one to examine the relationships between the study constructs.
4.1. Sample and data collection
This study’s target population was customers who purchase food from quick-service restaurants within the Bloemfontein metropolitan area of South Africa. There was no sampling frame for this study due to the absence of a populated physical list of active quick-service restaurant consumers in Bloemfontein. Therefore, considering that the target population was large, unknown, and not easy to determine individuals who quickly service restaurant, non-probability sampling was adopted in convenience sampling. It was not easy to determine individuals who quick service restaurant, non-probability sampling was adopted in the form of convenience sampling. A convenient sampling technique was used in this study to select relevant respondents from the target population and ensure that data could be collected quickly and relatively inexpensively to select relevant respondents from the target population and ensure that data could be collected quickly and relatively inexpensively. Kumar (Citation2019) state that sample size is the number of sample elements that account for inclusion in a study. In this study, statistical calculations of sample size were made owing to the absence of a finite population size, determinable from a sampling frame. Instead, scholarly rule of thumbs and historical evidence were considered. Specifically, the rule of thumb by Green (Citation1991) was upheld, expressed as N ≥ 50 + 3 M, whereby M represents the number of predictor variables used in the study. This study’s minimum sample size was estimated at 50 + (8*3), implying a sample size of 74 participants or greater. Avikaran (1994) suggests that sample sizes greater than 300 are appropriate for consumer-based studies. This study therefore used an appropriate sample size, as it was 380, surpassing the 300 recommended by (Avikaran, 1994). Further support for the sample size adopted is based on (Malhotra, Citation2007; Zikmund & Babin, Citation2010). The use of sample sizes from prior similar research is an acceptable approach to estimating a sample size for a current study (Malhotra, Citation2007; Zikmund & Babin, Citation2010). This research therefore adopted this approach of referring to past similar research sample sizes in estimation of an adequate sample size. This was done by using a similar sample size to that of Wei and Huang (Citation2017) who surveyed 360 patrons of quick-service restaurants in Japan.
At the secondary level, support for large sample size in this study was guided by the recommendation put forward by several scholars for conducting multivariate statistical procedures such as SEM. For example, Gupta et al. (Citation2016) recommended that structural equation models with more than five constructs, with several constructs being measured with about three observed variables and multiple indicators with low communality (below 0.50), then the sample size should be at least 400. Also, other methodology scholars (Bagozzi & Yi, Citation2012) aver that large sample sizes are required if SEM is to be applied in a study. Thus, in view of the guidelines mentioned above, a final sample size of 400 restaurant customers was deemed a prudent size for fulfilling this study’s empirical objectives. A computer-administered survey method was used to collect primary data from the respondents. The online questionnaire was uploaded onto the SurveyMonkey platform, and a link to the questionnaire was generated and captured. This link was then distributed to prospective Bloemfontein respondents via direct mail and social media platforms (Such as WhatsApp and Facebook). The researchers decided to close the survey link once 400 responses have been gathered. Of the 400 questionnaires distributed, 20 questionnaires returned were usable, resulting in a response rate of 95%.
4.2. Measurement instrument and questionnaire design
Previous studies were used to operationalise the variables under investigation. To reflect the study’s context, the scales were modified. lists the measurement scales, items used, sources, and Cronbach’s alpha values for the scales. The scale indicators were affixed to a Likert-scale spectrum ranging from strongly disagree (1) to strongly agree (5).
Table 1. Measurement scales and their sources
5. Respondent profile
The participant representation is shown in . The participants were asked to provide demographic details such as their age, gender, year of study, monthly allowance, and frequency of eating at quick-service restaurants. 33- to 37-year-olds were the most represented, and they account for almost 51% of the sample. As for gender representation, 56% were male while and 42% of the participants were female. As for the amount of money usually spent on restaurant food every month, the largest group was those who spend between R1501-R2000 every month. When it comes to dining at quick-service restaurants, the group with the largest representation accounted for 52% of the sample.
Table 2. Sample demographic characteristics
6. Statistical analysis procedure
The investigators used the Statistical Package for Social Science (SPSS) version 25 to evaluate the respondents’ geographical profile. On the other hand, the latest software version of SMART-PLS 3.2.7 was used to sanalyse the data captured, since PLS SEM was preferred to covariance-based SEM because of its improved statistical power in parameter estimates and the smaximisation of understood variance (Tajvidi et al., Citation2020); less compatible than competitive relatives are PLS SEM and CB SEM (Sarstedt et al., Citation2014; Rigdon, Citation2014). Nevertheless, PLS SEM is initially known for its higher prediction over CBSEM (Hair et al., Citation2017), although the approximate gaps between the two techniques are quite different. PLS-SEM is analogous to multiple regression analysis and is considered suitable for simultaneous estimation of relationships between one or more independent and dependent variables. This feature makes PLS-SEM especially valuable for research purposes in exploration (Henseler, Citation2017).
PLS-SEM incorporates path coefficients, multi-linear regression, and CFA (confirmatory factor analysis), a multivariate research technique of the second generation. This describes the variability in the dependent variable by using structural template analysis (Hair et al., Citation2017). Partial Least Squares Structural Equation Modeling (PLS-SEM) works for complex models involving moderation, small samples and less prone to ordinary multivariate data (Vlajčić et al., Citation2019). This research study adopted a reflective measurement model in which measurements represent latent variables, and the direction of the connection is from the construct or latent variable to the measure (Diamantopoulos & Winklhofer, Citation2001). The statistical analysis performed in this study includes measures such as (1) Measurement model—testing of reliability analysis and validity analysis and (2) Structural model analysis—examining the path coefficients between observed coefficients.
7. Reliability analysis
specifies the different measures used to assess the reliability and validity of the study’s constructs.
Table 3. Measurement accuracy assessment
7.1. Measurement model assessment
The outer model was assessed first by values of composite reliability (CR) (to evaluate internal consistency), outer loadings (to assess indicator reliability), and average variance extracted (to assess convergent validity). Composite reliability is an appropriate measure of internal consistency reliability because it accounts for the indicator variables’ different outer loadings. In contrast, Cronbach’s alpha assumes all indicators to be equally reliable (Hair et al., Citation2016). For the other research constructs, the lowest value for each respective item load was 0.730. All individual item loadings, therefore, exceeded the recommended value of 0.5 (Anderson & Gerbing, Citation1988). This shows that all measuring instruments are satisfactory and reliable. All items met the convergent validity thresholds and with more than 50% of the variance of each item shared with their respective constructs (Fraering & Minor, Citation2006). As shown in , the Cronbach’s alpha test results ranged between 0.797 and 0.962, above the 0.70 benchmarks for acceptable internal consistency reliability (Field, Citation2013).
As revealed in , the lowest CR value of 0.880 is well above the suggested value of 0.6 (Hulland, Citation1999), while the lowest obtained average variance extracted (AVE) value of 0.616 is also above the recommended value of 0.4 (Anderson & Gerbing, Citation1988). This shows the accomplishment of convergent validity, and this further confirms the excellent internal consistency and reliability of the measuring instruments used. As such, a sufficient level of discriminating validity was revealed by all the variables. These results have generally provided evidence of acceptable reliability levels of the research scale (Chinomona & Chinomona, Citation2013). According to Field (Citation2013), discriminant validity refers to items measuring different concepts. presents the results of the discriminant validity analysis. In terms of discriminant validity, all the correlation coefficients of this study fell below 0.70, thereby confirming each variable’s theoretical uniqueness in this research (Field, Citation2013). Also, discriminant validity was evaluated using the Hetero-Trait-Monotrait Ratio (HTMT) criterion (), despite recommendations from previous studies (Henseler et al., Citation2016; Verkijika & De Wet, Citation2018), indicating that HTMT is more suitable to evaluate discriminant validity than Fornell–Larcker’s commonly used criteria. When taking a more conservative position, discriminant validity is reached when the HTMT value is below 0.9 or 0.85 (Neneh, Citation2019; Verkijika & De Wet, Citation2018). reveals that the highest obtained HTMT value is 0.721, below the conservative value of 0.85. As such, all the constructs meet the criteria for discriminant validity.
Table 4. Discriminant validity (hetero-trait-monotrait-ratio)
7.2. Structural model assessment
Inner model (structural model) () was assessed to test the relationship between the endogenous and exogenous variables. The path coefficients were obtained by applying a non-parametric, boot-strapping routine (Vinzi et al., Citation2010), with 261 cases and 5000 samples for the non-return model (two-tailed; 0.05 significance level; no sign changes). The model’s fitness was assessed using the goodness of fit (GoF) and the standardised root mean square residual (SRMR). These indices will be elucidated in the subsequent sections.
7.2.1. Assessment of the goodness of fit (GoF)
Overall, R2 for consumer attitudes, restaurant patronage intention, food purchase decision, food consumption satisfaction, restaurant attachment, repurchase intention and positive word of mouth in indicate that the research model explains 65.6%, 81.5%, 59.3%, 55.8%, 71.9%, 66.8% and 88.6% respectively, of the variance in the endogenous variables. The following formulae are given by Tenenhaus et al. (Citation2005). The global GoF statistic for the research model was calculated using the equation:
Goodness of Fit = 2√ (average of all AVEs values* average of all R2)
= 2√ 0.701*0.400
= 0.53
AVE represents the average ofAVE represents all AVE values for the research variables while R2 represents all R2 values in the full path model. The calculated global GoF is 0.53, which exceeds the threshold of GoF > 0.36 suggested by Wetzels et al. (Citation2009). Therefore, it can be concluded that the research model has an excellent overall fit.
7.2.2. Multicollinearity assessment of the outer model
For PLS-SEM, common method bias (CMB) is detected through a full collinearity assessment approach (Kock, Citation2015). VIF values should be lower than the 3.3 thresholds (J.F. Hair et al., Citation2011; Kock, Citation2015). This is indicative that the model is free from common method bias. Any value greater than 3.3 means the model is affected by CMB. Therefore, upon following standard procedures in business research, the variance inflation factor (VIF) values were computed instead of reporting the collinearity issues in this work. The SMART PLS 3 output reports the following: VIF (outer) values for sound (1.334 to 1.983), sight (1.676 to 1.989), Smell (1.524 to 1.745), Consumer attitudes (1.926 to 1.956), Food purchase decisions (1.987 to 2.724), Restaurant patronage intention (1.692 to 2.827), Food Consumption satisfaction (1.690 to 1.923), Restaurant attachment (1.524 to 1.982), Repurchase intention (1.926 to1.987) and Positive word of mouth (1.945 to 2.061).
7.2.3. The standardised root mean square residual (SRMR)
The SRMR is an index of the average of sstandardised residuals between the observed and the shypothesised covariance matrices Chen (Citation2007). The SRMR is a measure of estimated model fit. When SRMR = <0.08, the study model has a good fit (Hu & Bentler, Citation1998); with a lower SRMR being a better fit. shows the theoretical model’s SRMR was 0.07, which revealed that the model had a good fit, whereas the Chi-Square was equal to 1919.097 and NFI equal to 0.901 was also measured meeting the recommended threshold for NFI (Afthanorhan, Citation2013).
Table 5. Model fit summary
8. Path model
The PLS estimation path coefficients values as well as the item loadings for the research construct are shown in .
9. Outcome of hypotheses testing and discussion of results
In this study, the hypotheses’ testing was conducted by path coefficient values and the t-values for the structural model obtained from the bootstrapping algorithm. According to Beneke and Blampied (Citation2012), t-values indicate whether a significant relationship exists between variables in the model and path coefficients, demonstrating the strength of the model’s relationships. and show the standardised path coefficients and their corresponding t-values. A statistically significant association is expected to have a t-value that exceeds 1.96 at a 5% level of significance (Chin Citation1998).
Table 6. Outcomes of structural equation model analysis
9.1. Outcome and discussion of hypothesis 1: sound and consumer attitudes towards quick-service restaurants
The primary hypothesis expresses a positive relationship between restaurant sound and consumer attitudes towards quick-service restaurants; this assumption was reinforced in this examination. It can be seen in and that sound had a positive impact (β = 0.110) and was statistically significant (t = 2.284) in predicting consumer attitudes towards quick-service restaurants. This outcome proposes that good sound (music of the restaurant) stimulates consumer attitudes towards quick-service restaurants. Along these lines, this examination fails to dismiss H1. This finding has ample support from previous empirical research studies, such as that conducted by Chang et al. (Citation2014) and Chen et al. (Citation2018), who discovered soft and gentle music within Taiwan restaurants result in positive consumer attitudes.
9.2. Outcome and discussion of hypothesis 2: sight and consumer attitudes towards quick-service restaurants
The second hypothesis expresses a positive relationship between restaurant sight and consumer attitudes towards quick-service restaurants; this assumption was reinforced in this examination. It can be seen in and that sight had a positive impact (β = 0.391) and was statistically significant (t = 7.379) in predicting consumer attitudes towards quick-service restaurants. This outcome proposes that the restaurant’s good sight (visual appearance) stimulates consumer attitudes towards quick-service restaurants. Along these lines, this examination fails to dismiss H2. The results obtained in the current study are also not without empirical support. In their study, entitled, “Ceding to their appetites: A taxonomy of international tourists to South Africa.”, Coughlan and Saayman (Citation2018) found that visuals play a significant role in influencing the attitude of consumers.
9.3. Outcome and discussion of hypothesis 3: smell and consumer attitudes towards quick-service restaurants
The third hypothesis states that is a positive relationship between smell and consumer attitudes towards quick-service restaurants. In this study, this supposition is upheld. It can be seen in and that smell exerts a positive influence (β = 0.381) and was measurably significant (t = 6.824) in predicting consumer attitudes towards quick-service restaurants. This outcome endorses that the higher the level of smell (the restaurant scent/ smell of the food), the higher the consumer attitudes towards quick-service restaurants. Subsequently, this investigation supports H3. The findings obtained from this study are in line with the literature; Anvar (Citation2016) and Ali et al. (Citation2016) elucidated that smell is a critical sensory dimension that contributes to consumers’ attitudes.
9.4. Outcome and discussion of hypothesis 4: sound and restaurant patronage intention
The fourth hypothesis states there is a positive relationship between restaurant sound and restaurant patronage intention. In this examination, this hypothesis is upheld. and indicate that sound exerts a positive impact (β = 0.727) and is significant (t = 22.212) in influencing restaurant patronage intention. This outcome acclaims that the higher the level of sound, the higher the restaurant patronage intention among restaurant students. Thus, this examination supports H4. The result obtained from testing this hypothesis is also in agreement with a survey conducted by Anvar (Citation2016), who examined multi-sensory attributes and found that good restaurant sound results in positive restaurant patronage intentions.
9.5. Outcome and discussion of hypothesis 5: sight and restaurant patronage intention
The fifth hypothesis states that there is a positive relationship between restaurant sound and restaurant patronage intention. This study supports this hypothesis. It can be observed in and that sight exerts a positive influence (β = 0.086) and is statistically significant (t = 2.304) in predicting restaurant patronage intention. This outcome proposes that good sight (visual appearance of the restaurant) stimulates restaurant patronage intention. Along these lines, this examination fails to dismiss H5. This finding has ample support from previous empirical research studies, such as conducted by Anvar (Citation2016) and Wu et al. (Citation2019). They discovered that a statistically significant positive relationship exists between restaurant sound and the restaurant’s patronage intention.
9.6. Outcome and discussion of hypothesis 6: smell and restaurant patronage intention
The sixth hypothesis states that there is a positive relationship between restaurant smell and restaurant patronage intention. In this study, this supposition is upheld. It can be seen in and that smell exerts a positive influence (β = 0.146) and was measurably significant (t = 3.526) in predicting restaurant patronage intention. This outcome endorses that the higher the level of smell (the restaurant scent/ smell of the food), the higher the level of restaurant patronage intention. Subsequently, this investigation supports H6. This finding is also supported by Chen et al. (Citation2018) whose study found that the smell of the restaurant has a statistically significant effect on the restaurant’s patronage intention.
9.7. Outcome and discussion of hypothesis 7: consumer attitudes towards quick-service restaurants and food purchase decision
and indicate that H6 is supported by the hypothesis finding (β = 0.076) and is insignificant at t-statistics 1.618. The strength of the association is characterised by a path coefficient of 0.076. This implies that consumer attitudes towards quick-service restaurants are positively related to food purchase decisions in an insignificant way. Since a positive association was found between consumer attitudes towards quick-service restaurants and food purchase decision. It can be stated that these results are in line with the literature, for instance, according to Quah and Tan (Citation2009), attitudes are found to be important determinants of organic food products purchase decisions. It is also imperative to elucidate that the relationship was insignificant. Therefore, the obtained results are not in line with, Coughlan and Saayman (Citation2018) works, who found that consumer attitudes result in food purchase decisions.
9.8. Outcome and discussion of hypothesis 8: restaurant patronage intention and food purchase decision
and depict that H8 is supported significantly. The t-statistics is 15.425. The strength of the relationship is indicated by the path coefficient of 0.715. This finding suggests that restaurant patronage intention has a direct strong positive effect on food purchase decisions. So, the more restaurant owners and managers generate restaurants patronage, the more they can enhance food purchase decisions among customers. These results corroborate findings of a study conducted by Maziriri et al. (Citation2019) that provided evidence that store patronage behaviour is strongly associated with purchase decisions.
9.9. Outcome and discussion of hypothesis 9: food purchase decision and food consumption satisfaction
and depict that H9 is supported significantly. The t-statistics is 24.861. The strength of the relationship is indicated by the path coefficient of 0.747. This finding suggests that food purchase decision has a direct strong positive effect on food consumption satisfaction. So, this means that when the customer gets to decide to purchase the food this will ultimately result in making the customer satisfied with the food that has been bought. This finding is in line with Chauke and Duh (Citation2019) who found out that food purchase decision positively influences consumption satisfaction.
9.10. Outcome and discussion of hypothesis 10: food consumption satisfaction and restaurant attachment
and depict that H10 is supported significantly. The t-statistics is 40.196. The strength of the relationship is indicated by the path coefficient of 0.848. This finding suggests that food consumption satisfaction has a direct strong positive effect on restaurant attachment. So, this means that when the customer gets satisfied with the food this will ultimately result in restaurant attachment. These findings mirror the work of Sthapit et al. (Citation2017) and J. Kim et al. (Citation2017), who found a positive association between food consumption satisfaction and restaurant attachment.
9.11. Outcome and discussion of hypothesis 11: food consumption satisfaction and positive word of mouth
and depict that H11 is supported significantly. The t-statistics is 21.966. The strength of the relationship is indicated by the path coefficient of 0.952. This finding suggests that food consumption satisfaction has a direct strong positive effect on positive word of mouth. This means that when the customer gets satisfied with the food, will make the customer spread the good news about the restaurant. These results were like those reported by Özmen and Ögel (Citation2020), Ningsih et al. (Citation2021), and Tandon et al. (Citation2020) who explored associations between satisfaction and positive word of mouth. Their findings confirmed a significant association between satisfaction and positive word of mouth.
9.12. Outcome and discussion of hypothesis 12: food consumption satisfaction and repurchase intention
and depict that H12 is supported significantly. The t-statistics is 4.687. The strength of the relationship is indicated by the path coefficient of 0.313. This finding suggests that food consumption satisfaction has a direct strong positive effect on repurchase intention. This means that when the customer gets satisfied with the food, the customer will repurchase again from the restaurant. This finding was in line with Hellier et al. (Citation2003) and Yi and La (Citation2004) who confirmed a positive relationship between satisfaction and repurchase intention.
9.13. Outcome and discussion of hypothesis 13: restaurant attachment and repurchase intention
and depict that H13 is supported significantly. The t-statistics is 8.461. The strength of the relationship is indicated by the path coefficient of 0.535. This finding suggests that restaurant attachment has a direct strong positive effect on repurchase intention. This means that the customer will repurchase from the restaurant. These results are in line with the works of Pedeliento et al. (Citation2016), who found that attachment is a predictor of repurchase intention.
9.14. Outcome and discussion of hypothesis 14: repurchase intention and positive word of mouth
and depict that H14 is supported significantly. The t-statistics is 2.188. The strength of the relationship is indicated by the path coefficient of 0.082. This finding suggests that repurchase intention has a direct strong positive effect on positive word of mouth. This means that the customer will spread the good news about the restaurant. These findings mirror the work of Roy (Citation2013), who found a positive direct effect of repurchase intentions on word of mouth in the telecom sector.
9.15. Outcome and discussion of hypothesis 15: restaurant attachment and positive word of mouth
and depict that H15 is not supported. Since the t-statistics is 1.736. The weakness of the relationship is indicated by the path coefficient of −0.088. This finding suggests that restaurant attachment has a negative effect on positive word of mouth. This means that when a customer gets attached to a restaurant, it does not mean that the customer will spread the restaurant’s good news. These results refute with Dolbec and Chebat (Citation2013) works who found that attachment influences a customer’s willingness to recommend a brand. Moreover, these results also contradict with the findings obtained by Chen et al. (Citation2018). The authors found that place attachment is proposed as a determinant of online word-of-mouth behaviour (Chen et al., Citation2018).
10. Academic, business and policy implications
The present research article offers implications for academicians. The findings describe, most notably, the relationship between food consumption satisfaction and positive word of mouth. These results are presented by a path coefficient of (β = 0.952), a T-Statistic of 21.966 and a P value of 0.000. This discovery enhances the comprehension of retail marketing in terms of the food consumption. The implications for quick-service restaurant businesses and policy makers cannot be ignored. First, the study established that food purchase decisions and food consumption satisfaction have a very strong relationship. In fact, based on findings of the present research, this was found to be the strongest relationship upon hypotheses testing. The implication for quick-service restaurant businesses is that they should ensure that they prioritize ensuring that consumers are satisfied as much as possible as this is directly linked to their willingness to purchase. This outcome is a result of consumers closely associating food purchase decisions with food consumption satisfaction. The implication for policy makers is that they should make sure that they support both patrons and quick-service restaurant business by imposing fair prices. Fair prices would allow patrons to purchase food at these restaurants in a manner that remains profitable for managers and owners of quick-service restaurants.
Second, the research established that the relationship between sound and consumer attitudes towards quick-service restaurants was noticeably weak. This suggests that sound has little or no effect on consumer attitudes in quick-service restaurants. The implication for managers or business owners of quick-service restaurants is that they no focus much on sounds, such as music within their facilities, as this appears to not influence consumer attitudes. It would therefore mean that quick-service restaurants can still attract customers without any music in their facilities. An additional implication on this issue is that businesses should probably focus most of their attention if not all of it on the food served rather than the music played in the quick-service restaurant. Policy makers could provide support for quick-service restaurants that allow them to produce the best food possible. For example, policy makers could make it more affordable for quick-service restaurants to secure funding from government to buy the best produce and employ more staff. This has ripple effect of continuous job creation.
Third, food consumption satisfaction and positive word of mouth has a strong relationship suggesting that managers and owners of quick-service restaurants need to take their patrons’ word of mouth seriously as they are impacted by food consumption satisfaction. If managers and policy makers emphasize satisfaction at quick-service restaurants they will be able to manage the conversation around service delivery and product quality of their offering. The implication is that businesses should have strong public relations functions that control what interested parties (customers, suppliers, media, government, investors and any other key players in the industry) know. As for policy makers, they should ensure that laws and regulations that affect quick-service restaurants are conducive for both the businesses and the customers. This means that policy makers should protect the rights of both customers and quick-service restaurant businesses. For example, policy makers should make spreading false word of mouth (fake news) about quick-service restaurants punishable and the same time protecting consumer rights from being infringed-upon by businesses.
This paper provides a foundation through which the management of restaurants can formulate competitive marketing strategies. Strategies that can be driven from this paper include consumer segmentation, targeting and positioning based on consumer multi-sensory dimensions. Thus, this paper’s contribution in the development of segmentation, targeting and positioning strategies can lead to competitiveness of players within the restaurant industry.
11. Limitations of the study and future research directions
The present research provided a case for sound, sight, and smell as sensory dimensions that influence restaurant consumers’ food purchase decisions. However, like any other study research was not immune to limitations. First, the limitations were potentially conceptual, and this is due to not proposing and analysing certain hypothetical relationships. For example, direct connection between the predictors (sound, sight and smell) and the outcomes (restaurant attachment, repurchase intention and positive word of mouth). Second was applying theory, which future researchers on the topic could improve by proposing different theories that better explain factors influencing influence food purchase decisions of restaurant consumers. The same conceptual model as the one used for this study could be used in different contexts. For example, on consumers that prefer to purchase food from retail stores rather than restaurants. Last, the analysis was quantitative, thereby potentially restricting the extent to which participants responded. Further research on the topic could benefit from qualitative interviews with key players in the food consumption industry such as employees and restaurant owners and the consumers themselves.
Additional information
Funding
Notes on contributors

Eugine Tafadzwa Maziriri
Dr Eugine Tafadzwa Maziriri is currently an NRF rated researcher working as a Senior Lecturer in the Department of Business Management at the University of the Free State in Bloemfontein, South Africa. .
Dr. Tarisai Fritz Rukuni is a Lecturer in the Department of Business Management at the University of the Free State in Bloemfontein, South Africa.
Dr Tinashe Chuchu is currently a Senior Lecturer in the Marketing Division of the School of Business Sciences at the University of the Witwatersrand, in Johannesburg, South Africa.
References
- Aaker, J. L. (1997). Dimensions of brand personality. Journal of Marketing Research, 34(3), 347–27. https://doi.org/https://doi.org/10.1177/002224379703400304
- Afthanorhan, W. M. A. B. W. (2013). A comparison of partial least square structural equation modeling (PLS-SEM) and covariance based structural equation modeling (CB-SEM) for confirmatory factor analysis. International Journal of Engineering Science and Innovative Technology, 2(5), 198–205. http://www.ijesit.com/Volume%202/Issue%205/IJESIT201305_27.pdf
- Akbari, M., Ardekani, Z. F., Pino, G., & Maleksaeidi, H. (2019). An extended model of theory of planned behavior to investigate highly-educated Iranian consumers’ intentions towards consuming genetically modified foods. Journal of Cleaner Production, 227(1), 784–793. https://doi.org/https://doi.org/10.1016/j.jclepro.2019.04.246
- Alavi, S. A., Rezaei, S., Valaei, N., & Ismail, W. K. (2016). Examining shopping mall consumer decision-making styles, satisfaction and purchase intention. The International Review of Retail, Distribution and Consumer Research, 26(3), 272–303.
- Alexandris, K., Kouthouris, C., & Meligdis, A. (2006). Increasing customers’ loyalty in a skiing resort. International Journal of Contemporary Hospitality Management, 18(5), 414–425. https://doi.org/https://doi.org/10.1108/09596110610673547
- Ali, F., Ryu, K., & Hussain, K. (2016). Influence of experiences on memories, satisfaction and behavioral intention: A study of creative tourism. Journal of Travel & Tourism Marketing, 33(1), 85–100. https://doi.org/https://doi.org/10.1080/10548408.2015.1038418
- Amin, B., & Malin, D. (2012). Love of brand: A story of an on-going romance. Bachelor Thesis for the International Business and Economics Program Kristianstad University.
- Anderson, J. C., & Gerbing, D. W. (1988). Structural equation modeling in practice: A review and recommended two-step approach. Psychological Bulletin, 103(3), 411–423. https://doi.org/https://doi.org/10.1037/0033-2909.103.3.411
- Anvar, M. (2016). The effect of multi-sensory branding on purchase intention at coffee shops in South Africa. (Master’s dissertation). University of the Witwatersrand.
- Ardekani, Z. F., Akbari, M., Pino, G., Zúniga, M. A., & Azadi, H. (2020). Consumers’ willingness to adopt genetically modified foods. British Food Journal, 123(3), 1042–1059. https://doi.org/https://doi.org/10.1108/BFJ-04-2019-0260
- Bagozzi, R. P., & Yi, Y. (2012). Specification, evaluation, and interpretation of structural equation models. Journal of the Academy of Marketing Science, 40(1), 8–34. https://doi.org/https://doi.org/10.1007/s11747-011-0278-x
- Beneke, J., & Blampied, S. (2012). Driving consumer perceptions through facebook: an investigation into empowering brands in the 21st century. In Conference proceedings of the 24th annual conference of SAIMS–2012 (pp. 47–61). Stellenbosch: Stellenbosch University.
- Bowlby, J. (1980). Attachment and Loss, vol. 3 Basic Books. New York: Basic Books.
- Bowlby, J., & Ainsworth, M. (2013). The origins of attachment theory. Attachment Theory: Social, Developmental, and Clinical Perspectives, 45(28), 759–775. https://citeseerx.ist.psu.edu/viewdoc/download?doi=10.1.1.604.4524&rep=rep1&type=pdf
- Bredahl, L. (2001). Determinants of consumer attitudes and purchase intentions with regard to genetically modified food–results of a cross-national survey. Journal of Consumer Policy, 24(1), 23–61. https://doi.org/https://doi.org/10.1023/A:1010950406128
- Bretherton, I. (1992). The origins of attachment theory: John Bowlby and Mary Ainsworth. Developmental Psychology, 28(5), 759–775. https://doi.org/https://doi.org/10.1037/0012-1649.28.5.759
- Businesstech. 2021. Thousands of restaurants face closure in South Africa – Franchise body. [Online]. Available on: [Accessed on: 23/02/2021]. https://businesstech.co.za/news/business/464062/thousands-of-restaurants-face-closure-in-south-africa-franchise-body/
- Caboz, J. (2021). These popular SA restaurants did not survive COVID-19. [Online]. Available on: [Accessed on: 23/02/2021]. Eatout. https://www.eatout.co.za/article/developing-restaurants-and-the-coronavirus-latest-updates/
- Chang, C. C. A., & Kukar‐Kinney, M. (2011). The effects of shopping aid usage on consumer purchase decision and decision satisfaction. Asia Pacific Journal of Marketing and Logistics, 23(5), 745–754. https://doi.org/https://doi.org/10.1108/13555851111183110
- Chang, S., Chou, P., & Lo, W. (2014). Evaluation of satisfaction and repurchase intention in online food group-buying using Taiwan as an example. British Food Journal, 116(1), 44–61. https://doi.org/https://doi.org/10.1108/BFJ-03-2012-0058
- Chauke, D. X., & Duh, H. I. (2019). Marketing and socio-psychological factors influencing organic food purchase and post-purchase outcomes. Journal of Food Products Marketing, 25(9), 896–920.
- Chauke, X. D. (2018). Market and socio-psychological factors affecting organic food purchase decision and post-purchase outcomes in South Africa, (Doctoral dissertation). University of the Witwatersrand, Johannesburg, South Africa.
- Chen, F. F. (2007). Sensitivity of goodness of fit indexes to lack of measurement invariance. Structural Equation Modeling: A Multidisciplinary Journal, 14(3), 464–504. https://doi.org/https://doi.org/10.1080/10705510701301834
- Chen, N. C., Dwyer, L., & Firth, T. (2018). Residents’ place attachment and word-of-mouth behaviours: A tale of two cities. Journal of Hospitality and Tourism Management, 36(1), 1–11. https://doi.org/https://doi.org/10.1016/j.jhtm.2018.05.001
- Chin, W. W. (1998). The partial least squares approach to structural equation modeling. Modern methods for business research, 295(2), 295–336.
- Chinomona, R., & Chinomona, E. (2013). The influence of employees’ perceptions of sorganisational politics on turnover intentions in Zimbabwe’s SME sector. South African Journal of Business Management, 44(2), 15–24. https://doi.org/https://doi.org/10.4102/sajbm.v44i2.156
- Chivandi, A., & Maziriri, E. T. (2017). An evaluation of ISO 22000 food safety standards awareness and implementation in Zimbabwean branded fast-food outlets: customer, employee, and management perspectives. African Journal of Hospitality Tourism and Leisure, 6(2), 1–24. http://www.ajhtl.com/uploads/7/1/6/3/7163688/article_17_vol_6__2__2017.pdf
- Coughlan, L. M., & Saayman, M. (2018). Ceding to their appetites: A taxonomy of international tourists to South Africa. Advances in Hospitality and Leisure, 14(1), 3–22. https://doi.org/https://doi.org/10.1108/S1745-354220180000014001
- Dalle Ave, S., Venter, M., & Mhlophe, B. (2015). Sensory branding and buying behavior in coffee shops: A study on generation Y. The Retail and Marketing Review, 11(2), 93–110. https://journals.co.za/doi/10.10520/EJC181701
- de Villiers, M. V., Chinomona, R., & Chuchu, T. (2018). The influence of store environment on brand attitude, brand experience and purchase intention. South African Journal of Business Management, 49(1), 1–8.
- Diamantopoulos, A., & Winklhofer, H. M. (2001). Index construction with formative indicators: An alternative to scale development. Journal of Marketing Research, 38(2), 269–277. https://doi.org/https://doi.org/10.1509/jmkr.38.2.269.18845
- Dolbec, P. Y., & Chebat, J. C. (2013). The impact of a flagship vs. a brand store on brand attitude, brand attachment and brand equity. Journal of Retailing, 89(4), 460–466. https://doi.org/https://doi.org/10.1016/j.jretai.2013.06.003
- Fakih, K., Assaker, G., Assaf, A. G., & Hallak, R. (2016). Does restaurant menu information affect customer attitudes and behavioral intentions? A cross-segment empirical analysis using PLS-SEM. International Journal of Hospitality Management, 57, 71–83.
- Field, A. (2013). Discovering statistics using IBM SPSS (4th ed). Sage.
- Fraering, M., & Minor, M. S. (2006). Sense of community: an exploratory study of US consumers of financial services. International Journal of Bank Marketing, 24(5), 284–306. https://doi.org/https://doi.org/10.1108/02652320610681738
- Green, S. B. (1991). How many subjects does it take to do a regression analysis?. Multivariate Behavioral Research, 26(3), 499–510. https://doi.org/https://doi.org/10.1207/s15327906mbr2603_7
- Gujral, M., Rauzela, M., & Chuchu, T. (2016). An application of the marketing mix and online marketing as a business strategy for SMME cafés in South Africa. Journal of Economics and Behavioral Studies, 8(3), 14–25. https://doi.org/https://doi.org/10.22610/jebs.v8i3(J).1285
- Gupta, S., Malhotra, N. K., Czinkota, M., & Foroudi, P. (2016). The local brand representative in reseller networks. Journal of Business Research, 69(12), 5712–5723. https://doi.org/https://doi.org/10.1016/j.jbusres.2016.01.046
- Hair, J. F., Jr, Hult, G. T. M., Ringle, C., & Sarstedt, M. (2017). A primer on partial least squares structural equation modeling (PLS-SEM). Sage publications.
- Hair, J. F., Ringle, C. M., & Sarstedt, M. (2011). PLS-SEM: indeed, a silver bullet. Journal of Marketing Theory and Practice, 19(2), 137–149. https://doi.org/https://doi.org/10.2753/MTP1069-6679190202
- Hair, J. F., Jr, Sarstedt, M., Matthews, L. M., & Ringle, C. M. (2016). Identifying and treating unobserved heterogeneity with FIMIX-PLS: Part I–method. European Business Review, 28(1), 63–76. https://doi.org/https://doi.org/10.1108/EBR-09-2015-0094
- Han, H., & Hyun, S. S. (2017). Impact of hotel-restaurant image and quality of physical-environment, service, and food on satisfaction and intention. International Journal of Hospitality Management, 63(1), 82–92. https://doi.org/https://doi.org/10.1016/j.ijhm.2017.03.006
- Han, H., Lee, K. S., Chua, B. L., Lee, S., & Kim, W. (2019). Role of airline food quality, price reasonableness, image, satisfaction, and attachment in building re-flying intention. International Journal of Hospitality Management, 80(1), 91–100. https://doi.org/https://doi.org/10.1016/j.ijhm.2019.01.013
- Han, H., Nguyen, H. N., Song, H., Chua, B. L., Lee, S., & Kim, W. (2018). Drivers of brand loyalty in the chain coffee shop industry. International Journal of Hospitality Management, 72(1), 86–97. https://doi.org/https://doi.org/10.1016/j.ijhm.2017.12.011
- Hanaysha, J. R. (2018). An examination of the factors affecting consumer’s purchase decision in the Malaysian retail market. PSU Research Review, 2(1), 7–23.
- Hanks, L., Line, N., & Kim, W. G. W. (2017). The impact of the social servicescape, density, and restaurant type on perceptions of interpersonal service quality. International Journal of Hospitality Management, 61, 35–44.
- Heitmann, M., Lehmann, D. R., & Herrmann, A. (2007). Choice goal attainment and decision and consumption satisfaction. Journal of marketing research, 44(2), 234–250.
- Hellier, P. K., Geursen, G. M., Carr, R. A., & Rickard, J. A. (2003). Customer repurchase intention. European Journal of Marketing, 37(11/12), 1762–1800. https://doi.org/https://doi.org/10.1108/03090560310495456
- Henseler, J. (2017). Bridging design and behavioral research with variance-based structural equation modeling. Journal of Advertising, 46(1), 178–192. https://doi.org/https://doi.org/10.1080/00913367.2017.1281780
- Henseler, J., Hubona, G., & Ray, P. A. (2016). Using PLS path modeling in new technology research: Updated guidelines. Industrial Management & Data Systems, 116(1), 2–20. Accessed on: 23/02/2021]. https://www.businessinsider.co.za/almost-4000-restaurants-forced-to-close-during-level-3-adjusted-says-rasa-some-local-favourites-didnt-make-it-2021-2 . . https://doi.org/https://doi.org/10.1108/IMDS-09-2015-0382
- Hu, L. T., & Bentler, P. M. (1998). Fit indices in covariance structure modeling: Sensitivity to underparameterized model misspecification. Psychological Methods, 3(4), 424–453. https://doi.org/https://doi.org/10.1037/1082-989X.3.4.424
- Hulland, J. (1999). Use of partial least squares (PLS) in strategic management research: A review of four recent studies. Strategic Management Journal, 20(2), 195–204. http://3.0.CO;2-7https://doi.org/https://doi.org/10.1002/(SICI)1097-0266(199902)20:2<195::AID-SMJ13>3.0.CO;2-7
- Hultén, B. (2011). Sensory marketing: The multi‐sensory brand‐experience concept. European Business Review, 23(3), 256–273. https://doi.org/https://doi.org/10.1108/09555341111130245
- Hultén, B., Broweus, N., & Van Dijk, M. (2009). Sensory marketing. Palgrave MacMillan.
- Ismail, Z., & Ali, S. (2013). Human brands: investigating antecedents to consumers’ strong attachment to celebrities. Review of Integrative Business and Economics Research, 2(2), 53–59. https://sibresearch.org/uploads/3/4/0/9/34097180/riber_b13-068_53-59.pdf
- Jang, Y. J., Kim, W. G., & Lee, H. Y. (2015). Coffee shop consumers’ emotional attachment and loyalty to green stores: The moderating role of green consciousness. International Journal of Hospitality Management, 44, 146–156.
- Jeon, S., & Hyun, S. (2013). Examining the influence of casino attributes on baby boomers’ satisfaction and loyalty in the casino industry. Current Issues Tourism, 16(4), 343–368. https://doi.org/https://doi.org/10.1080/13683500.2012.685703
- Jia, S. S. (2020). Motivation and satisfaction of Chinese and US tourists in restaurants: A cross-cultural text mining of online reviews. Tourism Management, 78(1), 1–12. https://doi.org/https://doi.org/10.1016/j.tourman.2019.104071
- Khan, Z., Ferguson, D., & Pérez, A. (2015). Customer responses to CSR in the Pakistani banking industry. International Journal of Bank Marketing, 33(4), 471–493. https://doi.org/https://doi.org/10.1108/IJBM-07-2014-0097
- Khuong, M. N., & Van Nga, B. (2018). Factors affecting international tourists’ food satisfaction and word-of-mouth: the case of vietnamese cuisine. Advances in Business, Hospitality, and Tourism Research, 1(1), 27–42. Doi: https://doi.org/10.5038/9781732127524
- Kim, H. J., Park, J., Kim, M. J., & Ryu, K. (2013). Does perceived restaurant food healthiness matter? its influence on value, satisfaction and revisit intentions in restaurant operations in South Korea. International Journal of Hospitality Management, 33(1), 397–405. https://doi.org/https://doi.org/10.1016/j.ijhm.2012.10.010
- Kim, J., Almanza, B., Ghiselli, R., & Sydnor, S. (2017). The effect of sensation seeking and emotional brand attachment on consumers’ intention to consume risky foods in restaurants. Journal of Foodservice Business Research, 20(3), 336–349. https://doi.org/https://doi.org/10.1080/15378020.2016.1209721
- Kim, W. G., Ng, C. Y. N., & Kim, Y. S. (2009). Influence of institutional DINESERV on customer satisfaction, return intention, and word-of-mouth. International Journal of Hospitality Management, 28(1), 10–17. https://doi.org/https://doi.org/10.1016/j.ijhm.2008.03.005
- Kivela, J., Inbakaran, R., & Reece, J. (1999). Consumer research in the restaurant environment, part 1: A conceptual model of dining satisfaction and return patronage. International Journal of Contemporary Hospitality Management, 11(5), 205–222. https://doi.org/https://doi.org/10.1108/09596119910272739
- Kock, N. (2015). Common method bias in PLS-SEM: A full collinearity assessment approach. International Journal of e-Collaboration, 11(4), 1–10. https://doi.org/http://dx.doi.org/10.4018/ijec.2015100101
- Konuk, F. A. (2019). The influence of perceived food quality, price fairness, perceived value and satisfaction on consumers’ revisit and word of mouth intentions towards organic food restaurants. Journal of Retailing and Consumer Services, 50(1), 103–110. https://doi.org/https://doi.org/10.1016/j.jretconser.2019.05.005
- Kotler, P., & Keller, K. L. (2016). Marketing management (15th ed). Pearson.
- Kumar, R. (2019). Research Methodology: A step by step guide for beginners (5th ed). SAGE.
- Lai, I. K. W. (2020). An examination of satisfaction on word of mouth regarding Portuguese foods in Macau: applying the concept of integrated satisfaction. Journal of Hospitality and Tourism Management, 43(1), 100–110. https://doi.org/https://doi.org/10.1016/j.jhtm.2020.02.011
- Lam, A. Y. C., Lau, M. M., & Cheung, R. (2016). Modelling the relationship among green perceived value, green trust, satisfaction, and repurchase intention of green products. Contemporary Management Research, 12(1), 47–60. https://doi.org/https://doi.org/10.7903/cmr.13842
- Ledikwe, A., Stiehler-Mulder, B., & Roberts-Lombard, M. (2020). Product involvement, WOM and eWOM in the fast food industry: A young adult perspective in an emerging African economy. Cogent Business & Management, 7(1), 1–22. https://doi.org/https://doi.org/10.1080/23311975.2020.1817288
- Lee, S., Chua, B. L., & Han, H. (2020). Variety-seeking motivations and customer behaviors for new restaurants: an empirical comparison among full-service, quick-casual, and quick-service restaurants. Journal of Hospitality and Tourism Management, 43(1), 220–231. https://doi.org/https://doi.org/10.1016/j.jhtm.2020.04.004
- Low, S. M., & Altman, I. (1992). Place attachment. In Place attachment (pp. 1–12). Springer.
- Malhotra, N. K. (2007). Marketing Research: An applied orientation. Prentice Hall International.
- Mashao, M. P., Maziriri, E. T., & Chuchu, T. (2020). Multi-sensory dimensions effect on affective attitudes, consumer attachment and positive word of mouth in quick-service restaurants. Acta Universitatis Danubius. Œconomica, 16(2), 176–200. http://journals.univ-danubius.ro/index.php/oeconomica/article/view/6491
- Maziriri, E. T., Chuchu, T., & Madinga, N. W. (2019). Navigating on the antecedents that influence store patronage, apparel purchase decision and store attachment among the generation Y cohort. The Retail and Marketing Review, 15(1), 39–56. https://repository.up.ac.za/handle/2263/70769
- Mhlanga, O., & Machingambi, S. (2016). The influence of demographic variables on customers’ expectations in restaurants in the Eastern Cape Province of South Africa. African Journal of Hospitality, Tourism and Leisure, 5(1), 1–21. http://www.ajhtl.com/uploads/7/1/6/3/7163688/article_12_vol_5__1__2016.pdf
- Mhlanga, O., & Tichaawa, T. M. (2017). Influence of social media on customer experiences in restaurants: A South African study. Tourism: An International Interdisciplinary Journal, 65(1), 45–60. https://hrcak.srce.hr/178622
- Miller, E. G., & Kahn, B. E. (2005). Shades of meaning: The effect of color and flavor names on consumer choice. Journal of Consumer Research, 32(1), 86–92. https://doi.org/https://doi.org/10.1086/429602
- Moolman, H. J. (2011). Restaurant customer satisfaction and return patronage in a Bloemfontein shopping mall. Acta Commercii, 11(1), 129–146. https://doi.org/https://doi.org/10.4102/ac.v11i1.157
- Moussa, S., & Touzani, M. (2013). Customer-service firm attachment: What it is and what causes it?. International Journal of Quality and Service Sciences, 5(3), 337–359. https://doi.org/https://doi.org/10.1108/IJQSS-01-2013-0002
- Namkung, Y., & Jang, S. (2007). Does food quality really matter in restaurants? its impact on customer satisfaction and behavioral intentions. Journal of Hospitality & Tourism Research, 31(3), 387–409. https://doi.org/https://doi.org/10.1177/1096348007299924
- Nel, J., Williams, A., Steyn, R., & Hind, C. (2018). Customer experiences and expectations of sit-down restaurants: an auto-ethnographic perspective on restaurant failure. African Journal of Hospitality, Tourism and Leisure, 7(3), 1–16. http://uir.unisa.ac.za/handle/10500/25041
- Neneh, B. N. (2019). From entrepreneurial alertness to entrepreneurial behavior: the role of trait competitiveness and proactive personality. Personality and Individual Differences, 138(1), 273–279. https://doi.org/https://doi.org/10.1016/j.paid.2018.10.020
- Ningsih, S. R., Indradewa, R., Syah, T. Y. R., & Fajarwati, D. (2021). The perception justice effect, recovery disconfirmation, and recovery satisfaction on positive word of mouth behavior after failure delivery over fast food restaurant service. Journal of Multidisciplinary Academic, 5(1), 48–54. https://www.kemalapublisher.com/index.php/JoMA/article/view/537/540
- Oh, H. (2000). Diners’ perceptions of quality, value, and satisfaction: A practical viewpoint. Cornell Hotel and Restaurant Administration Quarterly, 41(3), 58–66. https://doi.org/https://doi.org/10.1177/001088040004100317
- Özmen, A., & Ögel, İ. Y. (2020). The interaction between customer experience, satisfaction and positive word of mouth: A study on city marketing in Afyonkarahisar. Contemporary Studies in Economic and Financial Analysis, 1(104), 105–121. Emerald Publishing Limited. https://doi.org/https://doi.org/10.1108/S1569-375920200000104007
- Park, J., Stoel, L., & Lennon, S. J. (2008). Cognitive, affective and conative responses to visual simulation: The effects of rotation in online product presentation. Journal of Consumer Behaviour, 7(1), 72–87. https://doi.org/https://doi.org/10.1002/cb.237
- Pedeliento, G., Andreini, D., Bergamaschi, M., & Salo, J. (2016). Brand and product attachment in an industrial context: The effects on brand loyalty. Industrial Marketing Management, 53(1), 194–206. https://doi.org/https://doi.org/10.1016/j.indmarman.2015.06.007
- Pettijohn, L. S., Pettijohn, C. E., & Luke, R. H. (1997). An evaluation of fast-food restaurant satisfaction: Determinants, competitive comparisons and impact on future patronage. Journal of Restaurant & Foodservice Marketing, 2(3), 3–20. https://doi.org/https://doi.org/10.1300/J061v02n03_02
- Popovic, I., Bossink, B. A., & Van Der Sijde, P. C. (2019). Factors influencing consumers’ decision to purchase food in environmentally friendly packaging: what do we know and where do we go from here?. Sustainability, 11(24), 1–22. https://doi.org/https://doi.org/10.3390/su11247197
- Prebensen, N. K., Woo, E., & Uysal, M. S. (2014). Experience value: Antecedents and consequences. Current Issues Tourism, 17(10), 910–928. https://doi.org/https://doi.org/10.1080/13683500.2013.770451
- Qu, H. (1997). Determinant factors and choice intention for Chinese restaurant dining: A multivariate approach. Journal of Restaurant & Foodservice Marketing, 2(2), 35–49. https://doi.org/https://doi.org/10.1300/J061v02n02_03
- Quah, S. H., & Tan, A. K. (2009). Consumer purchase decisions of organic food products: an ethnic analysis. Journal of International Consumer Marketing, 22(1), 47–58. https://doi.org/https://doi.org/10.1080/08961530902844949
- Ranaweera, C., & Menon, K. (2013). For better or for worse? adverse effects of relationship age and continuance commitment on positive and negative word of mouth. European Journal of Marketing, 47(10), 1598–1621. https://doi.org/https://doi.org/10.1108/EJM-06-2011-0295
- Rigdon, E. E. (2014). Rethinking partial least squares path modeling: breaking chains and forging ahead. Long Range Planning, 47(3), 161–167.
- Roy, S. K. (2013). Consequences of customer advocacy. Journal of Strategic Marketing, 21(3), 260–276. https://doi.org/https://doi.org/10.1080/0965254X.2013.790468
- Ryu, K., Lee, H.-R., & Kim, W. G. (2012). The influence of the quality of the physical environment, food, and service on restaurant image, customer perceived value, customer satisfaction, and behavioral intentions. International Journal of Contemporary Hospitality Management, 24(2), 200–223. https://doi.org/https://doi.org/10.1108/09596111211206141
- Sarstedt, M., Ringle, C. M., & Joseph, F. (2014). PLS-SEM: looking back and moving forward. Long Range Planning, 47(3), 132–137. https://doi.org/https://doi.org/10.1016/j.lrp.2014.02.008
- Scannell, L., Hodgson, M., Villarreal, G. M., & Gifford, R. (2016). The role of acoustics in the perceived suitability of, and well-being in, informal learning spaces. Environment and Behavior, 48(6), 769–795. https://doi.org/https://doi.org/10.1177/0013916514567127
- Scannell, L., Tan, L. Q., Cox, R. S., & Gifford, R. (2019). Place attachment, well-being, and resilience (pp. 243–251). The Routledge Handbook of People and Place in the 21st-Century City.
- Shah, S. H. H., Lei, S., Hussain, S. T., & Mariam, S. (2019). How consumer perceived ethicality influence repurchase intentions and word-of-mouth? A mediated moderation model. Asian Journal of Business Ethics, 9(1), 1–21. https://philpapers.org/rec/SHAHCP-3
- South African Government. (2021). Regulations and Guidelines - Coronavirus COVID-19. The Department of Health South Africa.
- Sthapit, E., Björk, P., & Coudounaris, D. N. (2017). Emotions elicited by local food consumption, memories, place attachment and behavioural intentions. Anatolia, 28(3), 363–380. https://doi.org/https://doi.org/10.1080/13032917.2017.1322111
- Swaminathan, V., Stilley, K. M., & Ahluwalia, R. (2009). When brand personality matters: The moderating role of attachment style. Journal of Consumer Research, 35(6), 985–1002. https://doi.org/https://doi.org/10.1086/593948
- Tajvidi, M., Richard, M. O., Wang, Y., & Hajli, N. (2020). Brand co-creation through social commerce information sharing: The role of social media. Journal of Business Research, 121, 476–486.
- Tandon, A., Aakash, A., & Aggarwal, A. G. (2020). Impact of EWOM, website quality, and product satisfaction on customer satisfaction and repurchase intention: Moderating role of shipping and handling. International Journal of System Assurance Engineering and Management, 11(2), 1–8. DOI: https://doi.org/10.1007/s13198-020-00954-3
- Tenenhaus, M., Vinzi, V. E., Chatelin, Y. M., & Lauro, C. (2005). PLS path modeling. Computational Statistics & Data Analysis, 48(1), 159–205. https://doi.org/https://doi.org/10.1016/j.csda.2004.03.005
- Thang, D. C. L., & Tan, B. L. B. (2003). Linking consumer perception to preference of retail stores: an empirical assessment of the multi-attributes of store image. Journal of retailing and consumer services, 10(4), 193–200.
- Thomson, M. (2006). Human brands: Investigating antecedents to consumers’ strong attachments to celebrities. Journal of Marketing, 70(3), 104–119. https://doi.org/https://doi.org/10.1509/jmkg.70.3.104
- Verkijika, S. F., & De Wet, L. (2018). E-government adoption in sub-Saharan Africa. Electronic Commerce Research and Applications, 30(1), 83–93. https://doi.org/https://doi.org/10.1016/j.elerap.2018.05.012
- Vinzi, V. E., Trinchera, L., & Amato, S. (2010). PLS path modeling: From foundations to recent developments and open issues for model assessment and improvement. In Handbook of partial least squares (pp. 47–82). Springer.
- Vlajčić, D., Caputo, A., Marzi, G., & Dabić, M. (2019). Expatriates managers’ cultural intelligence as promoter of knowledge transfer in multinational companies. Journal of Business Research, 94, 367–377.
- Wallendorf, M., & Arnould, E. J. (1988). “My favorite things”: A cross-cultural inquiry into object attachment, possessiveness, and social linkage. Journal of Consumer Research, 14(4), 531–547. https://doi.org/https://doi.org/10.1086/209134
- Wei, Y. P., & Huang, S. H. (2017). Food traceability system as elevating good corporate social responsibility for fast-food restaurants. Cogent Business & Management, 4(1), 1–10. https://doi.org/https://doi.org/10.1080/23311975.2017.1290891
- Wetzels, M., Odekerken-Schröder, G., & Van Oppen, C. (2009). Using PLS path modeling for assessing hierarchical construct models: guidelines and empirical illustration. MIS Quarterly, 33(1), 177–195. https://doi.org/https://doi.org/10.2307/20650284
- Wu, H. C., Cheng, C. C., Ai, C. H., & Chen, G. (2019). Relationships between restaurant attachment, experiential relationship quality and experiential relationship intentions: the case of single friendly restaurants in Taiwan. Journal of Hospitality and Tourism Management, 40(1), 50–66. https://doi.org/https://doi.org/10.1016/j.jhtm.2019.06.002
- Yi, Y., & La, S. (2004). What influences the relationship between customer satisfaction and repurchase intention? investigating the effects of adjusted expectations and customer loyalty. Psychology & Marketing, 21(5), 351–373. https://doi.org/https://doi.org/10.1002/mar.20009
- Yoon, S., & Park, J. E. (2012). Do sensory ad appeals influence brand attitude?. Journal of Business Research, 65(11), 1534–1542. https://doi.org/https://doi.org/10.1016/j.jbusres.2011.02.037
- Yu, Y. S., Luo, M., & Zhu, D. H. (2018). The effect of quality attributes on visiting consumers’ patronage intentions of green restaurants. Sustainability, 10(4), 1187.
- Zikmund, W. G., & Babin, B. J. (2010). Exploring Marketing Research. Thompson. Higher Education.