
ABSTRACT
Congestion at terminal gates is a significant issue that many ports are dealing with. The port of Songkhla, which serves as the main seaport in southern Thailand, has been confronted with this issue, together with an increase in the number of trucks over the last five years. This study aims to investigate alternatives for improving service operations at the terminal gate, including gate lane expansion, queueing policy in exit-gate sharing, and work process reorganization. A simulation model was developed to analyze the queueing performance: truck queue length and gate waiting time. Scenarios analysis was performed and compared to the baseline model to investigate the impact of proposed approaches on gate performance. The simulation results confirm that a gate-sharing policy can alleviate congestion at a certain truck arrival rate. The method of reorganizing work processes by separating customs work from gate operations and placing it in a new work station appears most appealing. It produces a significant improvement in congestion, comparable to the performance of the gate lane expansion approach while requiring less investment.
PUBLIC INTEREST STATEMENT
Traffic congestion has recently attracted much attention in the port industry. Even though numerous research have contributed to the literature on various issues related to this problem, each port’s specific characteristics should be evaluated to execute the improvement technique properly. The port of Songkhla, a major container port in southern Thailand, is also experiencing terminal gate congestion. The purpose of this research is to identify solutions for improving service operations at the Songkhla port’s terminal gate. We develop a simulation model to evaluate gate performance under various scenarios. The findings indicate that restructuring the work process of gate operations can considerably enhance gate performance. This technique is equivalent to adding one additional gate lane to the system while it requires significantly less investment. The findings of this study provide information to help port authorities decide on a strategy to improve gate performance.
1. INTRODUCTION
As the marine logistics industry continues to expand, many ports and surrounding communities are experiencing traffic congestion at the container terminal gate. Gate waiting time is not only detrimental to truckers’ economic well-being, but it also causes supply chain delays and contributes significantly to air pollution. All of these factors combine to make traffic congestion at the gate a severe problem. As a result, the port industry is faced with increasing capacity to efficiently handle freight traffic.
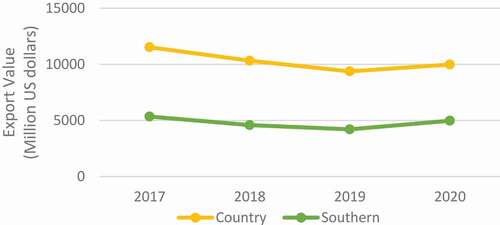
Songkhla port is the only transit port in southern Thailand that connects to Singapore port. It is a major port in the southern part of the country, with rubber products as the primary export cargo. As shown in , Thailand’s average annual export value of rubber products is approximately 10,000 million US dollars, with approximately 46 percent exported from the southern part of the country via the country’s ports and road freight or rail transportation to Penang port (Bank of Thailand (BOT), Citation2020). According to port statistics from 2013 to 2018, Songkhla port handles an annual cargo volume of approximately 2 million tons, with approximately 200,000 TEUs. Furthermore, export volume has been steadily increasing since 2013, despite the Port only having two entrance lanes and a limited area for expansion. Additionally, the current truck arrival pattern results in peak hours at the gate. As a result, Songkhla port struggles to relieve traffic congestion and is currently implementing an exit gate sharing policy. However, if the truck arrival rate continues to rise, such an approach will be ineffective in addressing the problem.
Figure 1. Export value of rubber products of Thailand
Many researchers have focused on managing two factors: truck arrival pattern and gate service rate to deal with gate congestion. Because truck arrival patterns vary from hour to hour, this variation in truck arrivals results in peak service hours due to an imbalance of truck demand and service capacity. Thus, truck arrival management is a method of smoothing out truck demand and, as a result, reducing long queues (e.g., G. Chen et al., Citation2013; Phan & Kim, Citation2016; Zehendner & Feillet, Citation2014). Even though several studies of the truck appointment system (TAS) revealed its efficiency, it was discovered that due to the competitive nature of marine logistics and the limitations of port operations, some ports are unable to implement TAS into their operational activities (Giuliano & O’Brien, Citation2007; Van Asperen et al., Citation2013). On the other hand, an increase in the number of gate lanes and gate processing productivity are considered to improve the gate service rate. There have been studies, for example, Guan and Liu (Citation2009) and Minh and Hyunh (Citation2017) developed optimization models to determine the optimal number of gate lanes. These studies, however, assumed a stationary truck arrivals process. Besides that, there is a clear gap in practice regarding the gate operations of the Songkhla ports and the country’s main port, Laem Chabang. As a result, this research aims to solve the congestion problem by reducing truck queueing time at the gate. To accomplish this, alternative service systems to improve service rate and service efficiency at the terminal gate are being considered. Three approaches are investigated and compared: increasing the number of gate lanes, implementing a queueing policy in gate-sharing, and redesigning the work process at the gate. As this queueing problem is stochastic with a non-stationary truck arrival pattern, simulation model is employed to evaluate the gate efficiency of each method.
The rest of this paper is structured as follows: Section 2 provides an overview of the literature on managing terminal gate congestion. Section 3 contains a description of the problem. In section 4, the simulation model is described, and the accompanying data sets are presented. Section 5 presents and discusses the simulation results, which include scenario and sensitivity analysis. Finally, section 6 draws our research to a conclusion by providing significant insights and future research directions.
2. LITERATURE REVIEW
Several studies in the literature discuss various issues that arise at port terminals and across the port logistic chain. As port operations can be divided into three parts: landside, seaside, and yard operations, a large body of literature addresses port operations from various perspectives. Various contributions focus on the seaside operations: quay crane scheduling, berth allocation, and stowage planning (e.g., Bierwitth & Meisel, Citation2010; Cheong et al., Citation2010). (e.g., Bierwitth & Meisel, Citation2010; Cheong et al., Citation2010). Yard operations, which involve container placement assignment and yard equipment planning and scheduling, are another area of study (e.g., Le-Griffin et al., Citation2011). Landside or gate operations decisions at a terminal gate are related to capacity planning and demand management. Port authorities and terminal operators are becoming more interested in this area of research.
Congestion at the terminal gate has recently received much attention. Several studies focus on this topic from different perspectives, employing various approaches and strategies to improve operational efficiency, reduce traffic congestion, and alleviate environmental issues affecting the community and society. The investigations have been classified into two categories: truck arrival management and gate operations planning and design.
Many studies presented various approaches for truck arrival management, such as time-varying tolls, vessel-dependent time windows, and a truck appointment system (TAS). The truck appointment system was initially implemented in the Port of Vancouver, where it successfully reduced gate congestion (Morais & Lord, Citation2006). Since then, many studies on TAS application have been conducted (e.g., X. Chen et al., Citation2011; Davies & Principal, Citation2009; Ramirez-Nafarrate et al., Citation2017; Sharif et al., Citation2011; Zhang et al., Citation2019). The majority of studies showed that the use of TAS enhanced port operations by reducing queueing time and resulting in less congestion. However, several studies have concluded that the TAS does not considerably improve waiting times (Giuliano & O’Brien, Citation2007). They discovered that the policies for applying the TAS had not been completed. For example, terminals exclusively examine gate queues and disregard yard operations planning. As a result, there are no plans to respond to the trucks that have been scheduled. As a result, trucks must continue to wait inside the port. Furthermore, according to Hyunh and Walton (Citation2008), if TAS did not correctly establish the quota of truck arrivals, both the port and the trucks could suffer. Contributions to supporting a TAS can be found in the literature, for example, in Zehendner and Feillet (Citation2014), G. Chen et al. (Citation2013), Phan and Kim (Citation2016), and Phan and Kim (Citation2016) employed a pricing mechanism to determine the appointments quota. In contrast, Zehendner and Feillet (Citation2014) developed an optimization model to optimize the arrival truck appointment quotas in each period under a capacity constraint.
Furthermore, studies have been conducted to establish vessel-dependent time windows (VDTWs) to control truck arrivals with time windows (G. Chen et al., Citation2013; Chen & Jiang, Citation2016). The optimization models were developed and analyzed using heuristic algorithms. The results suggested that grouping trucks with vessel-dependent time windows can greatly reduce gate congestion.
It should be noted that, while TAS has been successfully deployed at several ports, not all of the anticipated benefits have been realized. Operating practices have been identified as elements that have a significant impact on benefits (Giuliano & O’Brien, Citation2007; Hyunh & Walton, Citation2008; Islam & Olsen, Citation2014). Furthermore, TAS is suited for ports with sufficient capacity to rearrange the line, which may not be the case in most developing-country port terminals where space is restricted (Van Asperen et al., Citation2013). Thus, it is critical to evaluate the unique characteristics of each port as well as its servicing policy.
For gate capacity expansion, some studies examine the appropriate number of gate lanes. Guan and Liu (Citation2009), for example, employed a queuing model to investigate gate congestion. To accomplish this, an optimization model was developed to determine the optimal number of gate lanes that minimizes the total gate system cost. Likewise, Minh and Hyunh (Citation2017) developed an optimization model to determine the optimal number of gate lanes under different truck arrival and gate service rates. The models in these investigations, however, are assumed to be stationary queueing models. As truck arrival rates vary from hour to hour, terminal gate operations are a typical non-stationary queuing system. Therefore, the truck queueing behavior at the gate should be analyzed using non-stationary queueing models (G. Chen et al., Citation2013).
In addition to analyzing the number of gate lanes, an improvement in gate service time is being examined as a strategy to increase gate capacity. Fleming et al. (Citation2013) developed a simulation model to investigate the gate system by comparing two queueing strategies: pooled and non-pooled queues. The results indicated that employing a pooled queue resulted in better queue performance. According to Motono et al. (Citation2016), improper documents carried by trucks contribute to gate congestion. To demonstrate the impact of eliminating improper documents on gate capacity, a simulation model was created and tested. However, the study made no recommendations about how to eliminate the improper documents.
According to Maguire et al. (Citation2010), the gate capacity might be increased by utilizing the IT system. A case study of the Port of Savannah was conducted, and it was discovered that the gate service time was lowered when the IT system was implemented. Dekker et al. (Citation2013) proposed the concept of a chassis exchange terminal (CET), in which a truck arriving at the port with a delivered container picked up an import container before leaving the port. The simulation model is developed, and the findings show that the CET reduces empty-truck trips while also reducing congestion. Islam (Citation2018) develops this concept by introducing a truck-sharing model that seeks to maximize the utilization of container trucks. The simulation model was created to address the empty truck hauling problem by incorporating a truck sharing and truck appointment system concepts. The simulated results demonstrated that truck-sharing improves port capacity and can efficiently handle the increased future truck volume.
For the study on traffic congestion in Thailand’s port area, there were studies of the queuing system at the chosen entrance gate at Laem Chabang port. The simulation modeling was used to perform the system analyses. Sathitmon (Citation2013) proposed the appropriate number of service lanes at the gate, whereas Tuntivejakul (Citation2015) proposed a time-varying toll to shift demand from peak to off-peak hours. In addition, Torteeka (Citation2011) investigated traffic congestion at the Bangkok Port from intra-port operations. The optimal number of berths and cranes was recommended.
To the best of our knowledge, the investigation of port traffic issues has been studied primarily at the country’s major ports: Laem Chabang Port and Bangkok Port. However, there has been no research on traffic congestion at Songkhla Port, the major maritime port in the south. Furthermore, many southern exporters convey their goods to Malaysia’s Penang port through road or rail rather than Songkhla port. Therefore, this research aims to assess traffic congestion and propose ways to enhance service at the gate. Although this analysis is comparable to earlier studies, our work is special in that it simulates the uniqueness of the Songkhla port using various factors. Furthermore, this study’s findings will help improve service efficiency and, in part, contribute to Songkhla Port’s competitiveness.
3. PROBLEM DESCRIPTION
Songkhla Port is known as Thailand’s largest container port in the south. With approximately 200,000 TEUs, it handles an annual cargo volume of more than 2 million tons. As a result of the port’s constantly increasing international trade volume, traffic congestion at the entrance gate has occurred. The port is under increasing pressure to increase gate capacity to alleviate the congestion.
3.1. CURRENT PRACTICES IN GATE OPERATIONS
Songkhla port is open daily from 7 a.m. to 5 p.m., with overtime for the remainder of the day. There are two lanes at the entrance gate and one lane at the exit gate. The first entrance lane is only for certain vehicle types, such as passenger cars. This lane’s operations include vehicle identification verification and terminal check-in. The second lane, also known as the service lane, offers various services such as vehicle identification and container/cargo identification verification, vehicle weighing, customs operations, and terminal check-in. This lane requires the presence of a port officer, a customs officer, and a supported facility: a weighbridge to provide services, whereas the first lane only requires the presence of a port officer.
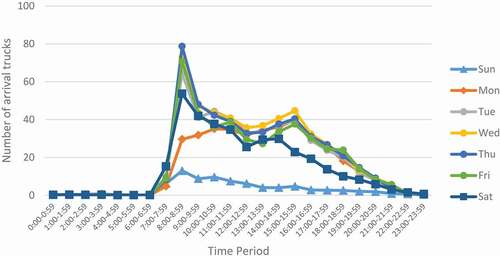
depicts the gate service time distribution, with an average of 3 minutes. According to hourly and daily arrival statistics from August 2018 to February 2019, the port experiences high peak demand from Tuesday to Friday, with an average of 457 daily arrivals, a minimum of 393 arrivals, and a maximum of 544 arrivals. The highest gate congestion is shown in between 8:00, 9:00 a.m. almost every day of the week.
Figure 2. Gate service time distribution
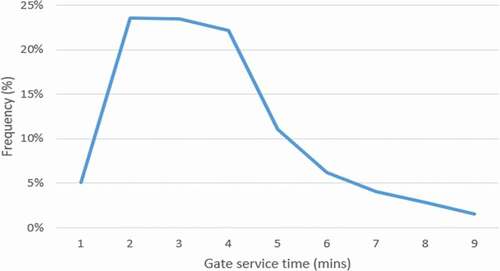
Figure 3. Number of arrival trucks on daily and hourly basis
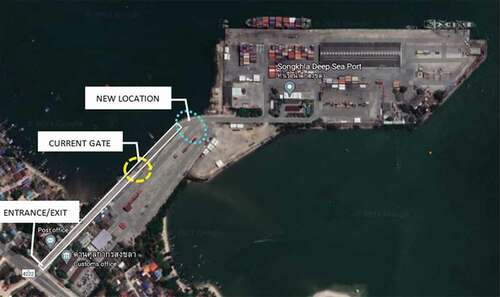
As there is a peak period for arrival trucks and only one service lane at the entrance gate, arrival trucks face a long queue during peak hours. Furthermore, the end of the queue is lined up on the main road, causing problems for those nearby. illustrates the Songkhla port and its surroundings.
Figure 4. Songkhla port
Currently, the port operations manager has decided to modify their service operations at the entrance gate by allowing arrival trucks to get gate operations from the exit gate, which has much lower utilization than the entrance gate and the same facilities and service officers. However, this approach is only permitted when the exit gate is idle and more than ten arriving trucks are lined up at the entrance gate. Although this approach reduces truck waiting times, a long-term solution and preparation for an increasing number of arriving trucks are required.
3.2. PROBLEM FORMULATION
According to the current practices described above, traffic congestion at the gate results from a queueing problem with arrival trucks and gate operations. Because arrival trucks are random and cannot be predicted ahead of time, truck waiting time is determined by the rate of truck arrivals and the productivity of gate operations. Existing studies have proposed several methods to deal with the problem of a truck queue at the gate, such as time-varying tolls and truck appointment systems to manage truck arrivals. However, to compete with the Penang port in Malaysia, the Songkhla port chose not to impose any conditions on its service, necessitating the expansion of gate capacity and the improvement of gate operations efficiency.
Therefore, decisions are made in this study regarding the number of gate lanes and service operations at the gate in order to minimize truck waiting time while lowering investment costs. Furthermore, due to the limited land area available at the Songkhla port, the new gate location is shown in only allows for a limited number of lanes expansion. Therefore, improvement in gate service time is also taken into account.
Because terminal operations are stochastic and truck arrival patterns are non-stationary, using optimization techniques for this complex model has mathematical limitations, whereas discrete event simulation can deal with the dynamic and stochastic processes (Trunfio, Citation2011). Thus, simulation of queue models is an appropriate technique for solving queueing problems at the terminal gate. Scenario analysis is conducted to examine the impact of the number of gate lanes, queuing policy, and work process design on gate performance. In addition, sensitivity analysis is performed to evaluate gate performance as traffic volume increases.
4. SIMULATION MODEL
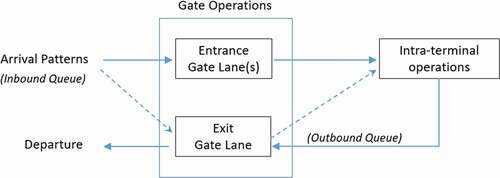
A discrete-event simulation model is developed to analyze the impact of the number of gate lanes and a work process on gate performance, in which consumers and servers are assigned to trucks and gate operators, respectively. depicts the basic structure of the model. The model comprises four elements: the vehicle arrival, the gate operations, the intra-terminal operations, and the vehicle departure.
Figure 5. The structure of the simulation model
In this study, the simulation software-ARENA is used to model the gate operations. The simulation model is based on actual data from the port’s peak days (Tuesday through Friday). The port operates from 7 a.m. to 5 p.m., with an overtime schedule for the rest of the day. During these four days, a total of 457 vehicles arrived. According to Songkhla port operations, arrival vehicles are classified into eight categories based on the services required. Arrival rates vary depending on the time of day. Gate operations are classified into three types of processes based on the type of vehicle. The first process is for those who enter the first lane. The process consists of verifying the driver’s identification and checking in at the terminal. Trucks entering the second or service lane are subject to the second and third processes. The second process required vehicle weighting and verification to check the identifications of drivers, vehicles, and corresponding containers, as well as the necessary documents, whereas the third required the same process as the second with an additional custom operation. As a result, gate processing time varies according to truck type.
Upon arrival, the vehicle can be served by the operators at the entrance gate. If the operator is busy, vehicles must wait in line for their services. When there are more than ten inbound trucks in the queue and no truck in the outbound queue, arrival trucks can receive inbound gate operations from the exit gate. Even though the focus of this study is on congestion at the entrance gate, the arrival rate of outbound trucks must be considered because they will share the exit gate with inbound trucks. Therefore, intra-terminal operations time is taken into account. Because these trucks will later leave the port through the exit gate and incur the outbound truck’s arrival rate, the distribution of turnaround time for each type of truck is examined. Each truck’s intra-terminal processing time is assumed to follow the distribution of its turnaround time.
The input data for the simulation were gathered from a secondary data source: the port’s computerized system and a field survey. The data includes the gate service time, vehicles arrival rate, and truck throughput time. The characteristics of service time at the entrance gate, the characteristics and patterns of arriving vehicles, and the distribution of truck turnaround time are described below.
4.1. VEHICLE ARRIVAL PATTERN
Vehicles arrive at their preferred time, and arrival rates vary according to the time of day. The port categorizes arrival vehicles into eight groups: container-in, container-out, container-stuffing, container-unstuffing, direct-import, direct-export, container-in with one additional job, and passenger & others. A container-in truck has a container attached to it. A container-out truck does not have a container connected to it but seeks to pick up a container from a port. A container-stuffing vehicle transports cargo into a port for container stuffing and then departs empty. Container-unstuffing trucks are empty trucks designed to execute container unstuffing inside the port before carrying cargo out. An empty truck arriving at the port to pick up import goods is referred to as a “direct-import,” whereas a vehicle arriving at the port with direct export cargo is referred to as a “direct-export.”
shows the proportion of each type of arrival vehicle based on hourly and daily arrival statistics at the port from August 2018 to February 2019. According to the findings, nearly 80% of arrivals are container-in and container-out, with roughly the same proportion. The number of arrival vehicles on a daily and hourly basis was examined. The hourly distribution of arrival vehicles shown in demonstrates that the traffic peak occurred between 8:00, 9:00 a.m. and gradually decreases until 1 p.m. when the arrivals rate begins to increase slightly until 4 p.m.
Table 1. Percentage of each arrival vehicle type
Table 2. Hourly traffic distribution of arrival vehicles
4.2. GATE OPERATIONS AND SERVICE TIME
As previously stated, two lanes at the entrance gate offer different services to inbound operations:
1. The first lane, known as the no service lane, is for a gate officer to perform vehicle identification and terminal check-in verification. This lane serves no documentation operations. Only two types of vehicles: type-2(container-out) and type-8(passenger and others), are permitted to enter this lane. This process takes a total time of 5 to 10 seconds on average.
2. The second lane, also known as the service lane, offers a variety of services, including vehicle weighting and verification to check the identifications of drivers, vehicles, and corresponding containers and the necessary documents by the port officer. There are three types of vehicles: type-1(container-in), type-5(container-in with one additional job), and type-7(direct-export), which are required an additional customs operation by the customs officer at the gate. This lane requires both a port officer and a customs officer and a supported facility: a weighbridge to perform all services. depicts the distribution of service time for each vehicle type by the port officer. The custom service time was also examined and found that it follows a gamma distribution, with minimum, maximum, and average service times of 0.25, 6.5, and 1.71 minutes, respectively.
Table 3. Distribution of inbound service time (minute)
Data on gate service time for the inbound and outbound operations were collected. Then, the distribution fitting is performed using the Input Analyzer module in ARENA to estimate the distribution pattern of service time at the service lane. summarizes the distribution of the inbound service time at the gate.
There is only one service lane at the exit gate for all types of trucks. However, vehicles of type-1 (container-in) and type-8(passenger and others) can exit the port via the no service lane within 10 seconds. Based on collected data, the service processing time takes a total time of half a minute to one and a half minutes on average for type-2(container-out) and type-7(direct-import) vehicles, while other types of trucks required the service time between 20 to 45 seconds.
4.3. TRUCK TURNAROUND TIME
Under the current modification of gate operations which allows arrival trucks to get their services from the exit gate during high gate congestion, the arrival rate of departure trucks at the exit gate affects the ability to support this design. Therefore, the turnaround time for each truck was recorded and analyzed. depicts the turnaround time distribution. In simulation models, it is assumed that each truck type has a turnaround time that follows this distribution.
Table 4. Distribution of truck turnaround time (minute)
4.4. SCENARIOS
Five alternative scenarios are designed to compare with current operations (baseline) to analyze the impact of the number of gate lanes, queuing policy, and work process design on gate performance. The comparison is based on queueing performance measures, including average and maximum truck waiting time and average queue length.
Scenario 1 (S1)
This scenario is comparable to current operations (baseline). The exit gate sharing policy applies without regard to the length of an inbound queue. That is, incoming trucks may get inbound servicing operations from the exit gate as long as there is no truck in the outbound queue. This approach contributes to an increase in service rate at the gate without constructing a new service lane.
Scenario 2 (S2)
Because the work process of a service lane can be separated into two consecutive subprocesses: port operations and customs operations, not all trucks entering this lane require customs operations, once port operations are completed, the work is passed to a customs operator. The idle port officer cannot assist the next truck because the current truck has reserved the service lane and weighbridge. As a result, the average gate service time is approximately 3 minutes, whereas the major port of the country, Laem Chabang, is shown to be 75 seconds (Sathitmon, Citation2013). This practice demonstrates the inefficient use of gate resources.
This scenario explores the consequences of eliminating customs work from gate operations and incorporating it into a new workstation. After receiving inbound operations at the gate, two types of trucks: container-in and direct-export, leave the gate to enter the next work station: customs service, whereas others can immediately proceed to their subsequent necessary operations. In this circumstance, there is no gate-sharing policy. As a result, this scenario investigates the impact of work process design on gate performance without adding a new service lane.
Scenarios 3–5 (S3-S5)
These scenarios were developed to explore the impact of adding one more service lane for the entrance gate under different conditions. There is no gate-sharing policy in Scenario 3. Scenario 4 employed the same gate-sharing policy as the baseline model, whereas scenario 5 used a gate-sharing strategy without a condition on the length of the inbound queue.
5. SIMULATION RESULTS AND DISCUSSIONS
As previously stated, the simulation models are built and examined hourly for the busiest days of the week (Tuesday through Friday) using ARENA software. The truck arrival data is generated at random based on the observed truck arrival pattern. The service time and truck turnaround time for each type of truck are assumed to follow the distribution as mentioned earlier. In the experiment, each model was run for 100 replications. Sensitivity analysis is conducted to verify the influence of operational design on queue performance at the gate by increasing the truck arrival rate in each model by 30%, 50%, and 70%. The results of each simulation scenario were recorded. The averages were presented and analyzed.
5.1. MODEL VALIDATION
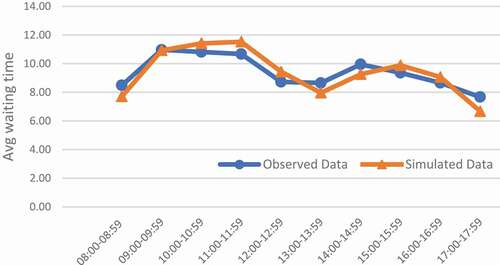
The model is thoroughly validated against historical data to ensure model validity. compares observed and simulated truck waiting times in an inbound queue. shows the two sets of data that exhibit the same fluctuating pattern. Similar practices were carried out in Shim and Kumar (Citation2010) and Islam (Citation2018). Additionally, in accordance with Chanchaichujit et al. (Citation2016)’s suggestion that model validity and reliability may be conducted by a group of industry experts, the baseline model’s simulated results were evaluated by related port operators. It can be concluded that the simulated results are certainly capable of providing realistic results. Following that, a scenario analysis is provided to investigate alternatives to improving gate operations.
Table 5. Comparisons of observed and simulated truck queueing time
Figure 6. Comparisons of observed and simulated truck queueing time
5.2. CURRENT SYSTEM WITH SENSITIVITY ANALYSIS
The current operations system (baseline model), with one service lane at the entrance and one at the exit gates is first analyzed. Arrival trucks are permitted to receive inbound service operations from the exit gate when there are more than ten inbound trucks in a queue and no truck in the outbound queue. Both the truck waiting time and the length of the queue were measured.
The baseline model simulation generates an average of 446 truck arrivals per day during peak days of the week. The sensitivity study is conducted to explore how the present model works in three distinct situations where the truck arrival rate is increased by 30%, 50%, and 70%. The average truck waiting times, maximum average truck waiting times, and average queue lengths for the three situations are shown in compared to the baseline model.
Figure 7. Baseline model with different truck arrival rates
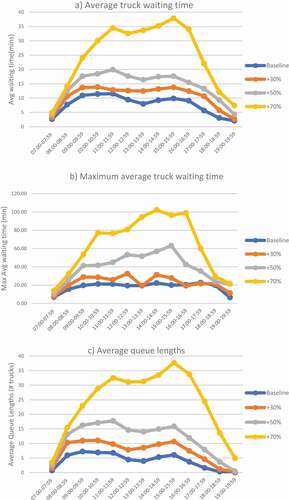
Under the current arrival rate, the average truck waiting time in an inbound queue is roughly 10–12 minutes from 9:00–12:00 am and gradually decreases until 2:00 pm. Then it rises slightly to 9–10 minutes between 2:00, 5:00 pm. The maximum average waiting time is approximately 20–23 minutes from 9:00 am to 7:00 pm. During peak hours of 9:00–12:00 am, the average queue length is about seven trucks.
When the truck arrival rate increases by 30%, the average waiting time increases to 12–14 minutes from 9:00 am to 5:00 pm, while the maximum average waiting time during these hours is roughly 26–32 minutes. Throughout the day, the average queue length increased to 9–11 trucks. The baseline model for this situation starts to encounter difficulties. With a 50% increase in arrival rate, the average waiting time rises to 18–20 minutes, with a maximum average waiting time of more than 40–63 minutes and between 15–18 trucks in queue during the day. Furthermore, when the arrival rate increases by 70%, the operations system fails to provide services. The data indicate that when the arrival rate increases by more than 30%, a change in gate operations are required.
5.3. SCENARIO ANALYSIS
To compare performance at the entrance gate, the turnaround time for each truck type is assumed to follow the previously provided distribution as the truck arrival rate increases. simulates results of the average truck waiting time (minutes) in an inbound queue for each scenario is presented on an hourly basis with an increase in truck arrival rate from current to 30%, 50%, and 70%. As illustrated in a), introducing one more entrance lane under varied situations (scenarios 3–5) significantly reduces queuing time. However, when compared to scenario 1, where the entrance gate still has only one service lane and shares the exit gate with no queue length condition, it only delivers a tiny benefit. Furthermore, scenario 2 outperforms all others. By establishing a custom station separately from gate operations, there is no need to invest in extending the entrance lanes, requiring more officers and a weighbridge. Furthermore, the results show that the waiting time for trucks requiring custom operations in both the gate and the customs station queue (S2Gate+Custom) is the same as having one extra lane.
Figure 8. Average waiting time as truck arrival rate increases
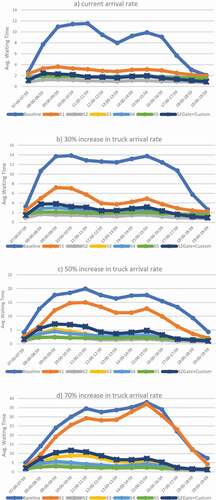
(b)-(d) show that as the truck arrival rate increases from 30% to 70%, scenario 2 produces the best or second-best result in terms of the truck waiting time at the gate. However, container-in and direct-export trucks require a custom operation, which accounts for around 86 percent of trucks entering the service lane. Therefore, comparing truck waiting times in gate and custom operations (S2Gate+Custom) to truck waiting times in other scenarios is more reasonable. According to the findings, truck waiting time in gate and customs operations is slightly longer in scenarios 2 than in scenarios 3–5. Despite the fact that incoming trucks increase by up to 50%, the average wait time in both queues: gate and customs, is less than 10 minutes. Additionally, as the arrival rate approaches 70%, the average waiting time in both queues is a little more than 10 minutes. Furthermore, when more trucks arrive at the gate, scenario 2 outperforms scenario 1 and current practice (baseline).
Next, the gate queue length in each scenario with varying truck arrival rates is examined. summarizes the findings. The current practice or the baseline model of the Songkhla port results in an average queue length of up to 7 trucks during peak hours, which would worsen as the number of incoming trucks increased. The results reveal that the average queue length would expand to between 8 and 11 trucks between 8 a.m. and 5 p.m. as the number of arrival trucks increased by 30% and that the situation would worsen as the number of trucks increased further. As previously stated, scenario 2 produces results comparable to scenarios 3–5, including the addition of one more gate lane. Despite a 50% increase in incoming trucks, the average queue length during peak hours in the second scenario is less than three trucks.
Figure 9. Average queue length as truck arrival rate increases
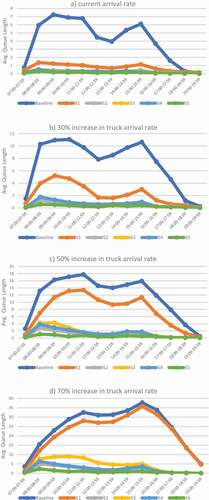
It should be noted that, as expected, scenario 5 outperforms scenarios 3–4, whereas scenarios 3–4 provide comparable outcomes. Besides, as the number of trucks increases, scenario 4 outperforms scenario 3 due to conditions on the exit gate sharing.
In scenario 2, the customs operations station is separated from gate operations, so services are faster, resulting in fewer trucks in queues. However, because 86 percent of vehicles are required to go through the customs station, this would create a queue. Following that, the custom queue length is explored, and the results are given in . With the current truck arrival rate, the average custom queue length is less than one truck. However, this length increases to 1–2 trucks and 2–3 trucks during peak hours, as the truck arrival rate increases by 30% and 50%, respectively.
Figure 10. Average queue length at the customs station
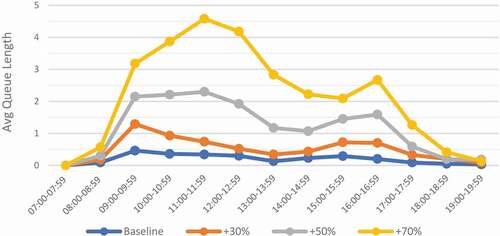
Combining the results of the discussion drawn from , it is clear that scenario 2 is a better approach that will result in a significant improvement, even though the queue performance appears to be acceptable under current practice with truck arrival rate increases to 30%. Scenario 2 yields operational performance comparable to adding one more service lane while needing less resource commitment. Most importantly, it shows that this model can function successfully even when the truck arrival rate rises to 70%.
6. CONCLUSION AND IMPLICATIONS
This study develops and analyzes a simulation model for freight traffic at the Songkhla port to explore alternatives to alleviate gate congestion. Observed data and a statistical test are used to validate the model. The simulation model was used for evaluating the effectiveness of policies and decisions relating to the management of a service system, including the expansion of gate lanes, the implementation of exit-gate sharing policies, and the redesign of work processes at the terminal gate. The impact of these policies and decisions on the number of trucks in a queue and the average and maximum waiting times is examined.
The significant finding of this study is that redesigning a work process by separating customs work from gate operations resulted in a significant decrease in queue length and truck waiting time. Even if the truck arrival rate has increased considerably, the simulation results show that this strategy provides comparable service performance to adding one additional gate lane. Moreover, from an economic standpoint, establishing a new customs station requires much less investment than adding one more service lane at the entrance gate. In addition, the benefits of this approach to system management extend beyond the investment aspect. Managing queues and assigning trucks to the exit gate under the exit-gate sharing policy may be confusing for truckers and gate operators who provide services for both inbound and outbound trucks. The separation of service lanes between inbound and outbound trucks simplifies the service system. As a result, service management would be more efficient.
In terms of managing port operations, this study provides valuable information for port authorities to better understand the impact of each policy or decision made on gate performance. As a result, it supports decision-making when deciding which service improvement strategy to employ. In addition, this study provides insights into gate congestion behaviors for current and expected increasing truck arrival rates. With this information, the port authority could see where improvements can be made to the gate operations. Furthermore, the simulation model developed in this study may be used to further examine situations under various policies or decision rules. Finally, it can be extended to analyze freight traffic congestion for the entire system, including gate operations and yard operations.
There are some limitations of this study:
This research intends to reduce gate congestion by focusing on gate operations and excluding yard operations from the analysis.
The exit-gate sharing policy model assumes that truck turnaround time follows historical turnaround time distribution. In reality, the turnaround time may follow a different pattern as the truck arrival rate increases.
It is worth mentioning that solving gate congestion by itself will not improve the port’s overall performance if yard operations fail to service appropriately.
Therefore, for future research, yard operations should be incorporated into the model to better manage freight traffic congestion throughout port operations. Additionally, because the historical service time data shows a considerable variation in gate service time, lowering this variation may improve gate performance. Thus, future research could look into the effect of fewer trucks carrying inaccurate documents on gate performance. Motono et al. (Citation2016) suggested this based on their previous research.
Disclosure Statement
No potential conflict of interest was reported by the author(s).
Additional information
Funding
Notes on contributors
Panida Chamchang
Panida Chamchang is a Senior Lecturer in Logistics Management at Walailak University in Thailand. Her research interests include Logistics and Transportation Management, as well as applications of Operational Research. Her most recent studies are concerned with congestion issues at container terminal port and airport free trade zones.
Hussen Niyomdecha is a Lecturer at the Department of Business Administration, Walailak University. His research interests are in the area of HALAL management and logistics management. He has co-authored two books and over 10 papers in journals such as Journal of Transportation and Logistics, International Journal of Business and Technopreneurship, and others.
References
- Bank of Thailand (BOT). (2020). International trade statistics. https://www.bot.or.th/English/Statistics/EconomicAndFinancial/Pages/default.aspx
- Bierwitth, C., & Meisel, F. (2010). A survey of berth allocation and quay crane scheduling problems in container terminals. European Journal of Operational Research, 202(3), 615–18. https://doi.org/https://doi.org/10.1016/j.ejor.2009.05.031
- Chanchaichujit, J., Saavedra-Rosas, J., Quaddus, M., & West, M. (2016). The use of an optimisation model to design a green supply chain: A case study of the thai rubber industry. The International Journal of Logistics Management, 27(2), 595–618. https://doi.org/https://doi.org/10.1108/IJLM-10-2013-0121
- Chen, G., Govindan, K., & Yang, Z. (2013). Managing truck arrivals with time windows to alleviate gate congestion at container terminals. International Journal of Production Economics, 141(1), 179–188. https://doi.org/https://doi.org/10.1016/j.ijpe.2012.03.033
- Chen, G., & Jiang, L. (2016). Managing customer arrivals with time windows: A case of truck arrivals at a congested container terminals. Annals of Operations Research, 244(2), 349–365. https://doi.org/https://doi.org/10.1007/s10479-016-2150-3
- Chen, X., Zhou, X., & List, G. (2011). Using time-varying tolls to optimize truck arrivals at ports. Transportation Research Part E: Logistics and Transportation Review, 47(6), 965–982. https://doi.org/https://doi.org/10.1016/j.tre.2011.04.001
- Cheong, C. Y., Tan, K. C., Liu, D. K., & Lin, C. J. (2010). Multi-objective and prioritized berth allocation in container ports. Annals of Operational Research, 180(1), 63–103. https://doi.org/https://doi.org/10.1007/s10479-008-0493-0
- Davies, P., & Principal, D. (2009, October 21-23). Container terminal reservation systems [Paper presentation]. 3rd annual METRANS national urban freight conference, Long Beach, CA, United States.
- Dekker, R., Heide, S. V., Asperen, E. V., & Ypsilantis, P. (2013). A chassis exchange terminal to reduce truck congestion at container terminals. Flexible Services and Manufacturing Journal, 25(4), 528–542. https://doi.org/https://doi.org/10.1007/s10696-012-9146-3
- Fleming, M., Huynh, N., & Xie, Y. (2013). Agent-based simulation tool for evaluating pooled queue performance at marine container terminals. Transportation Research Record, 2330(1), 103–112. https://doi.org/https://doi.org/10.3141/2330-14
- Giuliano, G., & O’Brien, T. (2007). Reducing port-related truck emissions: The terminal gate appointment system at the ports of Los Angeles and Long Beach. Transportation Research Part D, 12(7), 460–473. https://doi.org/https://doi.org/10.1016/j.trd.2007.06.004
- Guan, C., & Liu, R. (2009). Container terminal gate appointment system optimization. Maritime Economics & Logistics, 11(4), 378–398. https://doi.org/https://doi.org/10.1057/mel.2009.13
- Hyunh, N., & Walton, C. M. (2008). Robust scheduling of truck arrivals at maritime container terminals. Journal of Transportation Engineering, 134(8), 347–353. https://doi.org/https://doi.org/10.1061/(ASCE)0733-947X(2008)134:8(347)
- Islam, S. (2018). Simulation of truck arrival process at a seaport: Evaluating truck-sharing benefits for empty trips reduction. International Journal of Logistics Research and Applications, 21(1), 94–112. https://doi.org/https://doi.org/10.1080/13675567.2017.1353067
- Islam, S., & Olsen, T. (2014). Truck-sharing challenges for hinterland trucking companies: A perspective of the empty container truck trips problem. Business Process Management Journal, 20(2), 290–334. https://doi.org/https://doi.org/10.1108/BPMJ-03-2013-0042
- Le-Griffin, H., Mai, L., & Griffin, M. (2011). Impact of container chassis management practices in the United States on terminal operational efficiency: an operations and mitigation policy analysis. Research in Transportation Economics, 32(1), 90–99. https://doi.org/https://doi.org/10.1016/j.retrec.2011.06.007
- Maguire, A., Ivey, S., Lipinski, M. E., & Golias, M. M. (2010, March 11-13). Relieving congestion at inter-modal marine container terminals: Review of tactical/operational strategies [Paper presentation]. 51st Annual Transportation Research Forum, Arlington, VA, United States.
- Minh, C. C., & Hyunh, N. (2017). Optimal design of container terminal gate layout. Int. J. Shipping and Transport Logistics, 9(5), 640–650. https://doi.org/https://doi.org/10.1504/IJSTL.2017.10005707
- Morais, P., & Lord, E. (2006). Terminal Appointment System Study. Transport Canada.
- Motono, I., Furuichi, M., Ninomiya, T., Suzuki, S., & Fuse, M. (2016). Insightful observations on trailer queues at landside container terminal gates: what generates congestion at the gates?. Research in Transportation Business & Management, 19, 118–131. https://doi.org/https://doi.org/10.1016/j.rtbm.2016.04.001
- Phan, M., & Kim, K. (2016). Collaborative truck scheduling and appointments for trucking companies and container terminals. Transportation Research Part B: Methodological, 86, 37–50. https://doi.org/https://doi.org/10.1016/j.trb.2016.01.006
- Ramirez-Nafarrate, A., Gonzalez-Ramirez, R., Smith, N., Guerra-Olivares, R., & Vob, S. (2017). Impact on yard efficiency of a truck appointment system for a port terminal. Annals of Operations Research, 258(2), 195–216. https://doi.org/https://doi.org/10.1007/s10479-016-2384-0
- Sathitmon, U. (2013). Analysis of queuing system models services examine the vehicle the laem chabang port. Master Thesis Burapa University.
- Sharif, O., Huynh, N., & Vidal, J. (2011). Application of El Farol model for managing marine terminal gate congestion. Research in Transportation Economics, 32(1), 81–89. https://doi.org/https://doi.org/10.1016/j.retrec.2011.06.004
- Shim, S. J., & Kumar, A. (2010). Simulation for emergency care process reengineering in hospitals. Business Process Management Journal, 16(5), 795–805. https://doi.org/https://doi.org/10.1108/14637151011076476
- Torteeka, T. (2011). Cost analysis of queuing system for container vessel at port of Bangkok. Master Thesis Kasetsart University.
- Trunfio, R. (2011). Modeling, simulation and optimization in logistics. 4OR - A Quarterly Journal of Operations Research, 9(4), 433–436. https://doi.org/https://doi.org/10.1007/s10288-010-0139-3
- Tuntivejakul, U. (2015). Application of congestion charge to reduce congestion within Laem Chabang port. Master Thesis Burapa University.
- van Asperen, E., Borgman, B., & Dekker, R. (2013). Evaluating impact of truck announcements on container stacking efficiency. Flexible Services and Manufacturing Journal, 25(4), 543–556. https://doi.org/https://doi.org/10.1007/s10696-011-9108-1
- Zehendner, E., & Feillet, D. (2014). Benefits of a truck appointment system on the service quality of inland transport modes at a multimodal container terminal. European Journal of Operational Research, 235(2), 461–469. https://doi.org/https://doi.org/10.1016/j.ejor.2013.07.005
- Zhang, X., Zeng, Q., & Yang, Z. (2019). Optimization of truck appointments in container terminals. Maritime Economics & Logistics, 21(1), 125–145. https://doi.org/https://doi.org/10.1057/s41278-018-0105-0