
Abstract
The commercial business model has changed to electronic market channels and electronic distribution. Electronic commerce (E-commerce) and shopping online generate profits and reduce costs. Many businesses are creating new channels using digital network technology. This research explores the factors and indicators of customer satisfaction for transportation and distribution in an online shopping company. Survey research and exploratory factor analysis (EFA) is applied to analyse the data collection concerning Chinese customers in Thailand who have used the services of an online shopping company. This research tested the results for validity, reliability, and Kaiser-Meyer-Olkin (KMO) statistical approach. Factor loadings confirm the factor explanations and the common threshold of 0.7. Furthermore, customer satisfaction in transportation and the distribution management model achieves with the three main factors and fifteen key indicators. The three factors are the Responsibility of Product and delivery in transportation and distribution, customer services in transportation and distribution, and customer communication in transportation and distribution. These fifteen indicators and the information are to improve the e-commerce business model to create a competitive advantage and increase market share.
PUBLIC INTEREST STATEMENT
Business distribution has changed to electronic commerce channels effect of shopping online is essential to distribute products and services. Therefore, studying the factors and indicators of customer satisfaction for transportation and distribution in an online shopping company is critical to developing the strategic planning and transportation and distribution policy in operational planning. These are supported to improve the competitive advantage, customer loyalty and customer satisfaction.
1. Introduction
Transportation and distribution management of online shopping involves outbound logistics. The main activity in the online shopping chain mainly supports reducing the total cost of this chain and increasing customer satisfaction with online shopping (Khan et al., Citation2019; Zheng et al., Citation2020). The online shopping chain, customer, and delivery time are in the creation and implementation of developing competitive advantages. Transportation costs and inventory distribution are in strategic planning (Chang & Wang, Citation2011; Kumar & Kashyap, Citation2018). The behaviours and lifestyles of consumers in the new age are changing to the hustle and bustle of everyday life. Moreover, the traffic and travel in the city is the main reason why life for people has changed (Kazancoglu & Aydin, Citation2018; Liu et al., Citation2020). As a result, online selling through e-commerce has gained significant attention for managing to spend online.
The case study is the largest company for the 3C online shopping business platform in the B2C market in China. This company manages integrated logistics, standard delivery and third-party logistics (3PL). This case is a famous online shopping business platform in China that is the last mile delivery, which is transport to the end consumer and a direct contact process with the customer (Liu et al., Citation2021; Zheng et al., Citation2020). However, this company found case problems that need to improve in the online customer service system. These cases present in non-complete sending and the delivery of quality service.
The speed of delivery found that other platforms had better delivery speed. However, most customers do not take the time to wait for their products. Frequently, transportation and distribution take their products during the daytime when most people work. This failed delivery can lead to missing items, adding expenses to the company for paying customers. Thus, customer satisfaction factors in transportation and distribution need to improve the customer service system for online shopping to achieve market share, customer satisfaction and competitive advantages. Therefore, this research explores the factors and indicators that affect customer satisfaction in transportation and distribution for an online shopping company.
2. Literature reviews
2.1. Transportation and distribution of shopping online
Logistics and the supply chain focus on transportation and distribution activity that affects shopping online and e-commerce trade. The last mile delivery process originated in shopping online that needs to improve efficiency distribution. Furthermore, this process supports the company to continue in this market. On the other hand, online shopping involves adapting to the new retailer model, which has shown a new way of operation from physical product stores to online products. These new channels for customers are to assess buying and door-to-door delivery. The likely challenges must change the retailer’s operation and improve transportation and distribution connected on a chain.
Many researchers reviewed and studied the transportation and distribution of shopping online, according to Kennedy and Coughlan (Citation2006). Online shopping portals deliver numerous benefits to traditional retailers in terms of marketing collaboration, site traffic generation, website management, fulfilment services, and the ability to offer customers multi-channel retailing. According to Weltevreden (Citation2008), the service point is the main CDP in The Netherlands for B2C e-commerce logistics. Dutch consumers mostly use service points for repeated online orders. However, retailers operating service points may lead to additional revenue. According to Chang and Wang (Citation2011), the moderating effect of customer perceives value on online shopping behaviours, so the study of e-service quality and customer perceived value affect customer satisfaction and loyalty. This study found that customers with a high perceived value have a stronger relationship between satisfaction and customer loyalty than customers with a low perceived value.
Lim and Shiode (Citation2011) noted the impact of online shopping demand on physical distribution networks. The simulation model suggests the existing physical distribution network can improve cost efficiency and service reliability by evolving into a more centralised network structure with the increased capacity of transhipment facilities. According to Sreeram et al. (Citation2017), the factors affecting satisfaction and loyalty in online grocery shopping use an integrated model. Assortment of products was to impact perceived ease of use and usefulness significantly. The findings also highlight the importance of entertainment and economic value as key variables shaping the buyer’s satisfaction and purchase loyalty behaviours.
Zissis et al. (Citation2018) showed collaboration in the urban distribution of online grocery orders. The integration of these three data sets serves as input to vehicle routing models that reveal the benefits of cooperation by solving the individual distribution problems of two retailers first, followed by the joint distribution problem under a single decision-maker assumption. According to Khan et al. (Citation2019), an assessment of e-service quality, e-satisfaction and e-loyalty indicates that all of the first latent constructs are significant where E-CS and E-CL (dependent variables) are by E-SQ (independent variable). Using SEM, the statistically-fit structural model was developed based on confirmatory factor analysis. The analysis shows that there is a strong positive relation between E-SQ and E-CS, and E-SQ and E-CL
2.2. Customer satisfaction factors in transportation and distribution of shopping online company
In the previous research, an assessment of customer satisfaction factors in transportation and distribution of an online shopping company found the customer satisfaction indicators of transportation and distribution management. The documentary analysis uses to analyse the data for developing customer satisfaction indicators in transportation and distribution (Qin & Muangpan, Citation2021). A literature review of transportation and distribution concepts, satisfaction elevation, measurement of service quality and e-commerce were the concepts included and analysed using content analysis. These indicators conduct for the customer satisfaction factors in transportation and distribution of shopping online, as shown in .
Table 1. Customer satisfaction indicators in transportation and distribution of shopping online
3. Methodology
3.1. Research design and population
Survey research was to collect data sampling from the population. The research framework was in two phases. In the first phase, the content analysis evaluates and develops the customer satisfaction indicators in transportation and distribution of shopping online using a literature review approach in previous research. For the second phase of this research, exploratory factor analysis (EFA) was to these indicators, which analysed the common factor model of the customer satisfaction transportation and distribution of shopping online.
The population in this study comprised Chinese customers in Thailand who have used services used as a case study of an online shopping company. Based on the number of Chinese nationals in Thailand that comprised 24,703 respondents in October 2020, probability sampling was selected using a simple random sampling method. The sample size included 394 respondents in this study, with a determination of 95% and an error of 5%, which calculated the sample size from Taro Yamane’s computational formula (Taro Yamane, Citation1967).
3.2. Data and reliability analysis
Exploratory factor analysis (EFA) was to analyse the data collection. EFA was for the underlying structure of a relatively large set of indicators. The Kaiser-Meyer-Olkin (KMO) test examined the appropriate analysis according to data, in which KMO values should be more than 0.5 and Bartlett’s test of significance (P < 0.001) was confirmed. Factor loadings should accept the common above 0.7 (70%) in general; factor loadings are like correlation coefficients (in that they can vary from −1 to 1; O’Driscoll, Citation2012; Maskey et al., Citation2018). However, Factor loadings should have the minimum acceptable level of 0.4 (Hair et al., Citation2006)
3.3. Data collection
A 5-scale rating questionnaire was applied in data collection to find the critical opinions of respondents. The questionnaire is by the validity and reliability approach. These questionnaires inquired about the key customer satisfaction factors in transportation and distribution of shopping online: a case study. Two sections were the general customer questionnaire (7 items) and fifteen key indicators of customer satisfaction in transportation and distribution (15 items)
There were 394 respondents from Chinese customers in Thailand who have used the services. They comprised a case study of an online shopping company. Most respondents were women, 57%, and 46.5% were between 21–40 years old. Respondents with bachelor’s degrees totalled 53.75%, and 72.75% were office workers. Experience in online shopping showed that 42% had 2–10 years and 41.5% had 5–10 years. Accounting for 54.5% of online shopping, 3–5 times and 40% of online shopping payments per month was 200 − 500 Yuan.
4. Finding and discussion
The results of this research are in two sections, including exploratory factor analysis (EFA) results and a conceptual model of customer satisfaction in transportation and distribution management. This first section showed the effects of correlation analysis (), variance and cumulative percentage (), loadings of indicators analysis (), and measurement model, which approaches the first-order factor measurement model for customer satisfaction in transportation and distribution (). This second section shows the business management model for shopping online to improve customer satisfaction in transportation and distribution operations; the key factors and indicators can achieve competitive advantages to enhance market share, profit and customer loyalty.
Figure 1. First-order factor measurement model for customer satisfaction in transportation and distribution.
Table 2. The results of Kaiser-Meyer-Olkin statistic (KMO) and p-value
Table 3. The results of variance and cumulative percentage of factors
Table 4. The results of loadings of indicators of three factors
4.1. Exploratory factor analysis (EFA) results
Correlation analysis was to assess factor analysis. All indicators of each factor explore the relationship among them. Pearson correlation coefficient was significant (p < 0.05), while the Kaiser-Meyer-Olkin (KMO) examination value was 0.932 with a p-value of 0.000, as shown in . These results showed all indicators were significantly related to each other. Thus, the principal component method for these factors was to investigate the direction to group the related indicators into factors.
The cumulative percentage clarifies the variance that spreads over three factors. The cumulative variance was 99.345%, which existed in a high cumulative rate to achieve an acceptable fit. Therefore, the results shown in are to explain three factors. Factor 1 and factor 2 represent the high variance percentages of 36.338% and 36.121%, corresponding to factor 3, which showed a variance of 26.887%.
The measurement model for customer satisfaction in transportation and distribution surveyed exploratory factor analysis with principal component extraction and the varimax rotation. Factor evaluation presented three factors and indicator loadings that signified the correlation of indicators to factors. These high-value loadings are in ; all loadings acceptation was more significant than 0.7 (O’Driscoll, Citation2012; Muangpan et al., Citation2019). Therefore, these indicators were approved and well-correlated with the common factors. For example, the PD1-PD6 indicators are to the same latent as factor 1 (PD-TD), CS1-CS6 to latent factor 2 (CS-TD), and CC1-CC3 to latent factor 3 (PT-TD).
4.2. Managing customer satisfaction in transportation and distribution
Customer satisfaction in transportation and distribution is the critical business factor to improve customer service levels and grow competition in transportation and distribution, cost-effective and high profits, customer loyalty and brand popularity. The management of customer satisfaction in transportation and distribution contains three factors to drive the customer satisfaction operation, including Responsibility for Product and delivery in transportation and distribution factor (PD-TD), Customer services in transportation and distribution (CS-TD), and Customer communication in transportation and distribution (CC-TD). A total of fifteen indicators explain the operation of transportation and distribution management for an online shopping company, as shown in .
Figure 2. Customer satisfaction in transportation and distribution management.
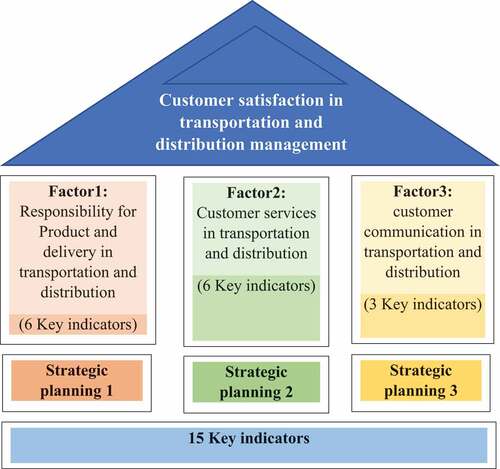
The first factor is the Responsibility of Product and delivery in the transportation and distribution factor, which relates to the transportation systems operating for product delivery, product stock levels, and delivery times. These are planning routes and load scheduling for delivery to ensure they deliver within the agreed terms. The main direction of transportation activities develops customer satisfaction, transportation relationships and monitoring transport costs. This factor indicates by six key indicators, including Product delivery fast and punctual (PD1), Product arrival at the scheduled time (PD2), Product correct delivery (PD3), Product good packaging delivery (PTD4), Carrier personality on delivery (PD5), and Follow-up delivery on customer requests (PD6). The online shopping company can achieve these indicators by completing satisfaction responsibility in transportation and distribution operations, thus increasing product flow and sustainability in business through many positive side effects for a company (Nogueira et al., Citation2021; Sreeram et al., Citation2017).
Strategic planning 1 begins with three critical assessments. The first analysis is to specify the transportation and distribution of employees with the customer. The second analysis evaluates the transportation and distribution systems for the operation. The third analysis estimates the control of following with the customers. The transportation and distribution strategy selection must consider market conditions and competition in the business. For example, the strategics suggest the third-party service strategy and the drop-shipping arrangement strategy to improve the transportation and distribution operation.
The second factor is the customer services in transportation and distribution factor, which displays the transportation services level to manage the service actions following customer needs and customer satisfaction. Guiding customer services in transportation and distribution improves customer satisfaction, indicating six key indicators. These include Exchanged Product on delivery (CS1), Customer information safety on delivery (CS2), Arrange Product a delivery time (CS3), Convenience of return product delivery (CS4), Extra services delivery (CS5), and Last communication to the customer on delivery (CS6). The online shopping company can accomplish these indicators to gain many benefits with higher customer service, extra services offered, and post-sales service provided (Chang & Wang, Citation2011; Chiang, Citation2012; Yu et al., Citation2020). These critical strategy operations help to improve costs and profit efficiency to support the more substantial strategic aspect of factor 2 that develops competitive advantages for high-level customer services in transportation and distribution.
Strategic planning 2 achieves the high-service level strategy by setting smart service goals and these indicators to monitor the feedback loop of the customer services in transportation and distribution. For example, the business strategy can be to create a customer service team of transportation and distribution that improve the professionals’ training and right-up skills. The expectation service responds in transportation and distribution with a Quick response strategy (QRS) and Real-time strategy. Furthermore, Extra services delivery (CS5) is an exciting indicator for creating the differentiation strategy to consider increasing customer satisfaction and competitive advantage. This indicator focused on the optional services, special delivery services, and delivery options.
For the third factor, customer communication in transportation and distribution improves the satisfaction of outbound communications, which comprises the continuing interchange between a company and its customers. Three key indicators are shown, including Picking up products delivering door to door (CC1), Informing customers before delivery (CC2), and Product tracking on delivery (CC3). These key indicators define the strategy creation for better performance of multi-channel and highly personalised communications, and intelligent communications enabled (Janjevic & Winkenbach, Citation2020; Nogueira et al., Citation2021).
Business strategy of this factor improves with the customer relationship through the strategic management platforms of customer relationship management (CRM) and Multi-channel distribution system. Strategic planning 3 adds value by understanding business objectives and finding transportation and distribution platform tools. The strategic value of factor 3 supports factors 1 and 2 to focus on the specific requirements of customers and more relevant communications for qualifying better up-selling and cross-selling.
5. Conclusion
5.1. Theoretical implications
Customer satisfaction in transportation and distribution management offers three factors and fifteen-item measurement indicators for assessing customer satisfaction in transportation and distribution performance. The observed results recommend fifteen measurement indicators that explain the three factors: Responsibility in transportation and distribution, Customer services in transportation and distribution, and Customer communication in transportation and distribution. This factor model exhibited an excellent fit for all indicators examined and could measure customer satisfaction in transportation and distribution performance by increasing online transport utilisation with market development and service level.
5.2. Managerial implications
The guideline management of customer satisfaction increases focuses on the main activity of satisfaction creation for achieving higher competitive advantages and customer loyalty to a brand for an online company (Shi et al., Citation2019). Therefore, foundation main factors 1 and 2 must achieve satisfaction creation in transportation and distribution performance, while factor 3 is essential to achieve added satisfaction in transportation and distribution performance. Thus, businesses must consider three factors, fifteen indicators and strategic planning for transportation and distribution policy and operational planning for improving the efficiency of transportation services for customers and competitive advantage, creating.
5.3. Limitations and perspectives
This research focused on key factors and indicators of customer satisfaction in transportation and distribution that target to find these indicators for increasing customer satisfaction efficiency and strategic planning for preparing operational plans in the next step. This study found the principal customer demographic of Chinese customers in Thailand. The main customers are women sex, between 21–40 years old, and most are office workers but do not analyse key factors and indicators with the customer segmentation. Future research will find the relationships between critical factors and indicators with other business factors. Moreover, the customer segmentation will analyse the key factors and indicators for creating the best value-added and customer satisfaction practices.
Disclosure statement
No potential conflict of interest was reported by the author(s).
Additional information
Funding
Notes on contributors

Thanyaphat Muangpan
Thanyaphat Muangpan is a lecturer (Assistant Professor) at the Faculty of Logistics, Burapha University in Thailand. She graduated with PhD in Logistics and Supply Chain Management and received Postdoctoral Fellowship. Her research experience in performance measurement, business strategies and sustainable development. The research study focuses on transportation management, logistics and supply chain management.
References
- Chang, H. H., & Wang, H. W. (2011). The moderating effect of customer perceived value on online shopping behaviour. Online Information Review, 35(3), 333–13. https://doi.org/10.1108/14684521111151414
- Chiang, W. Y. (2012). To establish online shoppers’ markets and rules for dynamic CRM systems An empirical case study in Taiwan. Internet Research, 22(5), 613–625. https://doi.org/10.1108/10662241211271572
- Hair, J. F., Black, W. C., Babin, B. J., Anderson, R. E., & Tatham, R. (2006). Multivariate data analysis ( 6th ed.). Upper Saddle River, NJ: Pearson University Press.
- Janjevic, M., & Winkenbach, M. (2020). Characterising urban last-mile distribution strategies in mature and emerging e-commerce markets. Transportation Research Part A, 133, 164–196. https://doi.org/10.1016/j.tra.2020.01.003
- Kazancoglu, I., & Aydin, H. (2018). An investigation of consumers’ purchase intentions towards omni-channel shopping A qualitative exploratory study. International Journal of Retail & Distribution Management, 46(10), 959–976. https://doi.org/10.1108/IJRDM-04-2018-0074
- Kennedy, A., & Coughlan, J. (2006). Online shopping portals: An option for traditional retailers? International Journal of Retail & Distribution Management, 34(7), 516–528. https://doi.org/10.1108/09590550610673590
- Khan, M. A., Zubair, S. S., & Malik, M. (2019). An assessment of e-service quality, e - satisfaction and e-loyalty Case of online shopping in Pakistan. South Asian Journal of Business Studies, 8(3), 283–302. https://doi.org/10.1108/SAJBS-01-2019-0016
- Kumar, A., & Kashyap, A. K. (2018). Leveraging utilitarian perspective of online shopping to motivate online shoppers. International Journal of Retail & Distribution Management, 46(3), 247–263. https://doi.org/10.1108/IJRDM-08-2017-0161
- Lim, H., & Shiode, N. (2011). The impact of online shopping demand on physical distribution networks: A simulation approach. International Journal of Physical Distribution & Logistics Management, 41(8), 732–749. https://doi.org/10.1108/09600031111166401
- Liu, M., Zhang, Q., Gao, S., & Huang, J. (2020). The spatial aggregation of rural e-commerce in China: An empirical investigation into Taobao Villages. Journal of Rural Studies, 80, 403–417. https://doi.org/10.1016/j.jrurstud.2020.10.016
- Liu, M., Min, S., Ma, W., & Liu, T. (2021). The adoption and impact of E-commerce in rural China: Application of an endogenous switching regression model. Journal of Rural Studies, 83, 106–116. https://doi.org/10.1016/j.jrurstud.2021.02.021
- Maskey, R., Fei, J., & Nguyen, H. O. (2018). Use of exploratory factor analysis in maritime research. The Asian Journal of Shipping and Logistics, 34(2), 91–111. https://doi.org/10.1016/j.ajsl.2018.06.006
- Mentzer, J. T., Gomes, R., & Krapfel, R. E. (1989). Physical distribution service: A fundamental marketing concept? Journal of the Academy of Marketing Science, 17(1), 53–62.
- Morganosky, M. A., & Cude, B. J. (2000). Consumer response to online grocery shopping. International Journal of Retail & Distribution Management, 28(1), 17–26. https://doi.org/10.1108/09590550010306737
- Muangpan, T., & Suthiwartnarueput, K. (2019). Key performance indicators of sustainable port: Case study of the eastern economic corridor in Thailand. Cogent Business & Management, 6(1), 1–18.
- Nogueira, G. P. M., Rangel, J. J. A., & Shimoda, E. (2021). Sustainable last-mile distribution in B2C e-commerce: Do consumers really care? Cleaner and Responsible Consumption, 3, 1–9. https://doi.org/10.1016/j.clrc.2021.100021
- O’Driscoll, F. (2012). What matters most: An exploratory multivariate study of satisfaction among first year hotel/hospitality management students. Quality Assurance in Education, 20(3), 237–258. https://doi.org/10.1108/09684881211240303
- Qin, Y., & Muangpan, T. (2021). Assessment of customer satisfaction factors in transportation and distribution: A case study of Jing Dong company. Academic Journal of Graduate School Sripatum University, 18(1), 169–181.
- Shi, H., Sun, L., Teng, Y., & Hu, X. (2019). An online intelligent vehicle routing and scheduling approach for B2C e-commerce urban logistics distribution. Procedia Computer Science, 159, 2533–2542. https://doi.org/10.1016/j.procs.2019.09.428
- Shun, W. J., & Niu Zhi Hua. (2018). The Third-Party Logistics Service Quality Evaluation System Based on Customer Satisfaction. Logistics Engineering and Management, 6, 17–19.
- Sreeram, A., Kesharwani, A., & Desai, S. (2017). Factors affecting satisfaction and loyalty in online grocery shopping: An integrated model. Journal of Indian Business Research, 9(2), 107–132. https://doi.org/10.1108/JIBR-01-2016-0001
- Weltevreden, J. W. J. (2008). B2c e-commerce logistics: The rise of collection-and-delivery points in The Netherlands. International Journal of Retail & Distribution Management, 36(8), 638–660. https://doi.org/10.1108/09590550810883487
- Yamane, T. (1967). Statistics, An IntroductoryAnalysis, 2nd Ed., New York: Harper and Row.
- Yu, R. C. (2010). Research on Service Quality Evaluation of E-commerce Oriented Distribution Center. Journal of Harbin University of Commerce (Natural Sciences Edition), 26(6), 718–722.
- Yu, Y., Yu, C., Xu, G., Zhong, R. Y., & Huang, G. Q. (2020). An operation synchronisation model for distribution center in E-commerce logistics service. Advanced Engineering Informatics, 43, 1–12. https://doi.org/10.1016/j.aei.2019.101014
- Zheng, Q., Chen, J., Zhang, R., & Wang, H. H. (2020). What factors affect Chinese consumers’ online grocery shopping? Product attributes e-vendor characteristics and consumer perceptions. China Agricultural Economic Review, 12(2), 193–213. https://doi.org/10.1108/CAER-09-2018-0201
- Zissis, D., Aktas, E., & Bourlakis, M. (2018). Collaboration in urban distribution of online grocery orders. The International Journal of Logistics Management, 29(4), 1196–1214. https://doi.org/10.1108/IJLM-11-2017-0303