?Mathematical formulae have been encoded as MathML and are displayed in this HTML version using MathJax in order to improve their display. Uncheck the box to turn MathJax off. This feature requires Javascript. Click on a formula to zoom.
Abstract
This paper investigates the co-movement between cryptocurrencies and African stock returns to uncover their degree of association and global portfolio diversification benefits implementing the three-dimensional continuous Morlet wavelet transform technique. Data span 10 August 2015 to 10 December 2021 at daily frequency. The results suggest high degrees of co-movement between the asset markets at medium and lower frequencies implying that stock markets in Africa are highly exposed to cryptocurrency market disruptions from the medium term and that international investors seeking to hedge their price risk in African stock markets using cryptocurrencies may have to look at the short term. The phase difference arrow vectors implying lead (lag) effects are time-varying and heterogeneous showing no particular cryptocurrency or stock market as leader or follower. Different markets have the potential to lead or lag other markets at varying scales which may induce arbitrage opportunities for international and local investors. Our findings provide insights for policymakers, regulators and international investors as an economy’s monetary policy can be affected by the connections between the domestic capital market and other markets globally.
PUBLIC INTEREST STATEMENT
Recent studies on the valuable role of cryptocurrencies in portfolio diversification and risk management for advanced stock indices highlight no or weak connection between the markets, which provides hedging and diversification benefits for global equity investors. What is lacking in the literature is whether a similar relationship holds for African stocks. Even though the African stock market is opened to both domestic and international investors, the relationship between African stocks and cryptocurrencies remains unexplored. From a macroeconomic perspective, there are reasons to believe that the behaviour of cryptocurrencies may vary internationally as studies have document independence of cryptocurrencies in monetary policy. This motivate an investigation into the behaviour of cryptocurrencies relative to African stock markets as monetary policy uncertainty is country-specific. From an economic development perspective, overexposure to cryptocurrencies can reduce the “depth” and “width” of national stock markets, as the excessive volatility of cryptocurrency prices translates into riskier and more expensive equity financing for local firms.
1. Introduction
The investigation into the co-movement of assets returns is a crucial topic in finance as it has significant implications for risk management, asset pricing and allocation, and policy formulation (Marashdeh & Shrestha, Citation2010). A substantial body of literature has emerged on the co-movement of African stock markets with global stock markets and other markets such as foreign exchange and commodity markets following the seminal works of Grubel (Citation1968), Johansen (Citation1998), and Engle and Granger (Citation1987) on international portfolio diversification benefits and inter-market linkages. One strand of the literature on African stock markets focused on the co-movement between African equity markets and the advanced stock markets and evidence show a low level of association between the markets (Alagidede et al., Citation2011; Mensah & Alagidede, Citation2017). Another strand of the literature document studies that modelled the returns of African stocks and global commodities (Mongal & Eita, Citation2014; Peltomäki et al., Citation2017;). The evidence emerging from such studies highlights both weak and strong connections among the markets. In terms of an attempt to model the returns of African stocks with respect to exchange rates, some studies have made significant strides and reported conflicting and inconclusive results (Mlambo et al., Citation2013; Sibanda, Citation2015).
With specific regards to cryptocurrency markets, studies have examined the connection between cryptocurrencies and advanced stock markets and highlight no or weak connection between the markets (Brière et al., Citation2015; Corbet et al., Citation2018; Huynh, Citation2019; Trabelsi, Citation2018; Ünvana, Citation2019; Yaya et al., Citation2018; Yousaf et al., Citation2021). However, the dynamic connection between cryptocurrencies and African stock returns are yet to be explored. Cryptocurrencies are valid economic phenomenon which need increasing attention due to their dual impactFootnote1 on the economy. These digital currencies operate via the Blockchain technology and can be sent to anyone at any-time with virtually zero cost depending on country-specific restrictions. They have no physical representation, and no association with higher authority (Huynh, Citation2019; Yaya et al., Citation2018). Uncovering the relationship between cryptocurrencies and African stocks returns can enable stock investors in Africa to enhance the efficiency of their portfolios. Notably, different stock markets exhibit different characteristics in terms of liquidity, efficiency, and co-movement with other markets and African stock markets have been evidenced to have weak connection with global stock markets (Agyei-Ampomah, Citation2008; Emenalo, Citation2009; Mensah & Alagidede, Citation2017; Peltomäki et al., Citation2017). The work of Bouri et al. (Citation2018) also notes that the state of an economy’s stock market determines its relationship with cryptocurrencies. Therefore, we cannot assume that the relationship between cryptocurrencies and global stock indices apply to emerging and frontier stock markets in Africa.
From a methodological perspective, prior studies employed models that assumed homogeneity in trading by market participants despite the multiscale nature of relationships in financial markets (i.e., relationships are dynamic and changes across time and frequencies). From the foregoing discussion, there is motivation to model the returns of seven large cryptocurrencies and eight major African stock indices and explore their co-movement in a time-frequency domain. For African economies to benefit from such an international portfolio diversification and investment flows, there is a need to understand the nature and extent of co-movement between its stock markets and the cryptocurrency markets. This has implications for portfolio selection and regulatory authorities’ design of regulations on market inter-linkages. We contribute to the limited literature on cryptocurrencies and stock markets associations by examining the co-movement between cryptocurrencies and African stock returns adopting a multiscale approach of analysis proposed by Morlet et al. (Citation1982), the continuous Morlet wavelet transformFootnote2. The method permits bivariate correlations and cross-correlations of asset markets at different time scales which is more indicative of financial markets behaviour.
The outcome of our study suggests that cryptocurrencies and African stock markets are highly correlated at medium and lower frequencies inferring hedging and diversification opportunities in the short term. This finding generally indicates that most stock markets in Africa are extremely vulnerable to discrepancies in the cryptocurrency market from the medium term and that international investors seeking to hedge their price risk in African stock markets using cryptocurrencies may have to look at the short-time horizon. The results from the lead (lag) association of the markets show that there is no particular cryptocurrency or stock market leader or follower, different markets have the potential to lead or lag other markets at varying scales. This suggests that the returns of any of the asset markets under consideration can drive price changes in the other markets.
The remainders of the study are structured as follows. Section 2 presents the literature review. Section 3 covers a description of the methodology. Section 4 describes the data and statistical properties. Section 5 captures the results and discussion on co-movement of the markets and section 6 delineates the conclusion and policy implications.
2. Literature review
The literature review seeks to assess the past and current status of the specific areas of interests of associations between cryptocurrencies and African stocks returns.
2.1. Theoretical literature
The theoretical literature navigates towards the theoretical framework postulated for this study.
2.1.1. Time-varying contagion
There is no agreement in literature on exact definition of what constitutes contagion and how we should measure it. However, Forbes and Rigobon (Citation2002) generally define contagion as an increase in financial market co-movement after the occurrence of an event in one market and interdependent as an increase in financial market correlations when there are no crises. The major distinction when defining contagion is between pure contagion and fundamental-based contagion (Dornbusch et al., Citation2000). Gallegati (Citation2012) notes that drawing a distinction between normal and “excessive” co-movements across financial markets is a key issue in testing for contagion. A simple and intuitive way of distinguishing between pure contagion and fundamental-based contagion is by adopting a frequency domain framework such as the wavelet transformFootnote3. This paper explores contagion in the co-movement of cryptocurrency returns and African stock returns using wavelet technique. The ability of wavelets technique to capture time-varying contagion lies in simultaneously allowing for co-movement assessment at frequency levels and across time (referred to as multiple time-scales) which is an innovative way to explore the intricate subtleties of financial time series (Bekiros & Marcellino, Citation2013). In this study, strong wavelet coherence at higher frequencies is designated as contagion, and strong wavelet coherence at the lower frequencies are termed as interdependence as used by (see Chalid et al., Citation2022; Saiti et al., Citation2016; Vincent & Bertrand, Citation2005). Although time-varying contagion has been studied in other financial markets, the same of cryptocurrency and African stock markets have not been attempted, and this study is the first of its kind.
2.1.2. Fundamentals-based and category-based theories on co-movement
The fundamentals-based theory on co-movement by Barberis, Shleifer and Wurgler (Citation2005) argues that the co-movement in asset returns is as a result of co-movement in news about fundamental values. Under the fundamental view, correlated changes in rationally expected cashflows cause correlations in returns which in turn cause discount rates to be correlated when news about risk aversion or interest rate affect discount rates at the same time. The category-based theory on co-movement indicates that the fundamentals-based theory is not the only determinant of co-movement in asset returns but that co-movement can also be caused by investors trading patterns. Barberis et al. (Citation2005) contends that many investors first of all group assets into categories based on some characteristic when making their portfolios and then allocate funds at the level of the categories rather than at the level of individual securities. Specifically, institutional investors are more attracted to investment in categories (e.g., stocks, bonds, gold, exchange rates, oil, cryptocurrencies). This makes the allocation of funds to a portfolio simple and provides a consistent and simplified way of evaluating the performance of a portfolio by fund managers. The current study tests the fundamentals-based and the category-based co-movement theories in asset returns in the cryptocurrency and African stock markets integration across time.
2.2. Empirical literature
The empirical studies on cryptocurrencies in recent years are focused on the addition of cryptocurrencies to a portfolio with traditional assets. Studies have examined the association between cryptocurrencies and stock markets focusing on Bitcoin and advanced stock markets. For instance, Yousaf and Ali (Citation2021) study the return and volatility spillovers between S&P 500 and cryptocurrencies during the pre-COVID-19 period and COVID-19 period using the VAR–BEKK–AGARCH model and finds that the return and volatility spillovers between the US stock and cryptocurrency markets are not significant during the pre-COVID period. Brière et al. (Citation2015) analyze the portfolio diversification benefits of Bitcoin by employing the mean-variance spanning test and weekly data on both traditional assets (global stocks, bonds, currencies) and alternative investments (real estate, hedge funds, and commodities). The findings show a weak correlation between Bitcoin and the other assets classes and that investing in Bitcoin offers significant diversification benefits. Baur et al. (Citation2018) investigate whether Bitcoin is a medium of exchange or an asset. The authors applied regression analysis to daily data for the period of July 2010 to June 2015. The findings show that Bitcoin is uncorrelated with traditional asset classes such as stocks (proxied with the S&P 500), commodities, and bonds both in periods of financial crises and normal times. Using time and frequency domains technique, Corbet et al. (Citation2018) employ the generalized variance decomposition method by Diebold and Yilmaz (Citation2012) to scrutinize the association between financial assets, such as stocks and commodities, and three cryptocurrencies using daily data for the period 2013 to 2017. This study reports that cryptocurrencies are isolated from the traditional assets, therefore in the short investment horizon, cryptocurrencies may offer diversification benefits to investors.
Using spillover index technique, Trabelsi (Citation2018) studied the interconnectedness within cryptocurrency and traditional assets (global stock market indices, currencies, and commodities) markets. The findings show that financial market and cryptocurrency market are connected but have no major spillover effects. Ciaian et al. (Citation2018) employ ARDL to explore the relationship between 17 virtual currencies, including Bitcoin and control for crude oil price, stock market index, interest rate, gold, and exchange rate. The findings show that shocks in Bitcoin price impact 15 altcoins and in the long-run, Bitcoin, and four altcoin prices cointegrate. Investigating the cross-correlation of the cryptocurrency market with Dow Jones Industrial Average, Zhang, Wang, Li, and Shen (Citation2018) apply the generalized multifractal detrended fluctuation analysis (MF-DFA), and multifractal detrended cross-correlation analysis (MF-DCCA) to daily data between April 2013 and January 2018. Results show persistent cross-correlation between the variables. Aaltonen et al. (Citation2017) explored the relations between the US stock market and cryptocurrencies applying least squares, correlation, and orthogonalized impulse response functions. Results show insignificant relations between US equity and the cryptocurrency market.
The study of Al-Yahyaee et al. (Citation2018) employ MF-DFA technique to investigate the efficiency of Bitcoin relative to stocks, gold and currency markets. The findings of the study show that Bitcoin markets multifractality and long-memory feature was stronger and that Bitcoin is inefficient more than currency, gold, and stock markets. Liu and Tsyvinski (Citation2021) explore the risk and return of Bitcoin, Ethereum, and Ripple, compared to precious metals, stocks, and currencies using daily data. The results of the study show that cryptocurrencies are not exposed to fiat currencies, commodities and stock market risk. Jarnstrom et al. (Citation2018) scrutinize the association among stock market, twitter sentiment, and the cryptocurrency market using data analytics life cycle and Socratic questioning technique. The findings show inverse connection among the variables. Klabbers (Citation2017) employ Monte Carlo Simulation together with mean variance framework to explore the safe haven and hedging attributes of Bitcoin for global market portfolio consisting of stock indexes (FTSE, S&P 500, DAX, MSCI world, Nikkei, Shanghai A share), bond indexes (European, American, Asian), real estate, and commodity index. Results show Bitcoin as an inefficient hedge and diversifier for the traditional assets.
In another dimension, Ünvana (Citation2019) explores the effects of Bitcoin on Japan (Nikkei 225), Turkey (BIST 100 index), USA (S&P 500), and China (SSE 380) stock markets using value-at-risk and causality analysis. The study employs weekly data for the period January 2016 to December 2018 and findings show bidirectional causal relations between Bitcoin and BIST100 but unidirectional causal linkages among Nikkei225, SSE380, and S&P500. Brière et al. (Citation2015) study the portfolio diversification properties of Bitcoin for traditional assets, including global stocks using weekly data from 2010 to 2013. Their study shows that Bitcoin is lowly connected with conventional assets. Their spanning tests evidence Bitcoin as a diversifier to the traditional assets.
Bouri, Shahzad, and Roubaud (Citation2019) studied the safe-haven and hedging characteristics of eight virtual currencies against ten developed equity sectors and the S&P 500. The authors make use of the cross-quantilogram approach and report that Monero and Litecoin exhibit safe-havens properties for selected stocks and the aggregate US stock index while Bitcoin, Steller, and Ripple have safe-haven characteristics for all US equity indices. The study reports Das, Ethereum, and Nem, to be hedges for a few equity sectors. In another study, Kurkaa (Citation2019) uses volatility spillovers framework to examine the nature of shock transmissions among stocks, commodities, financials, foreign exchange, and Bitcoin. This study reports that Bitcoin can be a hedge to the traditional assets because of its low correlation with the assets. The study also reports a spillover from Bitcoins market disruptions to the conventional assets market.
Following the literature above, recent studies on the valuable role of cryptocurrencies, mostly Bitcoin, in portfolio diversification and risk management for advanced stock indices highlight no or weak connection between the markets, which provides hedging and diversification benefits for global equity investors. What is lacking in the literature is whether a similar relationship holds for African stocks. Even though the African stock market is opened to both domestic and international investors, the relationship between African stocks and cryptocurrencies remains unexplored. From a macroeconomic perspective, there are reasons to believe that the behaviour of cryptocurrencies may vary internationally as studies including Wang et al. (Citation2019), Wu et al. (Citation2019), and Fang et al. (Citation2019) document independence of cryptocurrencies in monetary policy. These studies motivate an investigation into the behaviour of cryptocurrencies relative to African stock market as monetary policy uncertainty is country-specific. From an economic development perspective, overexposure to cryptocurrencies can reduce the “depth” and “width” of national stock markets, as the excessive volatility of cryptocurrency prices translates into riskier and more expensive equity financing for local firms.
3. Methodology
The empirical literature on inter-market linkages between cryptocurrencies and stock market returns have documented estimation techniques including mean-variance spanning test, spillover index, and multifractal detrended cross-correlation analysis (see Wang et al., Citation2019; Kurka, 2019). The continuous Morlet wavelet transform (CMWT) proposed by Morlet et al. (Citation1982) has been chosen for this study owing to its pairwise time-scale decomposition properties which can examine the bivariate co-movement of the asset markets across time and frequencies.
3.1. Continuous Morlet Wavelet Transform (CMWT)
The Continuous Morlet Wavelet Transform (CMWT) by Morlet et al. (Citation1982) is used to study the co-movement of asset markets by determining the wavelet power spectrum and wavelet coherence of two signals. According to Grinsted et al. (Citation2004), the CMWT allows isolation and identification of periodic signals between localization of time and frequency. The estimates of wavelet coherence, wavelet cross-correlation, and wavelet variance, which allow co-movement in the state of space is principal to the study.
In and Kim (Citation2013), define CWMT as the integral over time of the product of signal and scaled, shifted versions of the wavelet function :
The CMWT results are several wavelet coefficients C, which are scale and position functions and can contain different values time series . Gabor (Citation1946), Grossman and Morlet (Citation1984), Burrus et al. (Citation1998) define the CMWT for two continuous variables as:
The Morlet wavelet can be simplified as
where, is a non-dimensional “time” parameter.
According to Boako and Alagidede (Citation2016), to study co-movement between two variables, a finer version of wavelet coherence, is obtained from cross-wavelet, wavelet power spectrum, and phase difference. The bivariate cross-wavelet transform of and defined by Torrence and Compo (Citation1998) can be written as:
Where and is the respective wavelet transforms which translate the Fourier co- and quadrature-spectra into frequency-time domain (Roesch & Schmidbauer, Citation2014). In line with Veleda et al. (Citation2012), the wavelet power spectrum describes the local covariance between two time series which is specified as:
where is the frequency and is the time. The wavelet power spectrum is challenged with regard to assessing the degree of integration of the two series which is solved by wavelet coherency (Roesch & Schmidbauer, Citation2014). As noted by Torrence and Webster (Citation1999), the wavelet coherence is the local correlation coefficient in the time-frequency space similar to the traditional correlation coefficient. We specify the wavelet coherence of two time series
and
as:
where is a smoothing operator. Wavelet coherence between two time series close to one indicates high associations between the series, whereas coherence close to zero depicts no association between the series (see Ftiti et al., Citation2015; Madaleno & Pinho, Citation2010a, Citation2010b; Uddin et al., Citation2013).
Torrence and Compo (Citation1998); Madaleno and Pinho (Citation2012) define the wavelet phase which shows lead (lag) associations between two time series at different frequencies as:
Two series are in-phase (out of phase) when an absolute value of less (greater) than
and refers to the instantaneous time as time origin and at the frequency under consideration, whereas the arrows of the phase exhibit which series is the leading one in the relationship.
4. Data description and statistical properties
The paper focuses on seven large cryptocurrencies (Bitcoin, Ethereum, Litecoin, Das, Ripple, Steller, and Monero) and eight African stock indices (Egypt, South Africa, Nigeria, Mauritius, Kenya, Ghana, Tunisia, and Morocco) to achieve the set objective. The cryptocurrencies and stock markets sampled are based on market capitalization and trading volume and can proxy for cryptocurrencies and stock markets in Africa, respectively. Daily closing market indices for the period 10 August 2015 to 10 December 2021 are gleaned from Thomson Reuters Datastream and CoinMarketCap and expressed in a common currency (USD) to ease comparison and remove exchange rate noise. This practice has been justified in international financial market research (Pukthuanthong & Roll, Citation2009).
The availability of Ethereum data determines the start date of the period of analysis. Ethereum, which is the second-largest cryptocurrency market, started trading on 7 August 2015. We calculate Monday-to-Friday returns for cryptocurrencies due to stocks not traded on weekends. We remove non-synchronous data points to prevent the problem of underestimation of true correlations as did Martens and Poon (Citation2001), Das and Kannadhasan (Citation2018), and Yermack (Citation2015). After matching the daily observations of the seven cryptocurrencies with the eight African stock indices, there were 1097 observations. The number of observations in this study is constrained by the availability of cryptocurrency price data. All indices were then transformed into daily returns by taking the log difference.
The selected summary statistics of daily returns for all the variables presented in Table includes sample means, minimums, maximums, standard deviations, skewness, kurtosis, and the Shapiro–Wilk test of normality. Cryptocurrencies show higher average returns and standard deviation relative to stocks. The average return of all cryptocurrencies is positive except Ethereum. The average stock return of Egypt (EGX30), Nigeria (NSE), Tunisia (Tunindex), and Ghana (GSE) is negative whiles that of South Africa (JSE), Mauritius (SEM), Kenya (Nairobi.SE), and Morocco (CSE) is positive. The largest standard deviation of Steller (XLM) implies that it is the most volatile market of the panel whiles Mauritius (SEM) is the least volatile market with the lowest standard deviation. Bitcoin, Ethereum, Egypt, Ghana, South Africa, Nigeria, and Mauritius have negative skewness, indicating that large negative returns are more common than large positive returns in the markets. Kurtosis statistics show that all the return series are leptokurtic, with significantly fatter tails and higher peaks indicating asymmetry. The Shapiro–Wilk test of normality for all the indices strongly rejects the null hypothesis that their distributions are normal. Further, the pictorial representation of cryptocurrencies and African stocks returns in in the Appendices exhibit fat tails, volatility clustering, and asymmetry suggesting nonlinearity. These features of the assets justify the use of wavelet technique to model their returns and examine their level of association across time.
Figure 1. Time series plot of selected Cryptocurrencies and African stock indices returns
Table 1. Summary statistics of cryptocurrencies and African stock returns
5. Results and discussion
The cross-wavelet coherency results for the 56 pairs of seven cryptocurrencies and eight African stock returns are reported in Figure . The plots explain the pairwise co-movement of the asset markets in the time-frequency space. We used wavelet coherency to measure the local correlation between the asset pairs, and phase difference to show the lead (lag) causal association between the pairs of assets markets. We construct the cross-wavelet coherency from frequencies 2 days to 2048 days and choose three cycles to represent short-, medium-, and long-term fluctuations of the markets. Specifically, the first cycle on the lower scales (2–16 days) is the higher frequencies and denotes short-term fluctuations. The second cycle on the middle scales (16–64 days) is the medium frequencies and indicates medium-term fluctuations. The third cycle on the long scale (> 64 days) is the lower frequencies and shows the long-term fluctuations as used by (Das & Kannadhasan, Citation2018; Liow et al., Citation2017; Owusu-Junior et al., Citation2019).
Figure 2. A. Bitcoin-African stocks cross-wavelet coherency; b. Ethereum-African stocks cross-wavelet coherency; c. Litecoin-African stocks cross-wavelet coherency; d. Ripple-African stocks cross-wavelet coherency; e. Steller-African stocks cross-wavelet coherency; f. Das-African stocks cross-wavelet coherency; g. Monero-African stocks cross-wavelet coherency.
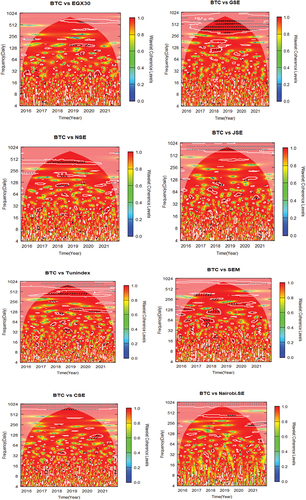
Figure 2. Continued.
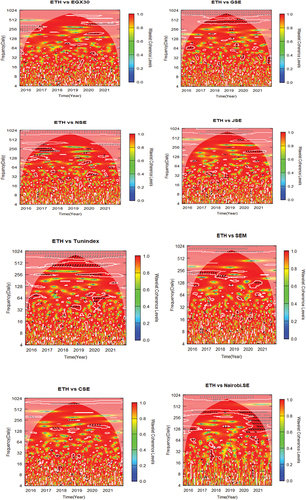
Figure 2. Continued.
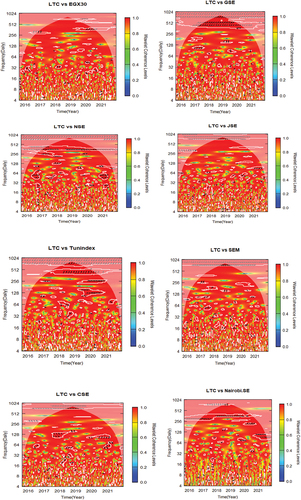
Figure 2. Continued.
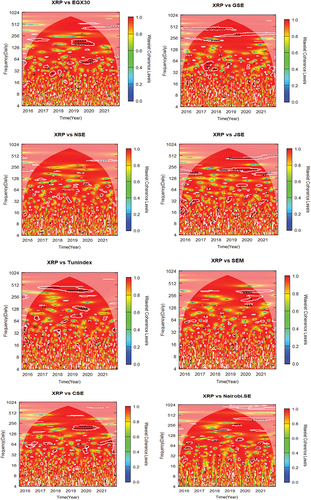
Figure 2. Continued.
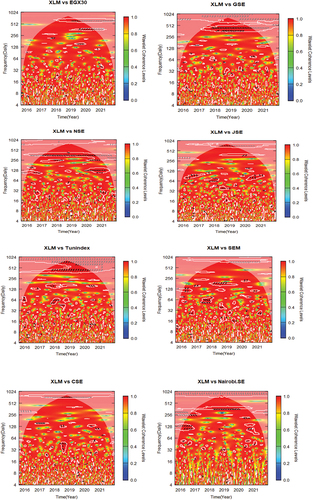
Figure 2. Continued.
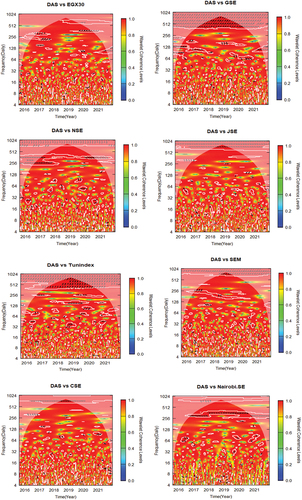
Figure 2. Continued.
The frequencies are depicted on the vertical axis of the plots and the horizontal axis exhibit the time period from 2015 to 2021 sampled for the study. In each plot, the white contour lines inside the cone of influence show the 5% significance level estimated from Monte Carlo simulations. The lighter shade around the cone of influence depicts the boundary effects such that the region outside the boundary is statistically insignificant. This region shows faint red colour and should be interpreted with caution due to edge effect suffered from continuous wavelet transform analysis. The colour codes from red (high coherency, close to one), to blue (low coherency, close to zero) indicate a high degree of association to a weak level of association of the assets pairs, respectively. A white contour with red colour at the top (bottom) of a plot shows strong co-movement at high (low) frequencies. A white contour with red colour at the left (right) hand of a plot exhibits strong co-movement at the start (end) of the sample period.
The arrows in the plots indicate the phase difference by showing the lead (lag) relationship and the direction of relationship between the series. The series are in-phase indicating positive correlation when the arrows point to the right (. The first series leads the market when the arrows point to the right and up but when the arrows point to the right and down the first series lags the market. The series are out of phase suggesting negative correlation when the arrows point to the left
. Arrows that point to the left and up depicts that the first series is lagging the market whiles arrows that point to left and down means the first series is leading the market (see Kumah and Odei-Mensah, Citation2021a; Das & Kannadhasan, Citation2018; Liow et al., Citation2017; Owusu-Junior et al., Citation2019; Roesch & Schmidbauer, Citation2014). The name of the series on top of the plots in Figure (a-g) shows the order of the series.
5.1. Bitcoin-Stock pairs
The Bitcoin-African stocks co-movement in Figure shows that BTC-EGX30 pair is both out of phase and in-phase at 128 to 256 bands with BTC leading EGX30 in both 2019 and 2020. The BTC-GSE duo exhibits a convincing GSE lead out of phase at long scales of 64 to 128 bands from the middle of 2017 to early 2018. In the BTC-NSE pair, NSE leads in-phase in the high 256 to 512 bands from 2017 to 2020. There is a conclusive in-phase BTC lead in the high 64 to 128 bands from 2017 to 2018 for the BTC-JSE pairs. In the case of BTC-Tunindex pair, BTC leads in-phase at 256 to 512 bands from 2017 to 2020. Amidst the populated region of BTC-SEM duo, SEM leads in-phase in the medium 32 to 64 bands from early to middle 2017, whilst BTC leads in-phase at 64 to 130 bands from late 2017 to 2018. The pairs BTC-CSE show BTC lead out of phase in the high 64 to 128 bands from 2020 to 2021. Lastly, the high 256 to 512 bands from 2019 to 2020 depict Nairobi.SE lead in- phase in BTC-Nairobi.SE duo.
The coherency results for the co-movement of Bitcoin with African stock markets indicate that except for the stock market of Mauritius (SEM) which is strongly connected with Bitcoin (BTC) from the medium to the long-terms, Bitcoin (BTC) is highly related with Egypt (EGX30), Ghana (GSE), Nigeria (NSE), South Africa (JSE), Tunisia (Tunindex), Casablanca stock market (Morocco), and Kenya (Nairobi.SE) markets in the long-time horizon. This strong time-varying connections between Bitcoin and African stock markets may be explained by the aggressive pursuit of African economies to ensure stronger ties of African financial markets with global financial markets (see AfDB, OECD, UNDP, Citation2015). The findings could also be due to a strong fundamental linkage between the assets markets including market liberalization, technological advances, removal of statutory controls, and volatility.
The phase difference arrow vectors suggest that except for Egypt which shows both positive and negative associations with Bitcoin in the long-term, Bitcoin depicts positive effects on Nigeria, South Africa, Tunisia, and Kenya in the long-term. Negative effects are visible for Ghana and Morocco in the long-term and positive effects from the medium to the long-terms of Mauritius. These findings suggest that Bitcoin can hedge against extreme stock price movements in Ghana and Morocco in the long-term, and Egypt in the medium-term. We find Bitcoin leading the stock markets across the pairs except for Ghana, Nigeria, Mauritius, and Kenya stock markets and thus volatilities of Bitcoin price may affect stock prices of these markets. These lead (lag) associations in the inter-market volatility correlations between Bitcoin and African stocks may enhance opportunities for arbitrage and diversification for international investors as noted in the works of Madaleno and Pinho (Citation2012).
5.2. Ethereum-Stock pairs
Figure shows the extent of co-movement between Ethereum-African stock pairs. The ETH-EGX30 pair exhibits an out of phase EGX30 lead in the high 128 to 256 bands from 2020 to 2021. ETH-GSE pair shows an in-phase Ethereum lead in the high 64 to 512 bands from 2016 to the middle of 2020. The ETH-NSE duo depicts an out-of-phase Ethereum lead from the 32 to 64 bands in the early 2020. JSE leads out of phase in the high 128 to 256 bands from 2020 to 2021 for the ETH-JSE pair. There is Ethereum lead both in-phase and out of phase in the medium to high 32 to 512 bands from 2015 to mid-2021 for the duo ETH-Tunindex. There is Ethereum lead in-phase at the long scales of 128 to 256 days for mid-2016 through to 2018, and SEM lead in-phase on the 128 scale in late 2020 for the pairs ETH-SEM. Early 2017 and in the high 128 to 256 bands exhibit ETH lag out of phase for the ETH-CSE duo. In the case of ETH-Nairobi.SE pair, Ethereum lags out of phase in 2017 at the medium scales of 16 to 32 days and in-phase in the high of 100 to 512 days from 2020 to 2021.
The findings of the bivariate co-movement of Ethereum and African stocks indicates that Ethereum (ETH) is strongly correlated with Egypt, Ghana, South Africa, and Mauritius stock markets in the long-term. The medium- and long-terms of Kenya and Tunisia stocks show high correlations with Ethereum, while Kenya is highly associated with Ethereum in the medium-term. This high degree of correlation of the markets reflects a fundamental-based contagion with the efforts at integrating African markets with global markets over the past three decades which has been realized through market openness, intra-regional trade and advancement in total economic integration (Mougani, Citation2014).
The homogeneous arrow vectors of phase difference indicate that Ethereum has positive associations in the long-term of Ghana, and Mauritius whilst the heterogeneous arrow vectors depict negative connections in the long-term of Egypt, South Africa, and Morocco, but medium-term for Nigeria. There are both negative and positive connections for Kenya and Tunisia stocks in the medium- and long-term, respectively. This finding is indicative that Ethereum has hedging properties against stock market volatilities for Egypt, South Africa, and Morocco in the long-term, medium-term for Nigeria, and from medium-, to long-term for Kenya and Tunisia. We observe from the lead-lag association of the asset markets that Ethereum leads Ghana, Nigeria, Tunisia stock markets but lags Egypt, South Africa, and Morocco stock markets. It is also observed that Ethereum leads Manutius and Kenya stock markets in the medium-term but lags the markets in long-term. This suggests that the market volatility of Ethereum impact all the stock markets except Egypt, South Africa, and Morocco stock markets where the reverse is true and that arbitrage opportunities may be enhanced by international investors.
5.3. Litecoin-Stock pairs
The coherence and phase relationship between Litecoin and African stocks is depicted in Figure . In the LTC-EGX30 pair, LTC leads in-phase at high scales 256 to 512 in 2020. LTC leads anti-phase at high scales 64 to 128 from late 2016 to 2017 in the LTC-GSE pair. The LTC-NSE pair shows LTC in-phase lead from medium 32 to 64 bands in 2016 and 2021. There is an anti-phase LTC lead in the 64 to 128 bands in 2021 for LTC-JSE duo. There is LTC lead in-phase from 2018 to 2020 in the 256 to 512 bands in the pairs LTC-Tunindex. There is also LTC lead in-phase in 2017 in the bands of 32 to 64 for LTC-SEM pairs. CSE is the leading series in the LTC-CSE pair. The series are anti-phase at 128 days in 2017. We also see Nairobi.SE in lead (in-phase) of LTC in the high 256 to 512 in the mid-2016 to early 2020 in the LTC-Nairobi.SE pair.
The coherence for Litecoin-African stock pairs suggests strong co-movement between the markets from the medium to long-term fluctuations as observed in Bitcoin and Ethereum stock pairs generally indicating that stock markets in Africa are extremely exposed to cryptocurrency market fluctuations. Specifically, the vector arrows in the phase difference indicates that Litecoin has positive effects on Egypt, Tunisia and Kenya stock markets in the long-term, but in the medium-term for Nigeria and Mauritius. We observe negative effects in the long-term for Ghana, South Africa, and Morocco stock markets. This indicates that Litecoin has hedging benefits in the long-term for Ghana, South Africa, and Morocco stocks. We also observe Litecoin as the leading series in all stock markets except for Morocco and Kenya stock markets implying that changes in the price of Litecoin leads to changes in African stock prices except for Morocco stocks where the reverse applies. The findings for Litecoin-stock pairs depict the fundamental-based contagion and the hypothesis that co-movement is stronger at longer time scales (Barberis, Shleifer and Wurgler, Citation2005)
5.4. Ripple-Stock pairs
We show the coherence and phase difference of Ripple and African stocks in Figure . The interaction of the time series of XRP-EGX30 depicts XRP lead in-phase in the high 128 to 256 bands from 2019 to 2020 and EGX30 lead in-phase at medium 16 to 32 bands in the same period. XRP leads in-phase in the medium 32 to 64 bands in 2017 for the XRP-GSE pair. Most of the scattered arrows in XRP-JSE pair are anti-phased and show XRP lead out of phase at the 32 scale in 2016. Tunnindex lags in-phase on the 128 scale in 2019 in the XRP-Tunindex pair. The pair XRP-SEM shows SEM lead in-phase in 2020 from the 256 scale. CSE leads XRP in-phase in XRP-CSE pair at long scales of 128 to 256 from 2019 to 2020. Lastly, there are no obvious phase difference between the XRP-Nairobi.SE pair and the XRP-NSE pair across scales and horizons.
The findings suggest strong coherence for Ripple-African stocks returns in the medium-term (South Africa, and Ghana), and long-term (Egypt, Tunisia, Mauritius, and Morocco), but no coherence for Nigeria and Kenya stock markets which implies that except for Nigeria and Kenya, Ripple is highly connected to African stock markets from the medium-term. We observe from the phase difference arrow vectors that the price of Ripple has positive effects on all stock markets from the medium to long-term except for South Africa (negative) and Nigeria and Kenya (no association). Clearly, Ripple can only hedge fluctuations in the South African stock market. Except for Egypt which leads Ripple in the medium-term but lags in long-term, Ripple leads Ghana, South Africa, and Tunisia, stock markets but lags Mauritius and Morocco stock markets. There is neither lead nor lag between Ripple, Nigeria, and Kenya stock markets showing Nigeria and Nairobi stock markets as the isolated African stock markets. From these results, we can say that fluctuations in Ripple prices may affect Ghana, South Africa and Tunisia stock markets, with Mauritius and Morocco stock markets showing the reverse.
5.5. Steller-Stock pairs
The co-movement between Steller and African stock returns are displayed in Figure . The XLM-EGX30 plot shows in-phase Steller lead in the 256 to 512 bands in 2019. There is a clear Steller lead in-phase (256–512 bands) from 2017 to 2020 in the XLM-GSE plot. The XLM-NSE pair depicts NSE lead in-phase in the 256 to 512 bands from 2017 to 2020. Johannesburg stock market lead anti-phase in the high 64 to 128 band in 2016 and 2020 for the pair XLM-JSE. For XLM-Tunindex pair, Tunindex leads in-phase at 64 scale in 2015 but lags out of phase at 32 to 64 scales between 2017 and 2018. The plot for XLM-SEM show that SEM leads Steller in-phase (2017) in the medium 32 to 64 band but lags in-phase in the upper bands 128 to 256 in 2017. It is obvious from XLM-CSE duo that the Casablanca stock market is leading Steller out of phase in the medium scales of 32 to 64 in 2018. In the plot of XLM-Nairobi.SE, we see a clear Steller lead in-phase in the 128 scale but lags in from the 256 scale from late 2017 to 2020.
Analyzing the coherence between Steller and African stock returns, we can conclude that similar to Bitcoin, Ethereum, Litecoin, and Ripple, Steller is strongly connected to African stock markets from the medium to long-term. The homogeneous phase arrow vectors are indicative of Stellers’ positive connections with Egypt, Ghana, Nigeria, and Kenya but negative effects for South Africa in the long-term. The medium-term of Morocco exhibit negative associations, but positive connections are visible for Tunisia and Mauritius from the medium-, to the long-terms. This finding means that Steller can hedge the market discrepancies of South Africa and Morocco in the long-term and medium-term respectively. Steller leads Egypt, Ghana, South Africa, Kenya, Tunisia (medium-term), and Mauritius (long-term), stock markets indicating that volatility in the price of Steller has possibility of influencing the stock prices. Conversely, Steller lags Nigeria, Morocco, Mauritius (medium-term), and Tunisia (long-term) implying that stock price volatilities in these markets affect the price of Steller.
5.6. Das-Stock pairs
Figure presents the wavelet coherence and phase difference for Das and African stock returns. For DAS-EGX30 pair there is a substantial Das lead in-phase in the 200 to 300 band from mid-2016 to early-2017. Ghana leads in phase on the 64 band in 2020 for DAS-GSE duo. The DAS-NSE plot show phase indifference across scales and horizons. The DAS-JSE pair shows similar pattern to DAS-NSE with no phase difference. Tunindex lags Das anti-phase from the medium 32 to the high 256 bands from 2018 to 2020 for DAS-Tunindex pair. SEM leads DAS in-phase in the high 64 to 128 bands in 2017. The pair DAS-CSE show phase indifference similar to DAS-NSE, and DAS-JSE. There is a significant Nairobi.SE lead in-phase at scale 64 (2016), and from scales 256 to 512 from mid-2016 to 2020 in DAS-Nairobi.SE pair.
The results above highlight the obvious high co-movement between Das and African stock returns in the medium-term of Tunisia but long-term of Egypt, Ghana, Mauritius, and Kenya stock markets. Das is not yet connected to Nigeria, South Africa, and Morocco stock markets in any of the time horizons as indicated by the coherency plots. It is evident from the phase arrow vectors that Das exhibit positive effects on Egypt, Ghana, Mauritius, and Kenya stock markets in the long-term, negative effect on Tunisia (medium-term), and no effect on Nigeria, South Africa, and Morocco stock markets. This means that Das can hedge against market crises of Tunindex in the medium-term. Das significantly leads Egypt, and Tunisia stock markets but lags Ghana, Mauritius, and Kenya stock markets which means that extreme market volatilities of Das impact Egypt, and Tunisia stocks whilst Ghana, Mauritius, and Kenya exhibit the reverse as depicted by the lead-lag effects in the plot and this may enhance arbitrage opportunities by international investors. Importantly, we find DAS to be isolated from Nigeria, South Africa, and Morocco stock markets reflecting challenges including political unrest, illiquidity, and exchange rate exposure of the stock markets leading to inactive participation by foreign investors.
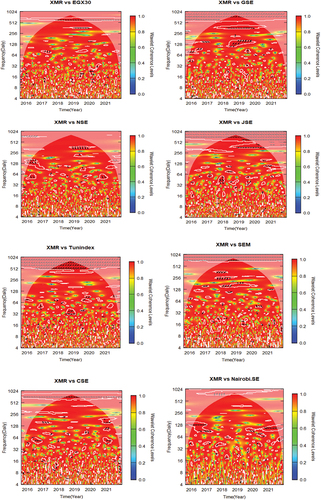
5.7. Monero-Stock pairs
The Monero-Stock pairs in Figure exhibit the wavelet coherency and phase difference for the markets. The XMR-EGX30 plot show phase indifference across scales and horizons. Monero leads in-phase in the 64 to 256 bands from 2016 to 2019 in the XMR-GSE pair. In the pair XMR-NSE, Nigeria stock market lead in-phase in the 256 to 512 bands. Johannesburg stock market also leads Monero in-phase in 2017 at the band 32 to 64 for the XMR-JSE pair. The pair XMR-Tunindex depicts no significant-phase difference across scales and horizons. For the XMR-SEM pair, XMR lead in-phase at 128 scale in the late 2017. XMR-CSE and XMR-Nairobi.SE pairs show similar pattern to XMR-Tunindex with phase indifference.
The results for co-movement of Monero and African stock returns confirm the obvious medium to long-term integration of the assets. We observe that movement of the price of Monero positively influence all the stock returns from the medium-, to the long-term suggesting that investors cannot hedge their positions using Monero. We also find Monero to be isolated from Egypt, Tunisia, Morocco, and Kenya stocks. Monero leads Ghana and Mauritius stock markets demonstrating the positive response of the stock markets to the high price volatilities of Monero. Nevertheless, Nigeria and South Africa stock markets lead Monero and thus Monero responds to the market fluctuations in these stock markets. The result further show that Monero is decoupled from EGX30 (Egypt), Tunindex (Tunisia), Casablanca stock market (Morocco) and Nairobi stock market (Kenya).
To sum it all up, the co-movement between cryptocurrencies and African stock returns displayed in Figure (a-g) and on Table in the appendix suggest a high level of associations between the markets from the medium to long-term which is reflective of the fundamentals including market openness, intra-regional trade and enhanced economic integration laid down by policy decision makers in Africa to integrate African markets with global markets over the past three decades (see Mougani, Citation2014; Aamir and Ali Shah, 2018).
Testing the hedging and diversification properties of cryptocurrencies for African stocks following the description for hedge, safe haven, and diversification by D. G. Baur and Lucey (Citation2010) and D. G. Baur and Lucey (Citation2010)Footnote4, we find Bitcoin as a hedge for Ghana, and Morocco stock markets in the long-term but both medium and long-term for Egypt stocks. Ethereum can hedge the downside risk of Egypt, South Africa and Morocco stocks in the long-term, both medium and long-terms of Kenya and Tunisia stocks, and medium-term for Nigeria stocks. Litecoin has hedging benefits for Ghana, South Africa, and Morocco stocks in the long-term. Ripple can hedge the market fluctuations of South Africa stocks. Investors in South Africa, and Morocco stock markets can hedge their positions using Steller in the long-term and medium-term respectively. Stock investors in Tunindex stock markets can hedge price risk using Das in the medium-term (Tunindex). Finally, Monero do not have any hedging property for African stocks across time and frequencies.
In terms of lead (lag) relationship in the market, we find Bitcoin leading EGX30, JSE, and Tunindex. Ethereum leads GSE, NSE, and Tunindex. Litecoin leads all stock markets except CSE. Ripple leads GSE, JSE, and Tunindex. Steller leads EGX30, GSE, JSE, and Nairobi.SE. Das leads EGX30, and Tunindex whiles Monero leads GSE and SEM. These lead (lag) associations in the inter-market volatility association between the cryptocurrencies and African stock returns have implication for arbitrage opportunities which can aid investment decisions for international investors.
The findings for XRP-Nairobi.SE, XRP-NSE, DAS-NSE, DAS-JSE, DAS-CSE, XMR-EGX30, XMR-CSE, XMR-Nairobi.SE, XMR-Tunindex (9-pairs) provide evidence of no correlation between the cryptocurrencies and stock returns in support of the works of Corbet et al. (Citation2018), Liu and Tsyvinski (2018), and Gil-Alana et al. (Citation2020). This segmentation of the assets markets across time could be due to several factors including exchange rate risk, illiquidity, inefficiency and undiversified characteristics hindering the nascent African markets. However, the majority of the cryptocurrency-stock pairs confirm the findings of related studies including Ciaian et al. (Citation2018), Baur et al. (Citation2018), and Bouri, Shahzad, and Roubaud (Citation2019). These studies demonstrate the inter-market linkages and hedging abilities of cryptocurrencies for global stock indices.
In general, when the results are compared to other studies on cryptocurrencies and stock markets associations using different methods in advanced stock markets, our results are similar to the results of Kumah et al. (Citation2021b, Citation2022). Ciaian et al. (Citation2018), Baur et al. (Citation2018), Liu and Tsyvinski (2018), and Bouri, Shahzad, and Roubaud (Citation2019). These studies report that cryptocurrencies offer diversification benefits for global stock markets. From the international investors’ perspective, cryptocurrencies, offer little potential gains from international portfolio diversification for medium and long-term investment horizon investors in Africa than their short-term counterparts.
6. Conclusion and policy implication
This paper investigates the co-movement between cryptocurrencies and African stock returns to uncover their association and global portfolio diversification benefits. The paper focuses on seven large cryptocurrencies (Bitcoin, Ethereum, Litecoin, Das, Ripple, Steller, and Monero) and eight African stock indices (Egypt, South Africa, Nigeria, Mauritius, Kenya, Ghana, Tunisia, and Morocco) to achieve the set objective. Data spans 10 August 2015 to 10 December 2021 at daily frequency. Examining the co-movement between cryptocurrencies and African stock returns on multiple time scales, we applied the continuous morlet wavelet transform by Morlet et al. (Citation1982). We performed a cross-wavelet coherency test for 56 pairs of seven cryptocurrencies and eight African stock returns.
The local correlation between the asset pairs were measured using the wavelet coherency, and the phase difference arrow vectors suggested the direction of correlation and the lead (lag) causal association between the pairs of assets markets. The findings of this study suggest that cryptocurrencies and African stock returns are highly connected in the medium to long-terms reflecting the aggressive pursuit of African economies to be integrated with the global economy in the long-term. This result infers the possibility of hedging benefits across cryptocurrencies in the short-term. We recommend that international investors seeking to hedge their price risk in African stock markets using cryptocurrencies should look at the short-time horizon. More specifically, cryptocurrencies provide high portfolio diversification opportunities for short-term market participants compared to their medium and long-term counterparts in the African stock markets. We found no particular cryptocurrency or stock market as the market leader. Different markets have the potential to lead at some point on the scales suggesting that the returns of any of the assets markets under consideration can drive price changes in the other markets.
The empirical results of our study both support and contradict related literature. The results support the inter-market linkages between cryptocurrencies and global stock returns evidenced by Kumah et al. (Citation2022, 2017). Ciaian et al. (Citation2018), Liu and Tsyvinski (2018), and Bouri, Shahzad, and Roubaud (Citation2019) and contradict Corbet et al. (Citation2018) and Gil-Alana et al. (Citation2020) who found no connection between the markets. In portfolio allocations and management, co-movement of financial markets plays an important role. Further, financial market participants operate at different frequencies suggesting that inter-market linkages are not necessarily the same over different time scales and frequencies.
Our findings of high connectedness in the medium-, and long-terms provide insights for regulators and potential international investors. What investors can do to extend the diversification benefits from the short-term to the medium-, and long-terms is to call for policymakers and regulators to enact measures that will reduce the level of integration between the asset markets to ensure investor benefit with the diversification returns. Policymakers can also benefit from this study as events in one market can significantly impact other markets, as each market is an integral part of a single global market. Importantly, high levels of integration can have monetary policy and macroeconomic implications, since an economy’s monetary policy can be affected by the connections between the domestic capital market and other markets within the sub-region and globally. This motivates the study to examine the inter-market linkages between cryptocurrencies and African stock markets in a time-frequency space.
The results for the co-movement between cryptocurrencies and African stock returns are the unique contribution of this study. Future studies can further examine the co-movement of cryptocurrencies and African stocks implementing other statistical test applied to wavelet technique as suggested by Schulte (Citation2019) to enhance our understanding of the inter-market linkages.
Disclosure statement
No potential conflict of interest was reported by the authors.
This manuscript did not receive any specific grant from funding agencies in the commercial, public, or not-for-profit sectors.
Additional information
Notes on contributors

Seyram Pearl Kumah
DR. SEYRAM PEARL KUMAH is a Lecturer in Accounting and Finance at the Akenten Appiah-Menka University of Skills Training and Entrepreneurial Development, Kumasi, Ghana. She is also a chartered accountant with 13 years’ experience in Auditing, Financial Accounting and Management Accounting practices. Seyram’s research interests include cryptocurrencies, central bank digital currencies, financial interconnectedness, systemic spillovers, market integration, and sustainability accounting. PROF. JONES ODEI-MENSAH is a senior faculty member at the University of the Witwatersrand, where he directs the Wits Business school’s Postgraduate Diploma in Management programme. Jones consults with multilateral organisations such as the African Export-Import Bank and the African Union; multinational professional services networks such as KPMG; think tanks such as the African Center for Economic Transformation; serves as a Board member on a few organisations, including the AREF Consult and Nile Valley Group. MRS RICHMELL BAABA AMANAMAH is a senior lecturer at the Akenten Appiah-Menka University of Skills Training and Entrepreneurial Development, Kumasi, Ghana. She is also a chartered accountant with 15 years practical experience in Accounting, Auditing, and Financial Management. She has Bachelor of Commerce degree from the University of Cape Coast, Master of Business Administration degrees from the Wisconsin University, and the Kwame Nkrumah University of Science and Technology
Notes
1. As noted by Kim (Citation2017), cryptocurrency can be used as a cost-effective alternative to the existing forex market and can also be used as an asset instead of a medium of exchange due to its liquidity, diversification, and hedging properties (Bouri et al., Citation2017; Kristjanpoller & Bouri, Citation2019).
2. The continuous Morlet wavelet transform is used to examine the bivariate co-movement of assets across time and frequency using the wavelet power spectrum, cross-wavelet coherency, and phase difference. The CMWT is accurate in the estimation of modal parameters, has ability to distinguish and separate several modes, resistance to noisy conditions, and usability with different excitations types (Morlet et al., Citation1982).
3. The multi-resolution decomposition property of wavelet transform can be used to separately identify contagion and interdependence by associating each to its corresponding frequency component.
4. D. G. Baur and Lucey (Citation2010) and D. G. Baur and Lucey (Citation2010) tested the safe haven, hedge, and diversification benefits of bonds and gold. However, we are not in anyway, suggesting that cryptocurrencies are like bonds or gold.
References
- Aaltonen, A., Prasauskas, T., Du, L., Turunen, M., Kiviste, M., Aaltonen, A., Martuzevicius, D., & Haverinen-Shaughnessy, U. (2017). Cryptocurrencies’ internal and external relations: A descriptive analysis of cryptocurrency dynamics and relations to the US equity market. The Science of the Total Environment, 621, 398–29. doi:10.1016/j.scitotenv.2017.11.227
- AfDB, OECD, UNDP (2015). African economic outlook 2015: Regional development and spatial inclusion. http://www.google.com/url?sa=t&rct=j&q=&esrc=.
- Agyei-Ampomah, S. (2008). An empirical examination of the inter-linkages between African stock markets. SSRN Electronic Journal. Available at SSRN 1311325. 10.2139/ssrn.1311325
- Alagidede, P., Panagiotidis, T., & Zhang, X. (2011). Causal relationship between stock prices and exchange rates. The Journal of International Trade & Economic Development, 20(1), 67–86. doi:10.1080/09638199.2011.538186
- Al-Yahyaee, K. H., Mensi, W., & Yoon, S. M. (2018). Efficiency, multifractality, and the long-memory property of the bitcoin market: A comparative analysis with stock, currency, and gold markets. Finance Research Letters, 27, 228–234. doi:10.1016/j.frl.2018.03.017
- Barberis, N., Shleifer, A., & Wurgler, J. (2005). Comovement. Journal of Financial Economics, 75(2), 283–317. https://doi.org/10.1016/j.jfineco.2004.04.003
- Baur, D., Hong, G. K., & Lee, A. D. (2018). Bitcoin: Medium of exchange or speculative assets?. Journal of International Financial Markets, Institutions and Money, 54, 177–189. doi:10.1016/j.intfin.2017.12.004
- Baur, D. G., & Lucey, B. M. (2010). Is gold a hedge or a safe haven? An analysis of stocks, bonds and gold. Financial Review, 45(2), 217–229. doi:10.1111/j.1540-6288.2010.00244.x
- Bekiros, S., & Marcellino, M. (2013). The multiscale causal dynamics of foreign exchange markets. Journal of International Money and Finance, 33, 282–305. doi:10.1016/j.jimonfin.2012.11.016
- Boako, G., & Alagidede, P. (2016). Regionalization versus Internationalization of African stock markets: A frequency-time domain analysis. https://www.researchgate.net/profile/Gideon_Boako/publication/309160305_Regionalization_versus_internationalization_of_African_stock_markets_A_frequency-time/links/5802068908ae6c2449f7c5fa.pdf
- Bouri, E., Mahamitra, D., Gupta, R., & Roubaud, D. (2018). Spillovers between bitcoin and other assets during bear and bull markets. Applied Economics, 50(55), 5935–5949. doi:10.1080/00036846.2018.1488075
- Bouri, E., Molnár, P., Azzi, G., Roubaud, D., & Hagfors, L. I. (2017). On the hedge and safe haven properties of bitcoin: Is it really more than a diversifier?. Finance Research Letters, 20, 192–198. doi:10.1016/j.frl.2016.09.025
- Bouri, E., Shahzad, S. J. H., & Roubaud, D. (2019). Co-explosivity in the Cryptocurrency market. Finance Research Letters, 29, 178–183. doi:10.1016/j.frl.2018.07.005
- Bouri, E., Shahzad, S. J. H., & Roubaud, D. (2019). Cryptocurrencies as hedges and safe havens for US equity sectors. The Quarterly Review of Economics and Finance, 1–14. https://doi.org/10.1016/j.qref.2019.05.001
- Brière, M., Oosterlinck, K., & Szafarz, A. (2015). Virtual currency, tangible return: Portfolio diversification with bitcoin. Journal of Asset Management, 16(6), 365–373. doi:10.1057/jam.2015.5
- Burrus, C. S., Gopinath, R., & Guo, H. (1998). A primer introduction to wavelets and wavelet transforms. New Jersy: Prentice Hall, 3.
- Chalid, D. A., Handika, R., & McMillan, D. (2022). Comovement and contagion in commodity markets. Cogent Economics & Finance, 10(1), 2064079. https://doi.org/10.1080/23322039.2022.2064079
- Ciaian, P., Rajcaniova, M., & Kancs, D. (2018). Virtual relationships: Short-and long-run evidence from bitcoin and altcoin markets. Journal of International Financial Markets, Institutions and Money, 52, 173–195. doi:10.1016/j.intfin.2017.11.001
- Corbet, S., Meegan, A., Larkin, C., Lucey, B., & Yarovaya, L. (2018). Exploring the dynamic relationships between cryptocurrencies and other financial assets. Economics Letters, 165, 28–34. doi:10.1016/j.econlet.2018.01.004
- Das, D., & Kannadhasan, M. (2018). Do global factors impact bitcoin prices? Evidence from wavelet approach. Journal of Economic Research, 23, 227–264.
- Diebold, F. X., & Yilmaz, K. (2012). Better to give than to receive: Predictive directional measurement of volatility spillovers. International Journal of Forecasting, 28(1), 57–66. https://doi.org/10.1016/j.ijforecast.2011.02.006
- Dornbusch, R., Park, Y. C., & Claessens, S. (2000). Contagion: How it spreads and how it can be stopped. World Bank Research Observer, 15(2), 177–197. doi:10.1093/wbro/15.2.177
- Emenalo, C. (2009). A review of the cost of equity in emerging and frontier markets. Available at SSRN 1517836. http://papers.ssrn.com/sol3/papers.cfm?abstract_id=1517836.
- Engle, R. F., & Granger, C. W. J. (1987). Cointegration and error correction: Representation, estimation and testing. Econometrica, 55(2), 251–276. doi:10.2307/1913236
- Fang, L., Bouri, E., Gupta, R., & Roubaud, D. (2019). Does global economic uncertainty matter for the volatility and hedging effectiveness of bitcoin?. International Review of Financial Analysis, 61, 29–36. doi:10.1016/j.irfa.2018.12.010
- Forbes, K. J., & Rigobon, R. (2002). No contagion, only interdependence: Measuring stock market co-movements. The Journal of Finance, 57(5), 2223–2261. doi:10.1111/0022-1082.00494
- Ftiti, Z., Tiwari, A., Belanès, A., & Guesmi, K. (2015). Tests of financial market contagion: Evolutionary cospectral analysis versus wavelet analysis. Computational Economics, 46(4), 575–611. doi:10.1007/s10614-014-9461-8
- Gabor, D. (1946). Theory of communication. Part 1: The analysis of information. 931.
- Gallegati, M. (2012). A wavelet-based approach to test for financial market contagion. Computational Statistics & Data Analysis, 56(11), 3491–3497. doi:10.1016/j.csda.2010.11.003
- Gil-Alana, L. A., Abakah, E. J. A., & Rojo, M. F. R. (2020). Cryptocurrencies and stock market indices. Are they related?. Research in International Business and Finance, 51, 101063. doi:10.1016/j.ribaf.2019.101063
- Grinsted, A., Moore, J. C., & Jevrejeva, S. (2004). Application of the cross wavelet transform and wavelet coherence to geophysical time series. Nonlinear Processes in Geophysics, 11(5/6), 561–566. doi:10.5194/npg-11-561-2004
- Grossman, A., & Morlet, J. (1984). Decomposition of hardy functions into square integrable wavelets of constant shape. SIAM Journal on Mathematics Analysis, 15(4), 723–736. doi:10.1137/0515056
- Grubel, H. G. (1968). Internationally diversified portfolios: Welfare gains and capital flows. The American Economic Review, 58(5), 1299–1314.
- Huynh, T. L. D. (2019). Spillover risks on cryptocurrency markets: A look from VAR-SVAR granger causality and student’s-t copulas. Journal of Risk and Financial Management, 12(2), 52. doi:10.3390/jrfm12020052
- In, F., & Kim, S. (2013). An introduction to wavelet theory in finance: A wavelet multiscale approach. World Scientific. https://books.google.com/books?
- Institution of electrical engineers-part III. Radio and Communication Engineering, 93, 429–441.
- Jarnstrom, J., Kane, G., & Knightly, C. (2018). Predicting the unpredictable: A correlation of cryptocurrencies. Twitter Sentiment, and Stock Markets.
- Johansen, S. (1988). Statistical Analysis of Cointegration Vectors. Journal of Economic Dynamics & Control, 12(2–3), 231–254. https://doi.org/10.1016/0165-1889(88)90041-3
- Jouila, A., & Nouri, K. (2019, December). Stabilization of neuro-control structure using Lyapunov functional based approach. In 2019 International Conference on Signal, Control and Communication (SCC) (pp. 81–86). IEEE.
- Kim, T. (2017). On the transaction cost of bitcoin. Finance Research Letters, 23, 300–305. doi:10.1016/j.frl.2017.07.014
- Klabbers, S. (2017). Bitcoin as an investment asset: The added value of bitcoin in a global market portfolio.
- Kristjanpoller, W., & Bouri, E. (2019). Asymmetric multifractal cross-correlations between the main world currencies and the main cryptocurrencies. Physica A: Statistical Mechanics and Its Applications, 523, 1057–1071. doi:10.1016/j.physa.2019.04.115
- Kumah, S. P., & Mensah, J. O. (2022). Are cryptocurrencies connected to gold? A wavelet‐based quantile‐in‐quantile approach. International Journal of Finance & Economics 27(3), 3640–3659.
- Kumah, S. P., & Odei-Mensah, J. (2021a). Are cryptocurrencies and African stock markets integrated?. The Quarterly Review of Economics and Finance, 81, 330–341. doi:10.1016/j.qref.2021.06.022
- Kumah, S. P., & Odei-Mensah, J. (2021b). Can altcoins become viable alternatives to African fiat currencies?. International Journal of Development Issues.
- Kumah, S. P., Odei-Mensah, J., & McMillan, D. (2022). Do cryptocurrencies and crude oil influence each other? Evidence from wavelet-based quantile-in-quantile approach. Cogent Economics & Finance, 10(1), 2082027. doi:10.1080/23322039.2022.2082027
- Kurkaa, J. (2019). Do cryptocurrencies and traditional asset classes influence each other?. Finance Research Letters, 38, 38–46. doi:10.1016/j.frl.2019.04.018
- Liow, K. H., Zhou, X., Qiang, L., & Huang, Y. (2017). Co-movements and systematic risk of Asian securitized real estate markets: A wavelet analysis. SSRN Electronic Journal. Available at SSRN 2971571. 10.2139/ssrn.2971571
- Liu, Y., & Tsyyinski, A. (2021). Risks and returns of cryptocurrency. The Reveiw of Financial Studies, 34(6), 2689–2727. https://doi.org/10.1093/rfs/hhaa113
- Madaleno, M., & Pinho, C. (2010a). Hedging performance and multiscale relationships in the German electricity spot and futures markets. Journal of Risk and Financial Management, 3(1), 26–62. doi:10.3390/jrfm3010026
- Madaleno, M., & Pinho, C. (2010b). Relationship of the multiscale variability on world indices. Revista De Economia Financiera, 20, 69–92.
- Madaleno, M., & Pinho, C. (2012). International stock market indices co-movements: A new look. International Journal of Finance & Economics, 17(1), 89–102. doi:10.1002/ijfe.448
- Marashdeh, H. A., & Shrestha, M. B. (2010). Stock market integration in the GCC countries. International Research Journal of Finance and Economics, 37, 104–114.
- Martens, M., & Poon, S. H. (2001). Returns synchronization and daily correlation dynamics between international stock markets. Journal of Banking and Finance, 25(10), 1805–1827. doi:10.1016/S0378-4266(00)00159-X
- Mensah, J. O., & Alagidede, P. (2017). How are Africa’s emerging stock markets related to advanced markets? Evidence from copulas. Economic Modelling, 60, 1–10. doi:10.1016/j.econmod.2016.08.022
- Mlambo, C., Maredza, A., & Sibanda, K. (2013). Effects of exchange rate volatility on the stock market: A case study of South Africa. Mediterranean Journal of Social Sciences, 4(14), 561–570.
- Mongal, I., & Eita, J. H. (2014). Commodity prices and stock market performance in South Africa. Corporate Ownership and Control, 11(4), 370–375. doi:10.22495/cocv11i4c3p7
- Morlet, J., Arens, G., Fourgeau, E., & Glard, D. (1982). Wave propagation and sampling theory—Part I: Complex signal and scattering in multilayered media. Geophysics, 47(2), 203–221. doi:10.1190/1.1441328
- Mougani, G. (2014). Challenges towards regional financial integration and monetary coordination in the West African monetary zone and the East African community. Regional Integration Policy Paper, African Development Bank, 1–56.
- Owusu-Junior, P., Tweneboah, G., & Adam, A. M. (2019). Interdependence of major exchange rates in Ghana: A wavelet coherence analysis. Journal of African Business, 20(3): 1–24. https://doi.org/10.1080/15228916.2019.1583973
- Peltomäki, J., Graham, M., & Alagidede, P. (2017). Commodity-driven integration of stock markets in Africa. Applied Economics Letters, 24(11), 784–789. doi:10.1080/13504851.2016.1229402
- Pukthuanthong, K., & Roll, R. (2009). Global market integration: An alternative measure and its application. Journal of Financial Economics, 94(2), 214–232. doi:10.1016/j.jfineco.2008.12.004
- Roesch, A., & Schmidbauer, H. (2014). Package ‘WaveletComp.’ https://pbil.univlyon1.fr/CRAN/web/packages/WaveletComp/WaveletComp.pdf
- Saiti, B., Bacha, O. I., & Masih, M. (2016). Testing the conventional and islamic financial market contagion: Evidence from wavelet analysis. Emerging Markets Finance and Trade, 52(8), 1832–1849. https://coinmarketcap.com
- Schulte, J. A. (2019). Statistical hypothesis testing in wavelet analysis: Theoretical developments and applications to Indian rainfall. Nonlinear Processes in Geophysics, 26(2), 91–108. doi:10.5194/npg-26-91-2019
- Sibanda, M. (2015). Stock market returns and exchange rate movements in a multiple currency economy: The case of Zimbabwe. Journal of Economic and Financial Sciences, 8(3), 742–752. doi:10.4102/jef.v8i3.119
- Torrence, C., & Compo, G. P. (1998). A practical guide to wavelet analysis. Bulletin of the American Meteorological Society, 79(1), 61–78. doi:10.1175/1520-0477(1998)079<0061:APGTWA>2.0.CO;2
- Torrence, C., & Webster, P. J. (1999). Interdecadal changes in the ENSO–Monsoon system. Journal of Climate, 12(8), 2679–2690. doi:10.1175/1520-0442(1999)012<2679:ICITEM>2.0.CO;2
- Trabelsi, N. (2018). Are there any volatility spill-over effects among cryptocurrencies and widely traded asset classes?. Journal of Risk and Financial Management, 11(4), 66. doi:10.3390/jrfm11040066
- Uddin, G. S., Tiwari, A. K., Arouri, M., & Teulon, F. (2013). On the relationship between oil price and exchange rates: A wavelet analysis. Economic Modelling, 35, 502–507. doi:10.1016/j.econmod.2013.07.035
- Ünvana, Y. A. (2019). Impacts of bitcoin on USA, Japan, China and Turkey stock market indexes: Causality analysis with value at risk method (VAR). Communications in Statistics-Theory and Methods, 50(2): 1–16. DOI:10.1080/03610926.2019.1678644
- Veleda, D., Montagne, R., & Araujo, M. (2012). Cross-wavelet bias corrected by normalizing scales. Journal of Atmospheric and Oceanic Technology, 29(9), 1401–1408. doi:10.1175/JTECH-D-11-00140.1
- Vincent, B., & Bertrand, C. (2005). Evidences of interdependence and contagion using frequency domain framework. https://doi.org/10.1016/j.ememar.2008.11.003
- Wang, G. J., Xie, C., Wen, D., & Zhao, L. (2019). When bitcoin meets Economic Policy Uncertainty (EPU): Measuring risk spillover effect from epu to bitcoin. Finance Research Letters, 31. doi:10.1016/j.frl.2018.12.028
- Wu, S., Tong, M., Yang, Z., & Derbali, A. (2019). Does gold or bitcoin hedge economic policy uncertainty?. Finance Research Letters, 31, 171–178. doi:10.1016/j.frl.2019.04.001
- Yaya, S. O., Ogbonna, A. E., & Olubusoye, E. O. (2018). How Persistent and dependent are pricing of bitcoin to other cryptocurrencies before and after 2017/18 crash?. Munich Personal RePEc Archive, 91253. https://mpra.ub.uni-muenchen.de/91253/
- Yermack, D. (2015). Is bitcoin a real currency?. In D. Lee (Ed.), The handbook of digital currency (pp. 31–44). Elsevier.
- Yousaf, I., & Ali, S. (2021). Linkages between stock and cryptocurrency markets during the COVID-19 outbreak: An intraday analysis. The Singapore Economic Review, 1-20.
- Yousaf, I., Ali, S., Bouri, E., & Dutta, A. (2021). Herding on fundamental/nonfundamental information during the COVID-19 outbreak and cyber-attacks: Evidence from the cryptocurrency market. SAGE Open, 11(3), 21582440211029911. doi:10.1177/21582440211029911
- Zhang, W., Wang, P., Li, X., & Shen, D. (2018). Some stylized facts of the cryptocurrency market. Applied Economics, 50(55), 5950–5965. https://doi.org/10.1080/00036846.2018.1488076