
 ?Mathematical formulae have been encoded as MathML and are displayed in this HTML version using MathJax in order to improve their display. Uncheck the box to turn MathJax off. This feature requires Javascript. Click on a formula to zoom.
Abstract
This paper aims to determine the level of awareness and implementation of measuring CoQ in MIEs in Yemen. In contrast, this study was based on the traditional CoQ Prevention—Appraisal—Failure (PAF) model. Also, this paper proposes a suitable model for measuring CoQ in MIEs based on the research results. The Applied research focused on large companies where CoQ programs in the majority of companies operate as a subsystem of underlying management. Managers of large companies use indicators to control and evaluate performance for production quality. Still, they usually do not develop a separate framework for measuring and assessing CoQ. As a result, this research attempted to answer the question, Are Yemeni industrial companies interested in measuring, analyzing, and reporting CoQ items (prevention, appraisal, and failure costs) concerned in their industry? It also determines the extent these companies are interested in measuring, and analyzing hidden CoQ. According to this research findings, most major companies in Yemen are aware of and practice measuring CoQ. At the same time, the study showed that these companies are still not interested in measuring the hidden CoQ in their manufacturing.
PUBLIC INTEREST STATEMENT
Since the 1950s, a great deal of attention has been paid to CoQ both in theory and in practice. In general, the implementation of a quality costing system works to achieve a balance between cost and quality. This means that organizations can reduce the cost of their products without sacrificing quality. Which leads to increased customer satisfaction and the value of its products/services provided to the market. Although most studies confirm that the application of the CoQ system leads to improving the reputation of the enterprises in the market and its competitiveness. However, some enterprises still believe that the implementation of the CoQ system is nothing but extra costs. Therefore, this paper examines the extent to which the quality costing system is applied in MIEs in Yemen. As well as determining the items of CoQ used in these enterprises.
1. Introduction
Quality costs (CoQ) measurement (prevention costs, appraisal costs, failure costs) is one of the most critical and influential tools for assessing the success of total quality management programs in industrial enterprises (Jaju et al., Citation2009). It assists various departments in measuring performance reports, rationalizing decisions, and evaluating strategic objectives, planning, and budgeting. One of the most important outcomes of the quality control measurement process is identifying quality problems and using the findings to persuade management that changes are necessary and justified.
CoQ measurements can be complex, as numerous departments and divisions carry out the process. Multiple reliable cost data sources exist within the company’s accounting system, including tables, expenditure reports, and purchase orders. Generally, conventional accounting systems provide information on quality control for direct labour, warranty charges, overhead, scrap, maintenance and repair, product liability costs, and calibration efforts on test equipment. Kumar and Alsada (Citation2019), Show that CoQ management is one of the essential tools for measuring, controlling, and making decisions in the company’s activities aimed at business excellence. Most businesses today face the difficult task of addressing the inadequacy of cost accounting systems in measuring CoQ, providing appropriate data in a proper format, and accounting for TQC, including hidden CoQ. In contrast, CoQ analysis helps companies identify areas for improvement and deficiencies in the costing system by providing a clear view of cost reduction opportunities in monetary benefits (Mahanty et al., Citation2012).
Industrial organizations have recently demonstrated an increasing interest in CoQ measurement. Nonetheless, most enterprises prefer the traditional costing system to the CoQ system. However, most of them are poorly designed and therefore unsuitable for this purpose. The main reason for the lack of interest in CoQ is an adequate and comprehensive quality costing system, which results from a lack of an accurate classification of the various quality control elements in the product life cycle (Nel & Pretorius, Citation2016; Yang, Citation2008).
Most of the previous studies that dealt with the process of measuring and analyzing items of CoQ focused on determining the level of application and practice of tangible CoQ on the one hand, and on the other hand, on measuring and analyzing items of hidden CoQ, CoQ models, determining CoQ items, CoQ behavioural, the effect of applying CoQ on sustainable advantage, the effect of applying CoQ in improving product quality, Long-run dynamics between CoQ and quality performance, etc. (Asada et al., Citation2021; Basak & Kg, Citation2015; Mantri & Jaju, Citation2017; Nel & Pretorius, Citation2016; Šatanová et al., Citation2015; Sturm et al., Citation2019; Tomov & Velkoska, Citation2022). For example, Šatanová et al. (Citation2015) conducted research in Slovakia to determine the level of understanding and application of CoQ control in major industrial enterprises (MIEs), and they found that the internal manufacturing problem gradually leads to customer dissatisfaction and the continuous loss of customers on a larger scale. Mantri and Jaju (Citation2017), conducted research in India to determine the CoQ practices of reputable and successful industries of different types, and found that major industrial firms practice CoQ, but still manual data mining despite applying advanced techniques.
To the best of the researcher’s knowledge, there are few empirical studies that investigate the level of application of visible and hidden CoQ, as well as the CoQ items, in MIEs, particularly in Yemen. Therefore, the current study seeks to solve the theoretical gap to determine the level of application and practice to measure and analyze the visible and hidden CoQ, and to determine the most important items of visible and hidden CoQ applied in MIEs in developing countries, such as Yemen.
This paper has been written on the assumption that MIEs in Yemen are interested in implementing CoQ practices using the traditional CoQ (PAF) model. This paper is also based on the assumption that Yemeni industrial companies are interested in implementing the practices of measuring hidden CoQ. As a result, the primary goal of this paper is to provide a clear picture of Yemen’s major manufacturing companies’ understanding and application of CoQ measures (prevention, appraisal, internal and external failure costs), as well as to validate these enterprises’ practices to measure hidden CoQ. Furthermore, the design of a framework that illustrates the concept of a mechanism for measuring CoQ stems from the unique circumstances of MIEs in Yemen. This study was conducted with a large manufacturer sample to determine CoQ’s current awareness and measurability. The purpose of this study was to answer the following fundamental question: “To what extent are CoQ measured, analyzed, and reported (prevention and appraisal costs, internal and external failures, and hidden CoQ) in MIEs of Yemen?”
As a research objective, large corporations were chosen. Even though there are only about 442 MIEs in Yemen, out of a total of 27,797 industrial companies, they account for 98% of Yemen’s economic capital.
A purposive sample was used as the sampling technique to select the sample respondents for the study. This study’s target population consisted of 21 MIEs from seven Yemeni districts. A sample of 340 respondents from Yemen’s top industrial companies was chosen to obtain nuanced data on measuring CoQ. Financial managers, cost managers, quality, and accounts in large industrial companies in Yemen, were the target respondents.
The research methodology went through three stages. In the first stage, a brief literature review on measuring the CoQ using knowledge summarization, synthesis, and measurement methods were prepared. In the second stage, a questionnaire was developed to conduct the empirical study, which represents an analysis of the state of the issue that was resolved within the practice of MIEs in Yemen. The CoQ measurement model was based on the traditional CoQ model (PAF) principles when working on the core part of the questionnaire (Prevention, Appraisal, Failure Costs). This question was graded using the drawing and description methods. In the final stage, a model was created to measure the elements of CoQ in MIEs.
2. Literature review
2.1. Cost of quality
According to most studies, Juran first proposed the concept of CoQ in the early 1950s (Asada et al., Citation2021). Several authors have written extensively on the idea of CoQ since then. CoQ is defined by Juran (Citation1951) as “the total of costs that would disappear if there were no quality issues”. The cost arises from increased spending on activities performed directly, rather than indirectly, to achieve the quality departments’ objectives (Asher, Citation1987). The poor CoQ of an organization is the difference between its actual operating cost and what it would be if its systems did not fail and its employees did not make mistakes (Modhiya & Desai, Citation2016). CoQ, defined by all product or service requirements established by the company and its contracts with customers and society, is a measure of costs specifically associated with the achievement or non-achievement of product or service quality, according to the American Society for Quality Control (ASQC). The sum of the costs of designing, implementing, operating, and maintaining the quality management system, as well as the costs of resources devoted to continuous improvement, non-value-added activities, product failure costs, system costs, and all other necessary costs (Dale & Plunkett, Citation1999). It would represent the difference between the actual cost of a product or service and the reduced cost if there were no possibility of poor service, product failure, or manufacturing flaws (Evans & Lindsay, Citation2011). The total conformance and non-conformance costs. Non-conformance costs are the price paid to avoid poor quality.
In contrast, conformance costs are the price paid to avoid poor quality caused by the product failing to meet customer requirements (Machowski & Dale, Citation1998). CoQ can thus be defined as the total cost incurred by organizations to avoid defective production, do things correctly the first time, and not guarantee quality. Schiffauerova and Thomson (Citation2006) classified CoQ models into five categories: Crosby’s model, the P-A-F model, Opportunity cost models, Process cost models, and ABC models. This study employs PAF, with quality costs classified as Prevention-Appraisal-Failure.
Prevention costs are associated with the design, implementation, and maintenance of the TQM system. Any action is taken to investigate, prevent, or reduce the risk of nonconformity or defect (Modhiya & Desai, Citation2016). Quality planning involves designing, implementing, and managing the quality system, auditing the course, supplier surveys, and process improvements (Ahmed Al-Dujaili, Citation2013).
Appraisal costs are associated with determining the process’s level of quality. The cost of assessing quality requirements includes, for example, the cost of verification and control performed at any stage of the quality loop (Modhiya & Desai, Citation2016). The costs associated with measuring, evaluating, and auditing products and raw materials in the factory to ensure compliance with quality standards and performance requirements (Ahmed Al-Dujaili, Citation2013). In other words, it is the detection of errors or defects in the incoming and completed material inspection by measuring conformity to the required level of quality (Jafari & Love, Citation2013).
Internal failure costs occur when work results fail to meet designed quality standards and are detected before transfer to the customer. The costs would disappear if the product were defect-free. The costs are incurred when products, components, and materials fail to meet quality standards before ownership transfer (Chopra & Garg, Citation2011). An organization’s costs are incurred due to nonconformities or defects at any stage of the quality loop, such as scrap, reworking, retesting, re-inspection, or redesign (Modhiya & Desai, Citation2016).
External failure costs are incurred when products or services fail to meet design quality standards. Still, they are not detected until they have been transferred to the customer through warranties, complaints, replacements or recalls, repairs, insufficient packaging, handling, and customer returns.
Most studies on the PAF model show an interrelationship between the CoQ categories. Increased investment in prevention and appraisal costs will likely lead to increased investment in failure costs by lowering the costs of internal and external failure costs. In other words, the more organizations focus on increasing investment in the prevention costs, the more likely this will lead to a gradual reduction in evaluation costs and thus internal and external failure.
2.2. Hidden CoQ
Industrial organizations are still oblivious to and uninterested in measuring hidden CoQ. These hidden costs, however, are significantly higher than those calculated using the traditional PAF model (Basak & Kg, Citation2015). In fact, the total hidden CoQ far exceeds the company’s profit margin, and if the company wishes to improve its competitive position, these hidden costs must be eliminated (Cheah & Shah, Citation2011). According to Gryna (Citation1999), hidden costs are three to four times as high as visible costs. Krishnan (Citation2006) estimates that these hidden costs range from three to ten times the cost of capital invested. This means that, according to most of the literature, the hidden CoQ are major compared to the visible costs, making them difficult to ignore (Basak & Kg, Citation2015; Campanella, Citation1999; Cheah & Shah, Citation2011). “Hidden cost” refers to failure costs that are not adequately recorded in company accounts or are never discovered. These “hidden” costs could take the form of additional manufacturing costs due to defects, or other costs for materials, machining time, and inventory space for scrapped and reworked parts (Murumkar et al., Citation2017). With proper planning, most of the hidden quality costs can be avoided. Better production scheduling, for example, eliminates losses caused by increased production. While increased storage periods due to excess products cause losses, these losses can be eliminated by excluding slow-moving items from future sales (Cheah & Shah, Citation2011). Certain elements known as hidden CoQ, the quantification of which is at best uncertain and subjective, are one of the major issues with estimating CoQ in businesses (Sansalvador & Brotons, Citation2013). Although it is difficult to measure and know, it exists and constitutes additional burdens on the institution, represented in the loss of reputation, a decrease in the profitability rate, lost sales, and other losses that the institution may bear if its attention is directed to identifying and measuring them. Hidden CoQ can be defined as money wasted on institutions that could have been invested in alternative opportunities and profits that should have been realized. According to Giakatis et al. (Citation2001), prevention, evaluation, and failure costs are not the only CoQ. Other hidden costs have been identified as manufacturing losses and design losses. It was discovered that design and manufacturing losses represent a significant amount of money and represent opportunities to save and improve capital. A company that values long-term performance and reputation must consider hidden costs as if they were as tangible as measurable costs (Rosenfeld, Citation2009).
2.3. CoQ measurement
Organizations that pay more attention to measuring CoQ achieve higher quality in terms of reliability and performance and lower cost in terms of lower failure costs (internally and externally). Measuring and reporting CoQ should be considered a critical issue for any manager seeking competitiveness in today’s markets. When it comes to CoQ, it is essential to understand that a single failure event can result in various costs (Schiffauerova & Thomson, Citation2006). (Tsai, Citation1998; Plunkett & Dale, Citation1988; Porter & Rayner, Citation1992; et al) Different approaches to CoQ measurement have been proposed since Juran (Citation1951) discussed the CoQ. Measured quality in two ways: by the incidence of internal failure and external failure costs. This measure is formally known as the poor CoQ /simply CoQ. According to Krishnan (Citation2006), three common factors when measuring CoQ are time (people, equipment, and space), service charges, and materials. Snieska et al. (Citation2013) argue that the process of addressing and measuring CoQ is limited to directly measurable and visible cost items and fails to address several areas of hidden cost, such as lost sales, reputational loss, loss due to low workforce morale, etc. Several CoQ items remain unknown, have not been quantitatively identified and analyzed, and activities related hidden CoQ have not been adequately evaluated (Jafari & Rodchua, Citation2014). According to Modhiya and Desai (Citation2016), the CoQ measurement should be part of any quality management program. While CoQ programs provide a suitable method for identifying and measuring CoQ, they also allow for targeted action to reduce CoQ. According to Chopra and Garg (Citation2011), CoQ is a cost-benefit analysis of the costs associated with the achievement or non-achievement of product or service quality. Represent the difference between the actual cost of a product/service and the reduced cost if there is no possibility of substandard service, product failure, or manufacturing defects. However, many argue that outputs may be measured in delivered product/functionality.
In contrast, resources may be measured in terms of effort/monetary cost. As a result, today’s organizations translate this new concept into observable and measurable elements to form a CoQ measurement index. Indicators for CoQ monitoring can be defined based on these. In this case, the CoQ calculation is carried out using the following formula:
Thus, Total quality costs = Prevention costs + Appraisal costs + Internal failure costs + External failure costs.
Furthermore, as illustrated in , the process of measuring CoQ is an essential component of the quality measurement system. The CoQ index is one of the most widely used methods for determining related CoQ based on its value. While these indicators are used to compare the change in quality levels from one period to the next and to compare organized departments and their functions, they also help determine the cost of achieving any level of quality.
Table 1. Indications of Measuring COQ
While a decrease in these percentages indicates a positive relationship between quality improvement and the costs associated with that improvement, an increase in these percentages indicates a negative relationship. The dollar, according to Evans, is the most widely used unit of measurement, and Juran used this index to determine quality. Simultaneously, the cost of defective items to the sales value is calculated. This percentage is calculated by subtracting (1) a correct number as follows:
The previous concludes that indicators for assessing CoQ are an essential tool that provides management with follow-up reports on CoQ, allowing departments to make the right decision at the right time.
2.4. Importance of CoQ measurement
Several authors have emphasized the importance of measuring CoQ and the benefits that accrue to the organization as a result of conducting measurements, including (Juran, Citation1951, p. 1989; Feigenbaum, Citation1956; Chen & Yang, Citation2002; Giakatis et al., Citation2001; Krishnan et al., Citation2000). While measuring CoQ is an essential part of the quality measurement process in industrial organizations, the goal of measuring CoQ is to determine the effectiveness of the quality system, identify areas of high cost, identify places that require additional investments, compare, analyze, and compare conformance costs with non-conformance costs (prevention, appraisal, and failure), maintain the historical trend, and provide a method for retaining pre-defined financial resources (making decisions related to capital and other investments, eliminating unnecessary overheads that result from activities not required by the customer, improving procurement costs, suppliers, planning profit, setting goals for the budget, ensuring the process of allocating expenditures to CoQ if they are correctly first, identifying the causes of poor quality).
Although most examples show that measuring CoQ in light of the availability of objective, strategic, and analytical tools leads to increased quality, incorrect processes significantly reduce the company’s quality degree toward excellence in quality. Most organizations, however, continue to disregard CoQ estimates (Asada et al., Citation2021; Harry & Schroeder, Citation2000). The lack of an appropriate, comprehensive system for estimating CoQ, which results from an accurate classification of the various CoQ elements throughout the product life cycle, is one of the primary reasons for companies’ lack of interest in measuring CoQ. (Yang, Citation2008). Many industrial companies are estimating their costs, which is becoming more common these days (Chiadamrong, Citation2003). The old CoQ (PAF) category system is insufficient for capturing genuine CoQ, necessitating system changes (Dahlgaard et al., Citation1992). Because CoQ can be distributed across multiple accounts, cost metrics for the entire production system must be updated. All expenditures associated with quality activities must be linked to design, production, sales, and service activities (Chiadamrong, Citation2003).
3. Research methodology
This research aims to determine the level of awareness and application of CoQ measurement in MIEs in Yemen. Simultaneously, the primary goal of this paper was to discover and determine the extent to which practices of measuring prevention and appraisal costs, internal and external failure, and hidden CoQ are implemented in Yemen’s major industrial companies. The core research group consisted of major Yemeni industrial enterprises. According to the Yemeni Ministry of Industry and Trade, the number of industrial companies in 2015 reached around 27,797, with 442 major industrial companies. Because of the large core group size, it was impossible to include all large companies in this research, so survey data was used for sampling. This study’s target population consists of 21 MIEs in Yemen. The sample was designed to include 340 respondents. The respondents were finance, cost, and quality managers from major Yemeni industrial enterprises. The number of returned and analyzable questionnaires was 208, representing a rate of approximately 61%.
4. The proposed questionnaire included 14 questions
Q1: Does your company interested in measuring the quality costs?
Q1a: Is your company interested in measuring prevention costs?
Q1b: Is your company interested in valuation measurement?
Q1c: Is your company interested in measuring the costs of internal failure?
Q1d: Is your company interested in measuring external failure costs?
Q2: Are you considered among the measures of prevention costs applied by your company?
Quality design and planning
Develop waste reduction systems.
The equipment design and development.
Quality review during the product design and development phase.
Calibration and maintenance of production equipment. Supplier audit costs.
Training costs to raise the quality level.
Defective production reduction costs.
Reduce wastage of time, materials, and effort.
Continuously reviewing product design and development.
Q3: Are you considered among the measures of appraisal costs applied by your company?
Pre-production inspection and evaluation costs.
Costs of checking product design before production.
Examination costs of materials received from suppliers.
Samples test of products during manufacture.
Test samples of products after manufacturing is completed.
Costs of materials consumed during the inspection and testing process.
Examination and evaluation costs after production are completed.
The stock assessment ensures that the stored products’ value does not fall.
Classification of products as good, defective, or damaged at a certain level of quality.
Costs of final inspection of products before supplying to stores.
The costs of analyzing examination and testing results and preparing reports on them.
Costs of materials used in the laboratory.
Q4: Are you considered among the measures of internal failure costs applied by your company?
Remanufacturing costs.
Cost of lost time due to quality issues.
Cost of inspection and testing of re-run products.
The cost of stopping the production process.
Loss and damage costs.
Find out the defective production to confirm and guarantee the quality.
Identify defective production and work to avoid it.
Inspection equipment maintenance. Substitute poor-quality materials to improve quality.
Scrapping costs.
Exclude damaged items that cannot be processed.
Determine the reasons that lead to poor quality.
Storage cost for raw materials that have become damaged.
Q5: Are you considered among the measures of external failure costs applied by your company?
Quality assurance costs before selling the product.
Inspection of products to avoid rejected and returned sales.
The cost of damaged products before selling.
Costs of reducing external failure to satisfy the customer.
After-sales services costs.
Reducing the number of complaints to satisfy customers. The cost of repairing and replacing inferior products.
Waivers are offered to customers to accept the defective products.
Compensations of provided to customers in the event of product failure.
Claims costs for settlement with the client.
Replacement costs for defective products during the warranty period.
Q6: Do you think your company is interested in measuring the hidden quality costs?
Q7: Are you considered among the measures of hidden quality costs applied by your company?
Identify lost sales.
Unused energy costs.
Accumulated inventory costs as a result of excessive unused purchases.
The cost of additional work is due to errors in the production schedule.
The cost of lost time is due to machines stopping due to design, program or maintenance errors. The cost of waste and unreported errors by the departments.
The cost of losing the reputation of the entity.
The cost of losing the product to the market.
The cost of losing a portion of the market share.
The costs of not being competitive in the market.
Q8: Do you think measuring CoQ reduces the cost of defective production?
Q9: Do you think that measuring CoQ leads to improving product quality?
Q10: Do you think that measuring CoQ leads to customer satisfaction?
5. Discussion of results
CoQ Measurement
This section of the analysis validates the practices of MIEs in Yemen for applying CoQ measurement (prevention, appraisal, internal and external failure costs) . According to the responses collected from respondents, the majority of respondents, 78%, agree that their organizations measure CoQ. It was 10% of the sample did not provide clear and specific answers. In comparison, only 12% of those polled did not agree with this statement (). This analysis confirms that most of the MIEs in Yemen focus on measuring and analyzing visible CoQ (), due to the ease of their identification (Mantri & Jaju, Citation2017). Despite the interest of these enterprises in measuring and analyzing CoQ, the process of extracting data related to this process is still manual. Figure This makes this process more complicated. Therefore, it is preferable for these enterprises to separate the data of CoQ items from the traditional costing system (Mantri & Jaju, Citation2017).
Figure 1. Proposed framework.
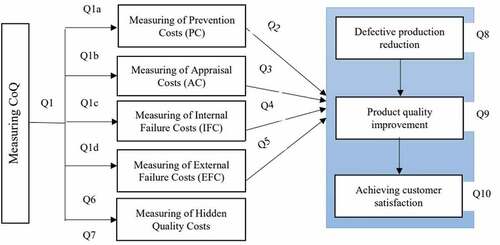
Figure 2. Q1: Does your company interested in measuring the quality costs?.
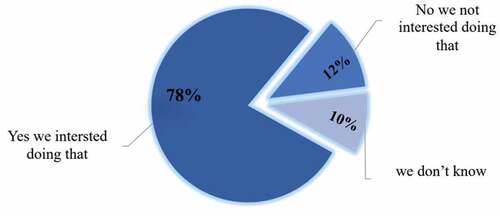
Table 2. Quality cost measures applied in major industrial companies in Yemen
shows the percentage of respondents’ answers to the sub-questions Do industrial enterprises handle the measurement and analysis of individual groups of costs in terms of the PAF model methodology? According to the findings, these institutions pay more attention to controlling the input costs of prevention and hence the failure costs.
Figure 3. Questions Q1 (A, B, C, and D).
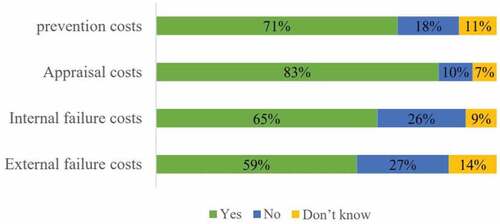
According to the findings , enterprises are paying more attention to measuring conformance costs (prevention and appraisal), which leads to a gradual decrease in failure costs (internal and external), which corresponds to the PAF model’s fundamental assumptions these findings are supported (Alglawe et al., Citation2017). Furthermore, this is a good indicator of long-term improvement in the quality of institutional performance, which means that over time, these enterprises can reduce the cost of internal and external failure without increasing spending on prevention and appraisal costs (Sturm et al., Citation2019).
Figure 4. Percentage of individual observed groups on CoQ.
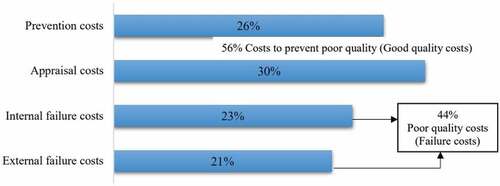
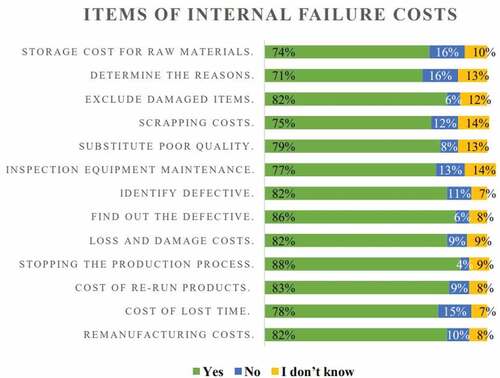
shows the percentage of respondents’ answers to questions Q2—Q5. This included questions on 47 scales. The goal was to identify the visible CoQ items used in research firms.
Figure 5. Q2: Are you considered among the measures of prevention costs applied by your company?
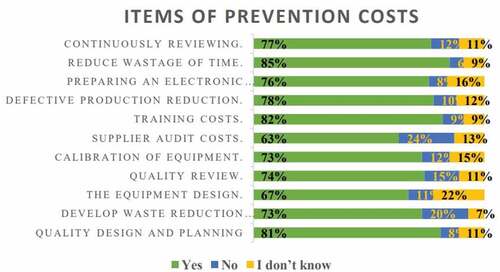
Figure 6. Q3: Are you considered among the measures of appraisal costs applied by your company?
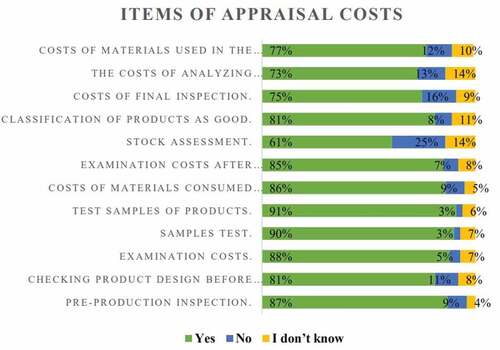
Figure 7. Q4: Are you considered among the measures of internal failure costs applied by your company?
The most important CoQ items used in MIEs in Yemen have been identified based on these findings. In the prevention phase, these businesses prioritize quality planning, design expenditures, and employee training to improve quality.
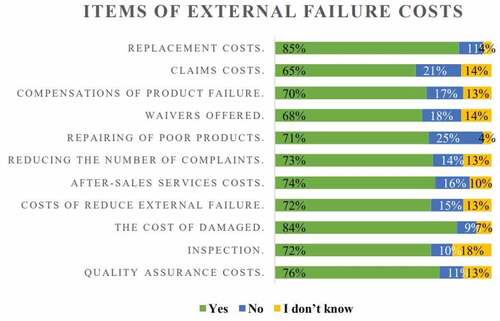
To reduce defective products, the appraisal phase focuses on testing and inspecting the equipment and materials used in production before the production process begins. Identify the reasons that lead to the emergence of poor quality products during the internal failure stage in order to reduce the percentage of defective products and improve the quality level. Determine the cost of compensation that customers receive if the product fails in the external failure stage to avoid the costs of lawsuits to be settled with customers.
According to these findings, most MIEs in Yemen typically focus on measuring visible CoQ (), that can be easily identified and recovered, and as a result, the desired outcome of this process is to improve quality at a lower cost, and the efforts are not fully met. Furthermore, if the most important cost items that contribute the greatest share of CoQ are identified, the analysis can focus on these most important items without compromising the results (Mantri & Jaju, Citation2017).
5.1. Measuring hidden CoQ
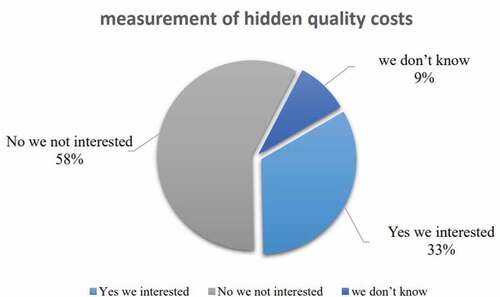
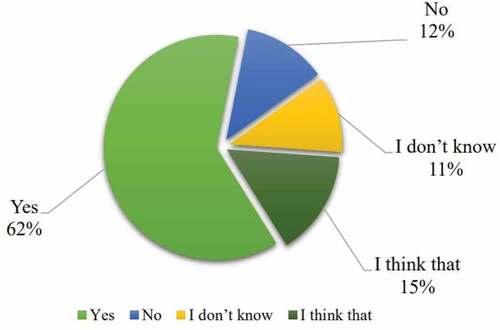
The extent to which the companies under study implement and practice the measurement of hidden CoQ is investigated in this analysis section. On the other hand, the extent to which the CoQ items relating to hidden CoQ are applied is tested. As illustrated in , most study sample members agree that their companies are still uninterested in measuring hidden CoQ. With an approval rating, a minority of respondents agree that their companies measure hidden CoQ (33%).
Figure 8. Q5: Are you considered among the measures of external failure costs applied by your company?
While the majority of them agree that their companies are still uninterested in measuring hidden CoQ at an unsatisfactory rate (58%). Knowing that 9% of the study sample did not provide clear answers about whether or not their company was interested in measuring hidden CoQ. This indicates that the study sample members confirm that Yemen’s major industrial companies are still unaware of and interested in implementing hidden CoQ.
To confirm the validity of this assumption, the analysis of the Q7- Do you think your company is interested in measuring the hidden CoQ items?
Q7 included ten paragraphs that addressed how committed the companies under study are to implementing the hidden CoQ items. Figure depicts the study sample results and the degree of agreement on whether or not these companies apply the hidden CoQ items.
Figure 9. Q6: Do you think your company is interested in measuring the hidden CoQ?
shows that the study sample agrees that their companies are still not getting enough attention to measure hidden CoQ. The approval rate was low, averaging 29%, while the rejection rate was high, averaging 61%. In contrast, 10% did not appear to have clear answers.
Figure 10. Q7: Have you considered among the measures of hidden CoQ applied by your company?
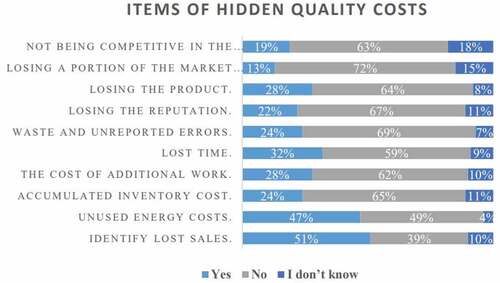
This means that most industrial enterprises still focus on treating visible CoQ only, for the ease of their identification, without paying attention to addressing hidden CoQ, due to the difficulty of the process of measuring and analyzing the items of these costs (Basak & Kg, Citation2015; Mahmood & Kureshi, Citation2015).
summarizes the essential items of hidden CoQ that are still not used in Yemen’s major industrial companies.
Table 3. Unapplied Hidden CoQ items in Major Industrial Companies in Yemen
demonstrates that the process of addressing and measuring CoQ is still limited to the visible and directly measurable cost items, as well as the failure of these enterprises to address several areas of hidden cost, such as lost cost of sales, loss of reputation, loss of a portion of market share, and loss due to low workforce morale, among other things (Snieska et al., Citation2013). Several CoQ items remain unknown, have not been quantitatively identified and analyzed, and activities involving hidden CoQ have not been adequately evaluated (Jafari & Rodchua, Citation2014).
The measure of CoQ to improve product quality and achieve customer satisfaction
Figure 11. Q8: Do you think measuring CoQ reduces the cost of defective production?
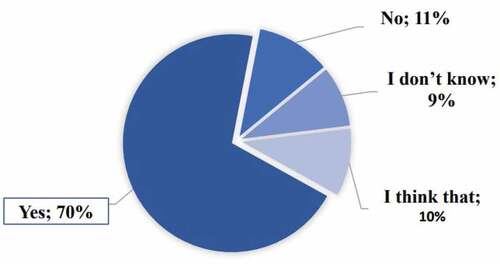
In this section of the analysis it is checked whether measuring CoQ leads to a reduction in defective production, improved product quality, and increased customer satisfaction. Q8 the Impact of measuring CoQ on reducing defective production costs is tested. According to these findings, most companies support that increasing investment in CoQ, and focusing on measuring items of these costs leads to fewer defective products, which leads to cost savings. For example, the analysis of previous results indicated that these enterprises are increasing spending on prevention and appraisal costs by developing waste reduction systems, calibrating and maintaining production equipment, and reducing waste of time, materials, and effort. All in all, it reduces defective products. This means that measuring CoQ leads to a decrease in the total CoQ (Chiu & Su, Citation2010).
Figure 12. Q9: Do you think that measuring CoQ leads to improving product quality?
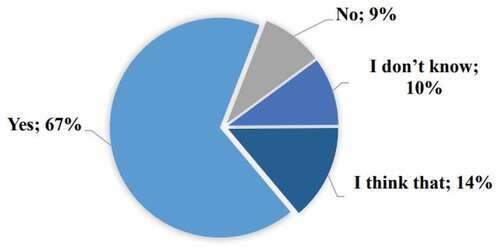
According to these findings, most enterprises support that focusing on CoQ items leads to an increase in quality, increased customer satisfaction, and thus an increase in sales volume, which leads to an increase in profitability.
For example, an analysis of previous results revealed that these enterprises increase spending on prevention and appraisal costs by focusing on product quality planning and design in the early stages of the manufacturing process to avoid product failure, holding training courses to increase employee efficiency to improve the level of quality, and conducting a continuous review for product design and development. This, in turn, leads to an increase in product quality, which leads to increased customer satisfaction.
Figure 13. Q10: Do you think that measuring the CoQ leads to customer satisfaction?
Although industry professionals recognize that increased quality should result in lower failure and opportunity costs as well as increased customer satisfaction. They are, however, still unaware of the significance of distinguishing between operating costs and quality in order to determine the type of relationship between the apparent and hidden CoQ (Alglawe et al., Citation2017).
6. Model for controlling quality costs in large industrial companies
The cost estimation system is an integral part of the management system in any industrial organization, providing relevant information to assist managers in making better decisions. Furthermore, the CoQ system is critical in helping senior management make financial decisions, improve product quality, and influence the organization’s profitability and market share expansion.
According to various authors, the CoQ system can balance quality and cost and improve product quality compared to traditional costing systems. The CoQ system generates precise data that can be used for performance measurement, cost control, and strategic decision-making. Furthermore, the CoQ system assists organizations in lowering costs and improving product quality, resulting in increased customer satisfaction and the ability to measure performance and profitability. The proposed model for measuring CoQ for large manufacturers comprises components that consider the quality of business processes and bookkeeping, as shown in . Control and quality must be linked for a complex understanding of CoQ measurement, taking into account the re-evaluation of the content of individual nominal ledger analytical accounts, their target selection, and departmental analysis concerning CoQ.
Figure 14. Model of the measuring CoQ for the major industrial companies.
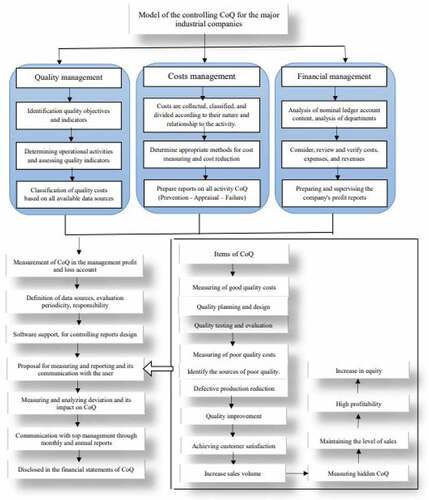
depicts a transparent CoQ control model commonly used in large manufacturing firms. The model connects the operational and bookkeeping aspects (identification of individual analytical accounts). depicts the transport corridor’s fundamentals regarding workflow determination. Profit and loss management is the starting point for evaluating the company’s results and measuring CoQ. Individual costs/revenues are incrementally adjusted to gross economic profit before taxes using this model (EBT). Profit and loss management is proposed as a grading of total revenue.
Determining the company’s information sources is a necessary task for determining CoQ. In addition to specifying the special analytical accounts and account documents. In the case of insufficient calculation documents, it is also recommended to consider data from the enterprise’s other record keeping (reports, statistical indicators, trend analysis).
When designing the model, the course of action is determined by collecting data on CoQ and the method for collecting this data. As a result, each item of CoQ must be classified according to the type of cost, whether it is materials, wages, services, or something else. In addition to identifying methods to make it easier for the observer to collect this data. Individual cost codes for quality should be defined.
CoQ information is extracted using the company’s information program or the PAF model. The control information system is one of the sources in this proposed model that makes it easier for the observer to evaluate the information obtained via a notification message. CoQ are monitored as a percentage of indicators of CoQ, as a ratio of hands to revenues, or as a ratio of indicators to total costs, rather than as absolute indicators in this proposed model. This proposed model can also be used in the accounting period to determine the differences between the acceptable values at the minimum and their cumulative total and compare between years.
The horizontal structure depicts the layout of the administrative profit and loss account, which reflects the annual budget plan, as well as the flexible budget (planned costs for the actual capacity of sales, calculation of prices, variances, reality, estimates, and the proposal of corrective measures in the future).
While the vertical structure proposes the control report in terms of measuring the increase in spending on the costs of good quality—prevention costs, appraisal costs (the costs of planning and designing quality, employee training costs to increase efficiency, testing and evaluating the quality level), and the gradual decrease in the failure costs (identifying the reasons that lead to the production of poor quality products, avoiding compensation costs and settlements with customers).
This entails analyzing costs using indicators to determine their impact on improving the level of quality through CoQ control that can be identified. The proposed model assists company managers in deciding whether to increase or decrease spending in each stage of CoQ separately.
One of the essential effects of CoQ control is to determine the savings obtained from measuring CoQ that result from lowering defective production costs by reducing internal errors, such as lowering (non-productive costs of materials, energy, and labor). As a result, external costs such as compensation and lawsuits for client settlement are eliminated or reduced. The proposed model demonstrates the effects of low failure costs and their impact on improving product quality, which leads to a reflection of the effect on achieving customer satisfaction and loyalty and then improving the institution’s good reputation, which leads to higher sales volumes can enhance its market competitiveness.
Through monthly monitoring reports, the proposed model enables senior management to discover differences from the planned conditions and discuss them positively or negatively, as well as prepare remedial measures to eliminate harmful disparities and improve positive effects.
depicts the impact of measuring hidden CoQ components on increasing profitability rates and equity. Measuring the visible CoQ differs from measuring the hidden CoQ in that paying attention to the apparent CoQ reduces defective production, which leads to improved product quality and higher annual sales volume.
While controlling the hidden CoQ does not affect the change in sales volume, it does allow for the analysis of the issues that led to a decrease in sales rate and a loss of market share. As a result, the proposed model emphasizes the importance of controlling the hidden CoQ and their impact on property rights as they increase or decrease. Due to their large size, industrial companies must focus on controlling the hidden elements of hidden CoQ, which if ignored may lead to their inability to continue in a highly competitive market.
7. Summary and conclusion
CoQ measurement practices in various organizations are still not standardized due to the lack of an appropriate and comprehensive system regulating these practices. This makes many industry organizations uninterested and aware of the importance of measuring CoQ elements. This exposes many industrial companies to increasing internal losses due to poor quality, which gradually leads to the continuous loss of customers on a large scale due to increased compensation claims and settlements with customers.
As a managerial contribution, the findings of this study will enable MIEs to improve the quality of their products in order to survive in a highly competitive environment. Industrial enterprises can achieve high levels of efficiency in their products while controlling failure costs if they are motivated to measure hidden CoQ and have an interest in measuring other CoQ.
Therefore, these companies must pay attention to measuring CoQ, whether these costs are tangible (visible) or intangible (hidden), to discover weaknesses and achieve preventive measures to eliminate these losses. All this can be achieved by establishing an effective feedback system, pointing out flaws promptly and providing valuable information to solve these issues.
The case study developed based on the reviewed literature is examined in this paper, emphasizing the CoQ subject. The questionnaire identified the extent to which Yemen’s major industrial companies are interested in measuring the visible and hidden CoQ and identifying the essential CoQ items used in these companies. A suitable model has also been proposed to assist large manufacturing companies in controlling the visible and hidden CoQ items.
This study revealed that the major industrial companies in Yemen pay attention to and realize the importance of measuring CoQ elements. They also estimate costs for prevention, appraisal, and internal and external failure. However, CoQ items are still integrated with the items of traditional costs, making extracting them a complex process and requires a large amount of time. Therefore, these industrial companies must implement an independent CoQ system to identify and treat issues easily.
Despite the satisfactory results indicated by this study regarding the interest of these companies in measuring the apparent CoQ, at the same time, these companies are still ignorant of the importance of measuring hidden CoQ elements and the profits that can be achieved through measuring hidden CoQ.
Disclosure statement
No potential conflict of interest was reported by the author(s).
Additional information
Funding
Notes on contributors

Riyadh Y. Alsada
Riyadh Yahya Alsada received his Master’s degree from Mysore University, India. He is currently waiting for received his Ph.D. from Mangalore University, India. Also, a lecturer in accounting department at the University Ibb, Yemen. His research interests include the Administrative Accounting, Cost Accounting, Total Quality Management (TQM), Total Quality Costs (TQC), and Industrial Enterprises.
Yathish Kumar
Yathish Kumar received his Ph.D. from Mangalore University, India, and a Master’s degree from Mangalore University, India. He is currently Coordinator, Associate Professor and Research Guide in the Department of PG Studies in Commerce, University College, and Mangalore, India. Also, the external examiner for various universities. His research interests include the HR management in cooperative sector, marketing and financial management.
References
- Ahmed Al-Dujaili, M. A. (2013). Study of the relation between types of the quality costs and its impact on productivity and costs: A verification in manufacturing industries. Total Quality Management & Business Excellence, 24(3–4), 397–23. https://doi.org/10.1080/14783363.2012.669552
- Alglawe, A., Schiffauerova, A., & Kuzgunkaya, O. (2017). Analysing the cost of quality within a supply chain using system dynamics approach. Total Quality Management & Business Excellence, 30(15–16), 1630–1653. https://doi.org/10.1080/14783363.2017.1400376
- Asada, R., Kumar, Y., & Al-Hubaishi, W. (2021). A review: Models costing quality and its impact on the planning and control processes in manufacturing industries. International Journal of Research - GRANTHAALAYAH, 9(4), 557–570. https://doi.org/10.29121/granthaalayah.v9.i4.2021.3858
- Asher, J. M. (1987). Cost of quality in service industries. International Journal of Quality & Reliability Management, 5(5), 9–17.
- Basak, P. C., & Kg, V. (2015). Costs of quality: Exploratory analysis of hidden elements and prioritization using analytic hierarchy process. International Journal of Supply and Operations Management, 1(4), 489–506.
- Campanella, J. (1999). Principles of quality costs: Principles, implementation, and use (3rd ed.). American Society for Quality.
- Cheah, S. J., & Shah, A. (2011). Tracking hidden quality costs in a manufacturing company: An action research. International Journal of Quality & Reliability Management, 28(4), 405–425. https://doi.org/10.1108/02656711111121816
- Chen, C. C., & Yang, C. C. (2002). Cost-effectiveness based performance evaluation for suppliers and operations. Quality Management Journal, 9(4), 59–73. https://doi.org/10.1080/10686967.2002.11919036
- Chiadamrong, N. (2003). The development of an economic quality cost model. Total Quality Management & Business Excellence, 14(9), 999–1014. https://doi.org/10.1080/1478336032000090914
- Chiu, Y., & Su, D. (2010). Considering quality cost, time-value of money, and process quality improvement function in the economic product quantity model. Journal of the Chinese Institute of Industrial Engineers, 27(4), 249–259. https://doi.org/10.1080/10170661003679026
- Chopra, A., & Garg, D. (2011). Behavior patterns of quality cost categories. The TQM Journal, 5, 510–515.
- Dahlgaard, J. J., Kristensen, K., & Kanji, G. K. (1992). Quality costs and total quality management. Total Quality Management, 3(3), 211–221. https://doi.org/10.1080/09544129200000029
- Dale, B. G., & Plunkett, J. J. (1999). Quality Costing (3rd ed.). Routledge. https://doi.org/10.4324/9781315245515
- Evans, J. R., & Lindsay, W. M. (2011). Managing for Quality and Performance Excellence (8th ed. Cincinnati, OH.
- Feigenbaum, A. V. (1956). Total quality control. Harvard Business Review, 34, 93–101.
- Garvin, D. (1984). What Does “Product Quality” Really Mean? MIT Sloan Management Review, 26, 25–43.
- Giakatis, G., Enkawa, T., & Washitani, K. (2001). Hidden quality costs and the distinction between quality cost and quality loss. Total Quality Management, 12(2), 179–190. https://doi.org/10.1080/09544120120011406
- Gryna, F. M. (1999). Quality and costs. In J. M. Juran & A. B. Godfrey (Eds.), Juran’s quality handbook (5th ed., pp. 8.1–8.26). McGraw-Hill.
- Harry, M. J., & Schroeder, R. (2000). Six sigma: the breakthrough management strategy revolutionizing the world’s top corporations. new york: doubleday. Random House.
- Jafari, A., & Love, P. E. (2013). Quality costs in construction: A case of Qom Monorail Project in Iran. Journal of Construction Engineering and Management, 139(9), 1244–1249. https://doi.org/10.1061/(ASCE)CO.1943-7862.0000704
- Jafari, A., & Rodchua, S. (2014). Survey research on quality costs and problems in the construction environment. Total Quality Management & Business Excellence, 25(3–4), 222–234. https://doi.org/10.1080/14783363.2013.824715
- Jaju, S. B., Mohanty, R. P., & Lakhe, R. R. (2009). Towards managing quality cost: A case study. Total Quality Management, 20(10), 1075–1094. https://doi.org/10.1080/14783360903247122
- Juran, J. M. (1951). Juran’s Quality Control Handbook. McGraw-Hill.
- Krishnan, S. K. (2006). Increasing the visibility of hidden failure costs. Measuring Business Excellence, 10(4), 77–101. https://doi.org/10.1108/13683040610719290
- Krishnan, S. K., Agus, A., & Husain, N. (2000). Cost of Quality: The Hidden Costs. Total Quality Management, 11(4), 844–848. https://doi.org/10.1080/09544120050008309
- Kumar, Y., & Alsada, R. (2019). Quality Costs and its impact on competitive advantages in Manufacturing Industries: A. Journal of Toucan Research & Development, 23(5), 1–12. https://www.researchgate.net/publication/338253584
- Machowski, F., & Dale, B. G. (1998). ‘Quality Costing: An Examination of Knowledge, Attitudes, and Perceptions’, Quality Management Journal, Vol. 5, No, 3, 84–95.
- Mahanty, B., Naikan, V. N. A., & Nath, T. (2012). System dynamics approach for modeling cost of quality. International Journal of Performability Engineering, 8(6), 625.
- Mahmood, S., & Kureshi, N. I. (2015). A literature review of the quantification of hidden cost of poor quality in the historical perspective. Journal of Quality and Technology Management, 11(1), 1–24.
- Mantri, S., & Jaju, S. (2017). Cost of quality management in Indian industries: A practical insight. International Journal for Quality Research, 11(3), 491.
- Modhiya, S., & Desai, D. (2016). A review on cost of quality methodology and hidden costs in manufacturing industries. REST Journal on Emerging Trends in Modelling & Manufacturing, 2(4), 87–94.
- Murumkar, A., Teli, S. N., Bhushi, U. M., & Deshpande, A. S. (2017). The hidden cost of quality: A review. In Presented at 11th ISDSI International Conference, At IIM, Trichy–Tamilnadu.
- Nel, H., & Pretorius, J. H. (2016). The design of Qtrac: An automated quality and cost management system for projects. In Proceeding of the International Conference on Industrial Engineering and Operations Management (Vol. 169).
- Plunkett, J. J., & Dale, B. G. (1988). Quality costs: A critique of some ‘economic cost of quality’ models.International Journal of Production Research. 26, 11, 1713.
- Porter, L. J., & Rayner, P. (1992). Quality Costing for Total Quality Management. Institutional Journal of Production Economics, 27(1), 69–81. https://doi.org/10.1016/0925-5273(92)90127-S
- Rosenfeld, Y. (2009). Cost of quality versus the cost of non‐quality in construction: The crucial balance. Construction Management and Economics, 27(2), 107–117. https://doi.org/10.1080/01446190802651744
- Sansalvador, M. E., & Brotons, J. M. (2013). Quality cost analysis: A case study of a Spanish organization. Total Quality Management & Business Excellence, 24(3–4), 378–396. https://doi.org/10.1080/14783363.2012.734951
- Šatanová, A., Závadský, J., Sedliačiková, M., Potkány, M., Závadská, Z., & Holíková, M. (2015). How Slovak small and medium manufacturing enterprises maintain quality costs: An empirical study and proposal for a suitable model. Total Quality Management & Business Excellence, 26(11–12), 1146–1160. https://doi.org/10.1080/14783363.2014.916477
- Schiffauerova, A., & Thomson, V. (2006). A Review of Research on Cost of Quality Models and Best Practices. International Journal of Quality & Reliability Management, 23(6), 647–669. https://doi.org/10.1108/02656710610672470
- Snieska, V., Daunoriene, A., & Zekeviciene, A. (2013). Hidden Costs in the Evaluation of Quality Failure Costs. Engineering Economics, 24(3), 176–186. https://doi.org/10.5755/j01.ee.24.3.1186
- Sturm, S., Kaiser, G., & Hartmann, E. (2019). Long-run dynamics between cost of quality and quality performance. International Journal of Quality & Reliability Management, 36(8), 1438–1453. https://doi.org/10.1108/IJQRM-05-2018-0118
- Tomov, M., & Velkoska, C. (2022). Contribution of the quality costs to sustainable development. Production Engineering Archives, 28(2), 164–171. https://doi.org/10.30657/pea.2022.28.19
- Tsai, W. H. (1998). Quality Cost Measurement Under Activity-Based Costing. International Journal of Quality & Reliability Management, 15(7), 719–732. https://doi.org/10.1108/02656719810218202
- Yang, C. C. (2008). Improving the definition and quantification of quality costs. Total Quality Management, 19(3), 175–191. https://doi.org/10.1080/14783360701600563