?Mathematical formulae have been encoded as MathML and are displayed in this HTML version using MathJax in order to improve their display. Uncheck the box to turn MathJax off. This feature requires Javascript. Click on a formula to zoom.
Abstract
This paper aims to examine macroeconomic and bank-specific determinants of non-performing loans (NPLs) in the case of the Republic of North Macedonia. Following the respective literature review that indicates the GDP and the unemployment rate as the most relevant macroeconomic variables, and weighted average interest rate, gross loans, and lagged NPLs as the bank bank-specific ones, we apply an ARDL bounds testing approach to investigate the determinants of NPLs of this landlocked, new NATO member country that seeks access to the EU. The studied period is from the first quarter of 2005 to the second quarter of 2022, which includes apart from the severe financial crises, i.e. the Global Financial Crisis (GFC) of 2007–2009 and the European Sovereign Debt Crisis of 2010–2012, the Pandemic Covid-19 period and the Russian Invasion of Ukraine. Our research output provides statistical evidence that the strongest long-run impact on NPLs comes from unemployment, GDP and interest rates; while Gross Loans seem not to have any significant effect. Our findings, holding both in the short- and the long-run, bear signs that are consistent with the economic theory. Overall, we add in the understanding, measuring, and forecasting of NPLs in a country under transition, and propose corrective macroeconomic policy measures in mitigating the related pressure and shocks, especially under periods of prolonged uncertainty.
PUBLIC INTEREST STATEMENT
A description of your paper of NO MORE THAN 150 words suitable for a non-specialist reader, highlighting/explaining anything which will be of interest to the general public
A nonperforming loan (NPL) is a loan in which the borrower has not made any payments of principal or interest for a certain period. In banking, commercial loans are considered nonperforming if the borrower is 90 days past due. NPLs occur during economic hardships and should be used under a proper credit portfolio assessment. They are crucial in ensuring each bank’s long-term solvency and the stability of the banking sector. Thus, it is important to investigate their determinants, the macroeconomic and the bank-specific ones, for the case of a landlocked country under transition, a new NATO member country, seeking access to EU. The studied period, including the Global Financial Crisis (2007–2009) and the European Sovereign Debt Crisis (2010–2012), the Pandemic and the Russian Invasion of Ukraine, makes our results valuable to the policymakers and stakeholders, given that we understand, measure and forecast their responsiveness to specific factors.
1. Introduction
Banks, as has been generally accepted, are considered to be one of the main drivers of economic progress and are expected to be stable and prudent, especially in periods of increased turbulence; as reflected on the impact of geopolitical risks on various financial assets (Li et al., Citation2021; Mitsas et al., Citation2022), and uncertainty, which impacts macroeconomic and financial variables (Beladi et al., Citation2021; Gabauer & Gupta, Citation2020; Gupta et al., Citation2018; Ma et al., Citation2021; Al Rababa’a et al., Citation2022; Zhang et al., Citation2021) across countries and markets (Castelnuovo et al., Citation2017; Kang et al., Citation2021; Al Rababa’a et al., Citation2022), causing various contagion effects (Al-Yahyaee et al., Citation2019; Boako et al., Citation2019; Demiralay & Golitsis, Citation2021; Guidolin et al., Citation2019; McMillan, Citation2019; Triki & Maatoug, Citation2021).
Thus, during and post the global economic and geopolitical crises, including the Global Financial Crisis (GFC) of 2007–2009, the European Sovereign Debt Crisis of 2010–2012, the Pandemic Covid-19 period and the Russian Invasion of Ukraine, banks are monitored closely in ensuring their good practices (Bitzenis et al., Citation2015; Golitsis et al., Citation2022). Within such a framework, non-performing loans (NPLs) should be used under a proper credit portfolio assessment and administration, and are crucial in ensuring not only each bank’s long-term solvency but the stability of the entire banking sector.
An open, small and landlocked economy as the Republic of North Macedonia (hereafter referred to as RNM), with a traditional banking system, that recently joined NATO, and seeks access to EU, is important to operate in a way that instills confidence and security by sustaining and gaining credibility; as such, and especially in a prolonged period of increase turbulence, makes it an interesting case in understanding, measuring and forecasting the responsivenss of NPLs of a Republic to various pressures. Thus, our interest in researching NPLs in this emerging economy, at this specific time, is important.
The banking sector in the RNM operates in traditional fashion by gathering deposits and issuing loans through 15 banks and 2 savings institutions (NBRNM, Citation2020, Citation2019; Spaseska et al., Citation2017). Within a less developed financial market, loans are the primary channel through which the banks invest their liquidity surplus. Subsequently, the banking system is tightly regulated by the regulatory body, the National Bank of the Republic of North Macedonia [i.e. the Central Bank (NBRNM)], which imposes operational cautiousness by assigning appropriate capital adequacy ratios. The level of NPLs in such a banking sector is a clear indicator of banks’ performance and profitability since NPLs directly affect a banks’ balance. The percentage of NPLs in total loans demonstrates a banks’ willingness to undertake and manage credit risk. This ratio also signals, however, the risk awareness and consequently possible profit loss in the context of opportunity cost (Boskovska & Gligorova, Citation2014; Jovanovic & Petreski, Citation2012; Nikolov & Popovska-Kamnar, Citation2016).
Our research attempts to empirically investigate the relationships amongst NPLs and macroeconomic variables such as GDP, unemployment rate, interest rates, and gross loans. We also add a dummy variable in further investigating the post-crisis and the related brain drain youth related migration. By using quarterly data from 2005 (Q1) until 2022 (Q2), and by starting at 2005 not only due to data availability but because in this year it has been estimated that 20% of university degree holders emigrated (Janeska et al., Citation2016), our study, to the best of our knowledge, is the first to model the relationships of these variables for this period, for this country, through an ARDL Bounds testing technique, including, as stated, apart from the severe financial crises of this period, i.e. the Global Financial Crisis (GFC) of 2007–2009 and the European Sovereign Debt Crisis of 2010–2012, both the Pandemic Covid-19 period and the Russian Invasion of Ukraine too. Similar papers were found on the subject of NPLs in North Macedonia, including Poposka (Citation2015) and Nikolov and Popovska-Kamnar (Citation2016), but their variables are different and they applied descriptive statistics and classical linear regression. It has to be noted that Kjosevski et al. (Citation2019) have applied an ARDL, but they have done so under a different specification and for the period of 2003 to 2014. In our modeling, following the bounds testing approach to co-integration (introduced by Pesaran, Pesaran et al., Citation2001) we examine the short-run and the long-run impact of only statistically significant selected macroeconomic and financial variables, i.e., of unemployment, GDP, gross loans, and interest rates, on NPLs, which are all having signs that our consistent with the economic theory. As expected, this approach is perceived as a better fit to the data set when the sample size is rather small which it is in our case.
The extended empirical literature on this research area suggests that the macroeconomic and financial factors strongly affect bank industry performance and vice versa. Additionally, the expectation of a near-future integration of the country not only in NATO, but the European Union as well, generates a need in understanding these relationships further in order to manage more effectively and propose specific policy measures that could mitigate the pressure of the future fluctuations.
In general, the increase of unemployment, interest rates, and gross loans are expected to increase the NPL ratio, whereas a GDP increase is expected to drive it down (Gulati et al., Citation2019; Naili & Lahrichi, Citation2020; Saba et al., Citation2012). The dummy variable, used in the sense to capture both post-crisis and brain drain youth related migration, is expected to have a negative significant impact on NPLs, due to the relatively massive migration and repatriation of income earned abroad (inter alia Kjosevski et al., Citation2019; Kuzucu & Kuzucu, Citation2019; Messai & Jouini, Citation2013; Raddant, Citation2016; Tanasković & Jandrić, Citation2015).
Overall, our research contributes to this area by empirically investigating the NPLs determinants under investigation in the case of the RNM. Econometric research output for the country is rather scarce and thus, by examining these macroeconomic relationships econometrically for a period spanning from 2005 to 2022, the literature will be enriched.
Additionally, the expected accession of the country, as stated, apart from NATO, to EU as well, could increase further the migration rates in the future years. Subsequently, this investigation becomes more interesting and prevalent for future policymaking. However, it is also expected, in a counterbalancing way, that the accession processes may increase investments and expenditure and thus, in turn, unemployment may decrease (e.g., Fiott, Citation2017; González et al., Citation2017). In this light, this paper, firstly, attempts to aid financial institutions by identifying and measuring the contributing factors that drive the NPLs over time. Secondly, internal banks’ policies in terms of loan approval can be amended accordingly in order to have more efficient approval processes and accurate predictions of possible NPLs. Thirdly, this research will assist policymakers and stakeholders by providing directions for maintaining stable economic growth, promote macroeconomic stability (for example, via increased foreign exchanges reserves, increased commitment towards the EU path, enhanced credibility, etc.), and stress the necessity of finding ways to lower the brain drain youth related migration. Furthermore, this study attempts to explain that unemployment may result in the emigration of skilled labour from the country, leading to the dearth of quality and skillful bank’s credit personnel, which in its turn may result in high non-performing loans.
The structure is as follows: the next reviews the relevant literature, while Sections 3 and 4 describe the data and methodology employed respectively, and Section 5 presents the empirical results. Finally, section 6 includes a discussion of the findings, their implications, limitations of the research, and concluding remarks.
2. Literature Overview
As economic theory in this research area is excessive and interconnected, our literature review will focus on the aspects that are specifically aligned with the aforementioned research purposes in the context of RNM; however, we will briefly review the broader non-performing loans related part in general and within Europe. Thus, in a European framework initially, the attention of European regulators, under an extensive financial crisis, including both the Global Financial Crisis (GFC) of 2007–2009 and the European Sovereign Debt Crisis of 2010–2012 and their aftermath, focused −apart from the lending practices in retail banking− on nonperforming loans (NPLs) and their management, which affected banks’ balance sheets (Bellotti et al., Citation2021). Banks’ asset quality which called for a more effective assessment and more transparent practices, both by the regulatory bodies and the accounting departments, combined with a period of historically low interest rates and low bank profitability, eventually drove to a general need for higher provisioning (Bolognesi et al., Citation2020).
According to economic theory and the respective literature, as stated, NPLs are mainly driven by macroeconomic variables, including GDP growth, unemployment, lending interest rate, household final consumption expenditure and inflation, and bank-related ones, such as bad management, market structure and banks’ capital to assets (D. Anastasiou et al., Citation2019; A. Ghosh, Citation2015; Louzis et al., Citation2012; Radivojević et al., Citation2019; Roland Beck et al., Citation2015a). Staehr and Uusküla (Citation2020) focusing on macroeconomic and macro-financial factors as leading indicators of NPLs provide similar evidence for the EU countries, stressing that apart from GDP growth, lower inflation and lower debt, sustain NPLs at comparatively low levels.
Moving to the focal country, i.e., the RNM, we will insist on the empirical research results, by analyzing and summarizing them as well. Located in southeast Europe, within the Balkan region, RNM is landlocked and, as such, has been involved historically in many disputes with neighbouring countries, foreign occupation, and regional alliances. Independence was gained in 1991 from the Yugoslavian Federation and the country became known as the Former Yugoslav Republic of Macedonia (FYROM) up to the summer of 2018 to early 2019. In January 2019 the country was renamed the Republic of North Macedonia, once the name dispute settlement with Greece had taken took place (for comparison reasons between North Macedonia and Greece for each crisis management see, Bitzenis et al., Citation2014). The population of the country is around two million people and is comprised of numerous ethnicities and nationalities (North Macedonia Country Review, 2018).
2.1. Economy and monetary policy
The RNM gained its monetary independence in 1992 after the disintegration of Yugoslavia. Monetary policy was primarily conducted by targeting the money supply to lower and stabilize hyperinflation. This policy did not, however, yield favorable outcomes and resulted, among other factors, in a negative GDP trend, volatile nominal exchange rates, and decreased foreign exchange reserves. Consequently, in 1996 the policy was altered by fixing the exchange rate of the domestic currency (the denar) to the German Deutsche Mark and subsequently to the Euro, providing space that promoted the desired stability and certainty of the system, which subsequently increased GDP and foreign reserves (Bogoev, Citation2009; Golitsis et al., Citation2020, Citation2021). A conventional peg with small margins was constructed aiming to protect the small but open economy from external shocks and this managed to bring inflation down to 3% in 1996. The openness and necessity of trade implied continuous currency exchange rate regime changes against which the selected policy provided protection and security (Jovanovic & Petreski, Citation2012).
After the global financial crisis of 2008, the economic growth in the country depicted decelerating trends and trajectories. Nonetheless, since the economy was characterized by low levels of public debt and a banking sector that favored domestic funding, minor policy changes resulted in rather quick stabilization of the financial crisis shocks with controlled and acceptable inflation levels. In the following years, the country experienced rather cautious monetary and fiscal policies, paired with a highly regulated and stable financial system, which resulted in modest but growing GDP despite low levels of foreign direct investments (FDIs) and increased public debt. Current GDP growth is mainly attributed to construction sector growth (North Macedonia Country Review, 2018). Furthermore, the stabilization of inflation appeared from late 2009, indicating that the monetary policies began to settle down by lowering interest rates. During this period fiscal policy went along with targets of low levels of budget deficits and the public debt was sustained at 20.6% of GDP in 2008. After the crisis, the imposed fiscal policy aimed at stimulating output and FDI, and lower unemployment, by supporting small and medium-size enterprises (SMEs), all resulting in increased amounts of public debt which reached 30.9% of GDP in 2012 (see Trenovski and Tashevska, Citation2015).
The country’s monetary policy is reflected in the Central Bank (CB) bills rate. Inasmuch, CB bills rate is reflected through political fluctuations, such as the war conflict of 2001, post-global financial crisis in 2009, and the domestic political crisis of 2016. In all situations, interest rates were raised accordingly in order to tighten monetary policy and consequently decrease inflation. CB bills rate were also used by commercial banks to determine their interest rates for both lending and borrowing and, thus, changes in CB bills rate were followed by respective changes in commercial banks’ rates (Petrevski et al., Citation2016). Furthermore, as a monetary policy tool, the CB bills rate represents a clear indicator in terms of preferred lending expansion or retraction used by the Central Bank (Nenovski et al., Citation2018). Additionally, the country’s weak capital market could indicate the importance of using the interest rate as primary monetary policy. Interest rates have successfully managed to control the level of foreign reserves and smoothed the foreign exchange rate related pressures. Despite the pegged exchange rate, however, NBRNM’s monetary policy is kept independent by targeting inflation. Foreign reserve levels seem to operate through changes in interest rates, i.e. CB bills rate (Jovanovic & Petreski, Citation2012), and mainly through Euribor (Golitsis, Citation2018; Golitsis et al., Citation2021; Peykov, Citation2022). Additionally, it has been outlined that by raising interest rates, inflation is bound to decline while consequently, the fiscal policy will operate as a substitute resulting in domestic output decline (Petrevski et al., Citation2016).
Overall, despite all its difficulties, the economy in the RNM is considered, broadly speaking, a rather stable one, with low but somehow constant growth, stable inflation rates, and a pegged exchange rate. In addition, as the country joined NATO, and is on the accession path towards the EU, the economy is expected to expand and comply with higher regulatory standards as required by the EU.
2.2. RNM Political situation
Political uncertainty has an impact not only on the local business environment in terms of expanding and investing in new projects but FDI as well, limiting, consequently, potential economic growth. The RNM gained its independence from Yugoslavia through a 1991 referendum; however, it was not recognized by the European Community at the time (presently the European Union-EU) due to a disagreement with regards to the use of the name “Macedonia” with Greece. In January 2019, a solution was adopted by all parties involved and thus the country is now eventually known as the Republic of North Macedonia. It is important to note that under this final name agreement the country can fully integrate into both NATO and eventually the EU.
Throughout the years that followed in 1991, the country experienced privatization of state enterprises and ethnic tensions that culminated with the war conflict of 2001. In resolving the conflict, the budget surplus from privatization was spent resulting in continuously growing budget deficits from then onwards. The country somehow managed to resolve the crisis by keeping inflation and budget deficits at satisfactory low levels (North Macedonia Country Review, 2018). Inasmuch, the budget recorded a 0.6% surplus in 2007 and only a 1% deficit in 2008 namely due to increased FDIs at the time (Gaber, Citation2009). Following the world economic crisis of 2008, and the inability of the government to secure an invitation for NATO entrance negotiations, major reforms took place aimed at securing socioeconomic peace in the country (but at the cost of an increased budget deficit). The nationalist party that governed at the time imposed rather irrational reforms in an attempt to secure its popularity amongst majority voters. Thus, numerous overpriced non-capital projects were selected, the number of public sector workers rose substantially, subsidies were provided for agriculture, start-ups, innovations, and small-medium enterprises, etc., many of which were related to fictitious or nonexistent investments (North Macedonia Country Review, 2018). The situation culminated with yet another crisis in 2015 when it was discovered that the government allegedly illegally wire-tapped over 20,000 people. Additionally, a vast array of illegal actions were discovered, performed by members of the ruling party, presenting the country as a risky investment opportunity (North Macedonia Country Review, 2018).
2.3. Demography and labor market conditions in RNM
The RNM is not attractive for immigrant workers and generally, it depends on its own population to drive potential growth. On the contrary, the population has a tendency to relocate to developed countries. It has been estimated that nearly 20% of university degree holders had immigrated abroad by 2005 (Janeska et al., Citation2016). The rather constant increase in immigration projects issues such as a future lack of innovative thinkers, slower research and development across industries, and a scarcity of educators for future generations all of which negatively affect economic growth and prosperity (Janeska et al., Citation2016; Lozanoska & Dzambaska, Citation2015).
According to the State Statistical Office, the last census conducted in the country was in 2002. Ever since, information about the active population has been made based on estimates and derived from various sources. With a monthly average net wage of around 390€, qualified labor tends to search for employment abroad. EU countries generally require employment permits or work visas for non-EU residents, thus securing citizenship and identification documents from some of the neighboring EU member states is an easier immigration path. Bulgarian citizenship and passports are being issued to RNM citizens for the sole purpose of smoother EU immigration. It has been estimated that around 100,000 passports had been issued by the end of 2006 with numbers growing ever since (Neofotistos, Citation2009). With respect to statistical records, dual citizenship is not a record that is kept by the State Statistical Office or any other institution in the country. Thus, information about migration is generally considered inaccurate since people that emigrate out of the country do so with dual citizenship documents, usually Bulgarian. Additionally, they are recorded as Bulgarians in any other statistical records for population movement purposes.
Last, but not least, Bucevska (Citation2010), by examining the migration tendencies of EU candidate countries to Germany, determined that migration flows to Germany depict constant increases from the RNM, while Petrevski et al. (Citation2016) determined the average period between graduation and first employment is around 25 months, with employment being the main migration motivator.
2.4. The RNM Banking Sector
The year 2000 marked the beginning of foreign direct investment (FDI) in the banking sector. Additionally, FDI contributed to the economy by introducing new practices and by modernizing the business-related processes (e.g., Bitzenis et al., Citation2012). Banks primarily issued loans mainly to the corporate sector constructing portfolios that were not very diverse. Consequently, during the privatization of large state-owned enterprises, many of those faced bankruptcy and thus they were unable to service the loans issued (Angelova & Boskovska, Citation2016). Furthermore, the supply of loans started to focus more on private entities and small-medium enterprises thereby generating major portfolio diversification. Retail lending increased rapidly during the period 2003–2008, since loan demand in the retail sector had not been previously met (Cikovic, Citation2016). Nevertheless, the majority of loans (66.3% in 2012) were issued by the three largest banks and corporate loans contributed to more than half of the gross loans outstanding (Boskovska & Gligorova, Citation2014). In gaining market share, in a market as limited as this, banks frequently offered benefits in terms of lowering interest rates and cost of loans thus making the products attractive to numerous clients. On top of that, loan products were delivered with a foreign currency clause (usually the Euro) and periods of fixed interest rates, in an attempt to make them more affordable and attractive (Delova-Jolevska & Andovski, Citation2015; Poposka, Citation2015).
After the 2008 crisis, the NBRNM imposed measures in order to decrease credit activities, such as obligatory deposits on a monthly level in accordance to current issued loans in the retail segment, and it also changed its methodology for determining the capital adequacy ratios and higher required reserves for foreign currency liabilities. Consequently, banks’ credit-issuing policies were constrained and the focus shifted towards nurturing the quality of the credit portfolios in both segments and restructuring it when necessary and possible (Boskovska & Gligorova, Citation2014). In an effort to facilitate the credit portfolios, manage credit risk more effectively and decrease NPLs, banks have welcomed the practices of constructing credit derivatives rather than following the more common way of selling the acquired collateral in order to cover outstanding claims (Sverko et al., Citation2010). Until October 2017 the banking system adjusted the interest rates according to the CB bills rate. Presently, the interest rate used is pegged to a referent value (most commonly the interest rate on denar deposits without a FX clause and CB bills rate for domestic currency products and 1 month and 6-month Euribor for products with a euro clause, increased by a predetermined margin.
2.5. NPLs-classification and current research
Within the banking sector and in accordance with Basel standards, loans are classified as NPLs when the borrower has not made any payments for the loan obligations (both principal and interest) for three consecutive months (90 days). In this respect, the credit repayment history of borrowers is being classified as A, B, C or D, with D being the riskiest category representing NPLs. This type of classification, which is formed by the Central Bank, following international standards, is used by the banks as a starting point in their evaluation processes. Furthermore, banks are not allowed to approve loans to clients classified as credit risk C or worse (Angelova & Boskovska, Citation2016). In the literature three main categories on the determinants of NPLs are located: macroeconomic, bank-specific and industry-related factors (Naili & Lahrichi, Citation2020). The most frequently used factors to gauge the variations of NPLs are briefly discussed below. GDP growth is the primary indicators to mirror the good status of business cycle. In this sense under good economic conditions households and firms seems to settle their obligations. As Quagliariello (Citation2007) argued, the NPLs swelled during economic slowdowns and the opposite happens during economic booms. In the same fashion Nkusu (Citation2011), examined 26 countries spanning between 1998 and 2009, and found that slower economic growth leads to higher NPLs. Most recent studies lend support to this argument (Dimitrios Anastasiou et al., Citation2016; Gulati et al., Citation2019; Kuzucu & Kuzucu, Citation2019; Vouldis & Louzis, Citation2018). In addition, unemployment seems that rather deteriorate NPLs. A lot of studies gave agreed upon this macroeconomic determinant and its direct positive linkage to bad loans (Dimitrios Anastasiou et al., Citation2016; Jabbouri & Naili, Citation2019; Klein, Citation2013; Kuzucu & Kuzucu, Citation2019; Rinaldi & Sanchis-Arellano, Citation2006).
There are several studies that have attempted to identify the relation between inflation and NPLs. However, their results are highly controversial. Some studies argued that higher inflation lead to higher levels of NPLs (Amit Ghosh, Citation2017; Amuakwa-Mensah et al., Citation2017; Jabbouri & Naili, Citation2019; Klein, Citation2013; Rinaldi & Sanchis-Arellano, Citation2006). On the contrary, some studies reports a negative relationship between inflation and NPLs (Gulati et al., Citation2019; Makri et al., Citation2014). Furthermore, interest rates also provide competing evidence that the higher the interest rates the higher the NPLs rates (Espinoza & Prasad, Citation2010; Messai & Jouini, Citation2013; Roland Beck et al., Citation2015a).
Regarding the evidence based on the specific region, there are several studies investigating the determinants of NPLs. Keeton (Citation1999) argues that higher credit growth will eventually lead to an increased number of NPLs if credit growth is guided by increased loan supply rather than loan demand. Conversely, credit growth caused by loan demand would imply an overall increase in economic growth and consequently consumption. Additionally, credit expansion may result in applications being improperly analyzed and approved by insufficiently trained employees in generally inefficient processes (Angelova & Boskovska, Citation2016; Erdinç & Gurov, Citation2016). In line with this, Nikolov and Popovska-Kamnar (Citation2016) provide evidence that NPLs remained stable during periods of economic growth in the case of RNM, and inflation seems not to be a factor since it is kept stable by the NBRNM. Delova-Jolevska and Andovski (Citation2015) examined the retail loan portfolio for Croatia, Serbia, and RNM, arguing that the NPL ratios can be determined by GDP, unemployment, and retail portfolio structure; econometric models, however, were not constructed and tested in their research. Also, in these papers, it has to be noted that increasing unemployment was not found to increase NPLs. Nonetheless, the level of unemployment was considered to be a rather inaccurate representation of the economic reality due to changes in statistical record-keeping and migration. However, the analysis of Kjosevski et al. (Citation2019) studying RNM during the period 2003Q4 to 2014Q4, provide evidence that unemployment, along with banks’ solvency, have a positive impact on the rise of non-performing loans. Poposka (Citation2015) empirically examined bank-specific key determinants of NPLs, defined as spreads of rates between credits and deposits for both domestic and foreign currency, personnel expenses/non-interest expenses, equity and reserves/assets, and liquid assets/total assets, and demonstrated a significant correlation amongst each variable, hence identifying them as major influencers of the level of NPLs in the RNM. Since NPLs were not significantly correlated to GDP, the methods for dealing with NPLs should be sought internally within the banking sector.
R. Beck et al. (Citation2015b) tested a series of macroeconomic determinants of NPLs inter alia GDP, nominal Effective Exchange Rate and Lending Interest Rate across 75 countries during 2005–2015. Their results depict that these variables significantly affect NPL ratios. With respect to the neighboring region, Peric and Konjusak (Citation2017) focused on the lag effect of credit expansion on NPLs in Central and Eastern European countries as a whole concluding that credit expansion affects NPLs within approximately two years’ time. While Mitrovic (2014) assesses the connection of both the financial and retail sectors through NPLs within the Balkan countries, the common financial indiscipline within the retail sector leads to liquidity problems and finally increases NPLs thus restricting a banks’ lending activities and limiting the possibility of growth, forcing non-financial companies to finance their growth through financial indiscipline, hence starting the cycle all over again.
3. Data
The selected macroeconomic explanatory variables of the NPLs are: GDP in the local currency (denar) and the unemployment rate (UN)Footnote1; bank industry-specific variables included are the total volume of gross loans issued to non-financial entities (GL) and weighted average interest rate (INT) offered by commercial banks to non-financial entities (Available at the appendix; )Footnote2 Data were collected from the official sites of the NBRNM (www.nbrm.mk) and the State Statistical Office (www.stat.gov.mk), on a quarterly basis for the period 2005(Q1)–2022(Q2), totaling 70 observations. The period was determined as such, apart from data availability, due to the intention to avoid the data disturbances connected with the war conflict of 2001. The variables of GDP and of gross loans to non-financial entities are available in current denar prices and logarithms are utilized, whereas NPL, unemployment rate, and interest rate are in percentages. In Table , we include the descriptive statistics of the investigated variables both in level and in their first difference (Available at the appendix; ), including the correlation matrix of all variables at level.
Table 1. Descriptive Statistics NPL, UN, LGL, LGDP, INT (in level)
Indicatively, it is worth reporting that the unemployment rate in the Republic of North Macedonia fell for the seventh consecutive quarter to 14.8% in the first quarter of 2022, compared to 16% a year ago, which is the lowest jobless rate since comparable data began in 2004 (the start date of our study is 2005), meaning that the country has renewed its jobless rate record low.Footnote3 The number of unemployed persons declined by 31.2 thousand to 119.6 thousand, and the number of employed also dropped by 102 thousand to 691.4 thousand. Meanwhile, the labour force participation rate edged down to 55.3% from 56% a year ago (State Statistical Office of the Republic of North Macedonia, 2022). Also, there is value to add that the minimum value of NPLs is the most recent one, and it is equal to 2.98%, while all variables, excluding gross loans, according to the Jarque–Bera statistics, are normally distributed at a 0.05 level of significance.
Finally, the dummy variable was constructed in an attempt to mainly capture the influences of increasing migration to EU countries. According to Gujarati (Citation2009), and as known, dummy variables are generally used for quantifying certain qualitative factors. In terms of our research, the dummy variable essentially divides the data sample into migration, not present (0) and migration present (1). Following different time periods and various tests, the dummy, assigned with value 1, eventually starts from 2007(Q1) and onwards denoting, for example, the entrance of Bulgaria in the EU, which, as stated, provided to RNM citizens the ability to use Bulgarian passports. Subsequently, the Bulgaria EU entry led to a relatively massive outward migration wave which was further boosted by or could be attributed to, the crisis and post-crisis effects within the country. Additionally, the dummy variable could be responsible for capturing the overall political changes and the broader dissatisfaction of the citizens of the country which further impact factors related to the migration decision-making processes.Footnote4
4. Methodology: The bounds testing co-integration approach. An ARDL
Provided that all variables are integrated either of order zero or one (i.e. two and not three levels of integration are present, and no variable is ), and once the co-integrating relations are detected within the bounds testing (ARDL) approach, we can examine the long-run impact of the selected macroeconomic and financial variables to NPLs. This approach is perceived as a better fit to the data set when the sample size is rather small, which is in our case (our data span is from 2005 to 2022). The ARDL on the bounds testing co-integration form, introduced, as stated, by Pesaran et al. (Citation2001), can be written as such:
where, are the long-run multipliers,
is the drift, and
is the white noise error. This form is called by Pesaran et al. (Citation2001) as a “conditional Error Correction Model (ECM)” and in practice is an “unrestricted ECM”, or an “unconstrained ECM”. An F-test will be used to test the following hypothesis, i.e.,
:
; against the alternative that
is not true. A rejection of
implies that a long-run relationship.
On top of that, and apart from the fact that the primary focus of our investigation is to detect the various country-specific key factors that NPLs are dependent on, thus allowing us to focus on one equation only, the Autoregressive Distributed Lag (ARDL) co-integration approach is chosen for the following additional reasons. First, it is a rather simple technique as opposed, for example, to multivariate co-integration procedures including the Johansen and Juselius (Citation1990) technique, given that co-integrating equations can be estimated by OLS once the lag order is identified. Second, no pretesting is needed, including the stationarity tests, given that the level of integration of the variables could be of any order provided, for the given though bound testing nature of the test (i.e., the procedure cannot be performed in the presence of series; see Ouattara, Citation2004).
5. Empirical findings
5.1. Unit root tests
The ARDL specification is founded on the assumption that the incorporated variables are either stationary in level or in their first difference. Thus, in testing, whether each variable is stationary, the ADF equation is estimated and the respective ADF t-statistic is compared at 1%, 5%, and 10% levels of significance and the respective pseudo-t critical values. The ADF regression functions, for each variable, are also being tested in having (or not) statistically significant intercepts, intercepts, and deterministic trends, or none of the above. The null hypothesis (i.e., : unit root is present) can be rejected if the ADF statistic is lower than the pseudo-t-critical value for any given level of significance or if the probability is lower than the respective level of significance (Gujarati, Citation2009).
The unit root ADF tests applied, suggest that at the 0.05 level of significance NPL is integrated of order one (i.e., , while
,
,
and
.
Still, given that is integrated of order zero at a 0.10 level of significance, we proceeded with the Zivot-Andrews unit root test which incorporates possible structural breaks (Eric & Donald, Citation2002). Based on this more sensitive and robust unit root test, the following table was generated (see Table ), which allows us to conclude on the level of integration providing grounds for the application of the bounds testing co-integration ARDL approach where no variable can be
Note that the Null hypothesis is that the investigated variable in level has a unit root with a structural break in both the intercept and trend for all variables, excluding LGL which has a unit root with a structural break in intercept, while the Null hypothesis for the first differenced variables is that it has a unit root with a structural break in the intercept for the UN and a structural break in both the intercept and trend for dLGDP.
Table 2. Zivot-Andrews Unit root test for LNPL, LUN, LINT, LGDP, LGL, and their first differences
Probability values are calculated from a standard t-distribution and do not take into account the breakpoint selection process
For the given outcome, presented in Table for variables in level, , LGDP and
are integrated either of order zero or of order one (at 0.01 level of significance and/or at 0.05 level of significance (for more detailed results see the appendix; Tables and Figures 5.1-5.7), and UN is having a probability value a bit higher than this level. Thus, we have taken the first difference of
, and according to the Zivot-Andrews Unit root test for
, with a structural break in the intercept, we have generated a t-statistic equal to −7.6507 and a probability value of 0.0479, which indicates that the series is stationary in its first difference (
, at 0.05 level of significance. The unit root tests on the first differenced variables are also applied for LGDP, checking the stationarity properties of this variable at 0.05 level of significance too; the t-statistic equals to −4.5562 and the probability value is 0.0158, indicating that the series is stationary in its first difference at 0.05 level of significance as well
Thus, overall, based on the above Zivot-Andrews Unit root test and the respective results, we have certainly grounds to proceed with the use of the bounds testing co-integration ARDL approach, given that all variables are integrated either of order zero or one (i.e. there are two and not three levels of integration present, and no variable is integrated of order two, i.e. ).Footnote5
5.2. The bounds testing co-integration ARDL results
Provided that we have discussed the nature and the reasons to use the bounds testing co-integration ARDL approach, and given that the estimation of the number of cointegrating vectors is not a prerequisite for applying it, we can proceed with the interpretation of the results, once we state the reasons why this estimation is not a prerequisite: First, the ARDL bounds testing approach can be based solely on its own mechanisms (i.e. the bounds F-test, the bounds t-test and the test on the joint significance of the coefficients of the first lag of the independent variables) in order to reliably identify the existence of a long-run relationship between the variables under examination. Second, the ARDL bounds testing approach can identify the existence of long-run relationships in any mixture of I(0) and I(1) variables, in contrast to the Johansen cointegration test which requires the use of I(1) and cointegrated variables only.
Thus, in order to ensure that we have captured the long-run impact of the selected macroeconomic and financial variables to NPLs, we need to ensure that the F-test will lead to a rejection of the following hypothesis as expected :
) (see the provided Equationequation 2)
(2)
(2) . A rejection of
, as stated, indicates that a long-run relationship between the variables is present. The estimated F-statistic is equal to 18.6097, which means, for the Critical values Bounds provided in Table , that
can be rejected, at 0.10, 0.05, 0.025 and 0.01 levels of significance, because the F-statistic is greater than the I(1) bound.
Table 3. The ARDL Critical Value Bounds
Still, on the ARDL literature (Kripfganz & Schneider, Citation2020; McNown et al., Citation2018; Sam et al., Citation2019) the bounds F-test alone appears that it cannot provide full evidence about the existence of a long-run relationship between a set of variables. Specifically, the rejection of the aforementioned H0 hypothesis (θ0 = θ1 = θ2 = θ3 = θ4 = 0) cannot exclude the following two possibilities that imply no long-run relationship between the variables under examination:
(1) The possibility that θ0 = 0, while at least one of θ1, θ2, θ3, θ4 is different from zero (θ0 is the coefficient of the first lag of the dependent variable, while θ1, θ2, θ3, θ4 are the coefficients of the first lag of the independent variables). This possibility cannot be excluded by checking visually the p-value of the long-run coefficient of the first lag of the dependent variable NPL in Table (Estimated ARDL Coefficients). Subsequently, a reliable way to exclude this possibility is by performing the “bounds t-test”, described in Pesaran et al. (Citation2001). As in the case of the F-statistic used in the bounds F-test, Pesaran et al. (Citation2001) provide two sets of critical values for the t-statistic, one that assumes that all variables are I(0) and another that assumes that all variables are I(1). Thus, the bounds t-test is performed, by using the above critical values for the t-statistic, in a similar manner as the bounds F-test, confirming the previous results.Footnote6
Table 4. Estimated ARDL Coefficients (in the short and the long run)
(2) The possibility that θ0 ≠ 0, while θ1 = θ2 = θ3 = θ4 = 0. This possibility can be excluded if at least one of the long-run coefficients of the independent variables is statistically different from zero, which is our case. Particularly, in Table (Estimated ARDL Coefficients), the long-run coefficients of the independent variables LGDP and UN are statistically significant at 0.10, even though the long-run coefficients of the remaining two independent variables (i.e. LGL and INT, respectively) are not.
Now that we have established that the long-run co-integration relation exists we can estimate and interpret the bounds testing co-integration ARDL equation, which in our case is the following:
where, are the long-run multipliers,
is the drift, and
t is the white noise error. This equation is estimated by an ARDL(1,3,2,2,0) specification, which is the long-run form, also known as the Error Correction form.Footnote7 The results, once we repeat that NPL is the dependent variable, are reported in Table , where only the statistically significant results are reported. It is important to stress though that the cointegrating equation is significant and bears a negative sign as expected (see Table ). The value of coefficient of CointEq(−1), being −1.10001, suggests that the speed of adjustment towards a long-run equilibrium is 110% or differently stated, the “system” adjusts or corrects its previous period disequilibrium at a speed of 110% within the period of one quarter. The t-statistic of the cointegrating equation is equal to −10.0035, and it is statistically significant, which gives statistical grounds to support that these findings hold in population as well.
Thus, according to Table , there appears to be a long-run relationship between economic growth, unemployment, interest rates, and non-performing loans with all variables bearing signs that are consistent with the economic theory. Specifically, the estimated coefficients are statistically significant and show that a long-run relationship exists and runs from economic growth to non-performing loans; showing NPLs are overresponsive to the GDP growth of the country; with the negative sign being consistent with the economic theory; a result and an interpretation that act, for the given robustness of the model, as a solid forecast mechanism, that stresses also the long transition of the country that managed to drove NPLs down, from a historical high of 16.1% to the current historical low of 2.98%. Also, to proceed, and in line with economic theory as well, a 1% increase in unemployment (UN) increases NPLs by 0.64%, and vice versa. Last but not least, a 1% increase of interest rates leads to a 3.47% increase of the current LNPLs, a finding which holds even at the 0.01 significance level, and shows that the variable under investigation is over-sensitive to the monetary policy conduct of the country and the changing values of the interest rate.
As far as the short-run results are concerned (according to the results on Table ), the strongest, statistically speaking, outcomes are the ones running from past unemployment, past interest rates, and the current and lagged GDP to non-performing loans. Specifically, in the short run, a 1% increase of UN lead to an increase of NPL by 0.46% after two-quarters, and by 0.40% in three-quarters, and vice versa. The highest coefficients of all in the short-run are the 2.12 of the lagged interest rates, which suggests, that a 1% increase of INT, increases − as expected from the economic theory − NPLs by 2.12% after two-quarters, a finding which holds almost at a 0.01 significance level; and the coefficient of GDP which drives NPLs substantially as well. It has to be noted that both lagged and the contemporaneous short run GDP bear estimated signs that make economic sense, in terms of the time-profile responsiveness of NPLs to GDP changes.
Table 5. Estimated ARDL Coefficients (in the short-run only)
These findings are further supported by the Wald tests, and the respective F and Chi-squared statistics (presented on Table ). Specifically, by focusing on the joint significance of the ARDL results in the short-run, we have statistical grounds to support that unemployment, both the contemporaneous and from the past, jointly influence NPLs; interest rates, both the contemporaneous and the past ones, jointly influence NPLs as well, which is also the case for the GDP, which in its turn jointly impacts NPLs.
6. Discussion and conclusions
This research has attempted to analyze the determinants of non-performing loans of the non-financial sector in North Macedonia from 2005(Q1) to 2022(Q2). In accordance with the research objectives set, we have applied an ARDL, to investigate the determinants of NPL. By developing this model, we have contributed to the existing research by capturing and modeling both the short- and the long-run co-integrating relations of the employed variables. Once all necessary tests were performed, we have managed to produce a robust model that allowed us to support that GDP, Unemployment, and interest rates are the main drivers of NPLs in the RNM both in the short and in the long run.
6.1. Empirical findings discussion
Overall, we have applied numerous econometric tests to generate our results. Following an ARDL and an ARDL Bounds testing approach, introduced by Pesaran et al. (Citation2001), and in accordance with the econometric modeling, as it is evident for example, on Gujarati (Citation2009), Kirchgässner and Wolters (Citation2007), Johansen and Juselius (Citation1990), and Verbeek (Citation2004), our research questions, in consolidating our results, can be answered as follows:
GDP is found to have a negative and a statistically significant impact on NPLs, which is in line with the economic theory and holds both in the short-run and in the long-run.
Unemployment rate was found to influence NPLs in the short-run and in the long run with the sign being also as expected from the economic theory (i.e. a positive one).
The Interest rates have a positive short-run and long-run impact on NPLs.
Gross loans were found to have no impact on NPLs either in the shortor the long run.
6.2. Suggestions for practice, future research, and limitations
Even though recently the ratio of NPLs in the RNM is at a favorable level (NBRNM, Citation2020, Citation2019), our research is useful in foreseeing and thus preparing for future NPLs. It could be used for forecasting and economic policymaking purposes too. Specifically, the regulatory bodies can foresee potential increases in NPLs and act accordingly in order to provide national stability and proceed with the necessary mitigating measures. Also, within this context, banks are obliged to access the credit risk accurately and to instill confidence in the system by practicing prudent loan approval policies.
A main outcome of our study is related to the responsiveness of RNM NPLs to interest rates which appear to be over-reactive. Thus, there is a need for enhanced surveillance and macro-financial monitoring to ensure prudent policymaking. Movement towards EU and NATO integration will assist in driving this forward. This will aid in maintaining stable economic growth, promoting macroeconomic stability (e.g., via increased foreign exchange reserves, increased commitment towards the EU path, and enhanced credibility, etc. Such a policy blend will aid in stressing the necessity of finding ways to lower brain drain related migration.
Finally, concerning further research, focus could be placed on migration-related statistics that could help us in capturing the impact of the brain-drain and the related impact of remittances to the overall economy too. Thus, even though this study has contributed in explaining that unemployment may result in the emigration of skilled labour force from the country, leading to the dearth of quality and skillful bank’s credit personnel, which in its turn may result in high non-performing loans, still, this is a finding that calls for further research.
Thus, attention should be given, following the example of neighboring countries, such as Bulgaria and Croatia, which underwent the process of EU integration, in capturing and predicting the out-flows of the labor force and in-flows of capital and remittances that could be eventually twisted or counter-balanced in line with the country’s EU integration process.
Disclosure statement
No potential conflict of interest was reported by the authors.
Additional information
Funding
Notes on contributors

Petros Golitsis
Petros Golitsis (PhD) is an Assistant Professor in Economics at the CITY College, University of York Europe Campus, and a South-East European Research Centre Research Associate. His research interest covers monetary transmission channels, optimum currency areas, exchange rates and regimes, foreign exchange reserves, and the impact of geopolitical uncertainty on various macroeconomic and financial variables.
Khurshid Khudoykulov
Khurshid Khudoykulov is (DSc) is a Professor at department of finance from the Tashkent State University of Economics (TSUE), Tashkent. His research interests focus on asset pricing, capital markets, investment, and the impact of geopolitical uncertainty on various macroeconomic and financial variables.
Savica Palanov
Savica Palanov holds an MSc in Finance and Banking, a BA in Accounting and Finance, and works Komercijalna Banka AD at Skopje, Republic of North Macedonia.
Notes
1. The unemployment rate measures the number of people actively looking for a job as a percentage of the labour force.
2. The variable used is the weighted interest rates on total extended denar credits (average for the period, in %, p.a.). Other macroeconomic and bank-specific explanatory variables were tested, including nominal effective exchange rate, the real effective exchange rate, household final consumption expenditure, inflation, banks’ capital to assets, and foreign exchange reserves, etc., but were statistically insignificant and thus were not used in the final specification.
3. The reported minimum value of unemployment is 14.8 and not 14.7. The end date of this variable is the first quarter of 2022; we have used extrapolation to acquire the Q2 of 2022 value.
4. On the final specification, the dummy variable generated statistically significant results and the sign is as expected (i.e., it has an adverse impact on NPLs).
5. It has to be noted that even though the use of the cointegrating ARDL approach is reasonable, as stated, when there is a mix of I(0) and I(1) series, this does not apply when it is the dependent variable that is I(0). In our case, the dependent variable, NPL, is I according to the ADF unit root test, but according to the Zivot-Andrews is not. Thus, according to the asymptotic theory developed in the paper of Pesaran, Pesaran et al. (Citation2001), which provides a simple univariate framework for testing the existence of a single level relationship between yt and xt when it is not known with certainty whether the regressors are purely I(0), purely I(1) or mutually cointegrated, our results may not be fully reliable because a “degenerate case” might arise. This apart from leading to a difficulty in interpretation (e.g., as manifest in the 100% reversion each period), could question the reliability of the statistical results.
6. Available at the Appendix.
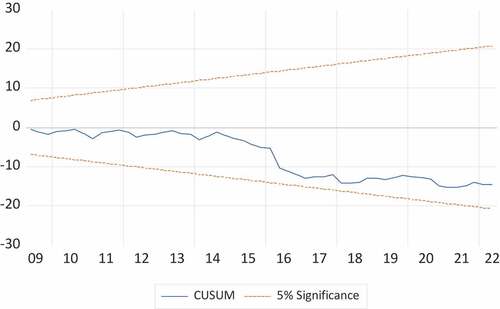
7. Prior to the implementation of the model, a decision on the maximal number of lags to be included is required. We have chosen 4 (note that our data is quarterly). The decision on the optimal number of lags is made based on Akaike Information Criterion, AIC. Still, using the general-to-specific modeling framework, we developed models with varying numbers of lags for the determinants differentiated (equal number of lags for all determinants) ending up to the reported specification. Also, in terms of the post-estimation tests, it has to be noted that the BG test for serial correlation failed to reject the respective null hypothesis of autocorrelation, and furthermore, the residuals follow a normal distribution (see the JB statistic on Table ), do not display heteroscedasticity (according to BPG test), and there is no specification bias, according to Ramsey Reset test, as well. The CUSUM test supports further the stability of the model; the CUSUM and the CUSUM of squares remains between the 5% critical bounds, which provides statistical evidence on the stability of the parameters. The results are provided on Table . We have also applied a short-run ARDL(1,3,2,2,0). For more details see the appendix.
References
- Al Rababa’a, A. R., Alomari, M., Rehman, M. U., McMillan, D., & Hendawi, R. (2022). Multiscale relationship between economic policy uncertainty and sectoral returns: Implications for portfolio management. Research in International Business and Finance, 61, 101664. https://doi.org/10.1016/j.ribaf.2022.101664
- Al-Yahyaee, K. H., Mensi, W., Sensoy, A., & Kang, S. H. (2019). Energy, precious metals, and GCC stock markets: Is there any risk spillover? Pacific-Basin Finance Journal, 56, 45–40. https://doi.org/10.1016/j.pacfin.2019.05.006
- Amuakwa-Mensah, F., Marbuah, G., & Ani-Asamoah Marbuah, D. (2017). Re-Examining the Determinants of Non-Performing Loans in Ghana’s Banking Industry: Role of the 2007–2009 Financial Crisis. Journal of African Business, 18(3), 357–379. https://doi.org/10.1080/15228916.2017.1308199
- Anastasiou, D., Louri, H., & Tsionas, M. (2016). Determinants of Non-Performing Loans: Evidence from Euro-Area Countries. Finance Research Letters, 18, August Elsevier Inc.,116–119. https://doi.org/10.1016/j.frl.2016.04.008
- Anastasiou, D., Louri, H., & Tsionas, M. (2019). Nonperforming loans in the euro area: A re core–periphery banking markets fragmented? International Journal of Finance & Economics, 24(1), 97–112. https://doi.org/10.1002/ijfe.1651
- Angelova, B., & Boskovska, D. (2016). Share of Loans to Households in Non-Performing Loans of the Banks in Macedonia. Economic Development/Ekonomiski Razvoj, 18, 3. https://www.ceeol.com/search/article-detail?id=544893
- Beck, R., Jakubik, P., & Piloiu, A. (2015a). Key Determinants of Non-Performing Loans: New Evidence from a Global Sample. Open Economies Review, 26(3), 525–550. https://doi.org/10.1007/s11079-015-9358-8
- Beck, R., Jakubik, P., & Piloiu, A. (2015b). Key determinants of non-performing loans: New evidence from a global sample. Open Economies Review, 26(3), 525–550. https://doi.org/10.1007/s11079-015-9358-8
- Beladi, H., Deng, J., & Hu, M. (2021). Cash flow uncertainty, financial constraints and R&D investment. International Review of Financial Analysis, 76, 101785. https://doi.org/10.1016/j.irfa.2021.101785
- Bellotti, A., Brigo, D., Gambetti, P., & Vrins, F. (2021). Forecasting recovery rates on non-performing loans with machine learning. International Journal of Forecasting, 37(1), 428–444. https://doi.org/10.1016/j.ijforecast.2020.06.009
- Bitzenis, A., Karagiannis, N., & Marangos, J. (2015). Europe in Crisis: Problems, Challenges, and Alternative Perspectives. Palgrave Macmillan.
- Bitzenis, A., Papadopoulos, I., & Vasileios, A. V. (2014). Reflections on the Greek Sovereign Debt Crisis: The EU Institutional Framework, Economic Adjustment in an Extensive Shadow Economy. Cambridge Scholars Publishing.
- Bitzenis, A., Vlachos, V. A., & Papadimitriou, P. (2012). Mergers and Acquisitions as the Pillar of Foreign Direct Investment. Springer.
- Boako, G., Tiwari, A. K., Ibrahim, M., & Ji, Q. (2019). Analysing dynamic dependence between gold and stock returns: Evidence using stochastic and full-range tail dependence copula models. Finance Research Letters, 31. https://doi.org/10.1016/j.frl.2018.12.008
- Bogoev, J. (2009). Banks’ Risk Preferences and Its Impact on the Loan Supply Function: An Empirical Investigation for The Republic of Macedonia. Journal of Business & Economics, 1(2). https://www.proquest.com/openview/56aa99f205298cd2a45cf481b5dccad4/1?pq-origsite=gscholar&cbl=106039
- Bolognesi, E., Compagno, C., Miani, S., & Tasca, R. (2020). Non-performing loans and the cost of deleveraging: The Italian experience. Journal of Accounting and Public Policy, 39(6), 106786. https://doi.org/10.1016/j.jaccpubpol.2020.106786
- Boskovska, D., & Gligorova, E. (2014). Effects of the Financial Crisis on the Lending Activity of Banks in the Republic of Macedonia. Economic Development/Ekonomiski Razvoj, 16(1–2), 67–76. https://www.ceeol.com/search/article-detail?id=169749
- Bucevska, V. (2010). Assessing the Future Migration Potential of the EU Candidate Countries. Revista Tinerilor Economisti, (14), Editura Universitaria Craiova, 131–142. https://hdl.handle.net/20.500.12188/6008
- Castelnuovo, E., Lim, G., & Pellegrino, G. (2017). A short review of the recent literature on uncertainty. Australian Economic Review, 50(1), 68–78. https://doi.org/10.1111/1467-8462.12210
- Cikovic, K. F. (2016).Effects of the Entrance of Foreign Capital in the Macedonian Banking Sector. Економски Развој-Economic Development, 18(3) 295–308. https://www.ek-inst.ukim.edu.mk/wp-content/uploads/2018/07/Y18-3-2016-22.pdf
- Delova-Jolevska, E., & Andovski, I. (2015). Retail Loans in the Banking Systems of Serbia, Croatia and Macedonia with Special Emphasis of Retail Portfolio of Macedonian Banks. Economic Development/Ekonomiski Razvoj, 17, 3. https://web.p.ebscohost.com/abstract?direct=true&profile=ehost&scope=site&authtype=crawler&jrnl=14097893&AN=112638012&h=%2bKml9K3ZGTJzuvkbK6dkyLAXJ5eXRUdsaLavHmPZ%2fwwvyUqF58mFMhNZS4RleLnw3kS71o%2byeq3xw3lh8PGNhg%3d%3d&crl=c&resultNs=AdminWebAuth&resultLocal=ErrCrlNotAuth&crlhashurl=login.aspx%3fdirect%3dtrue%26profile%3dehost%26scope%3dsite%26authtype%3dcrawler%26jrnl%3d14097893%26AN%3d112638012
- Demiralay, S., & Golitsis, P. (2021). On the dynamic equicorrelations in cryptocurrency market. The Quarterly Review of Economics and Finance, 80, 524–533. https://doi.org/10.1016/j.qref.2021.04.002
- Erdinç, D., & Gurov, A. (2016). The effect of regulatory and risk management advancement on non-performing loans in European banking, 2000–2011. International Advances in Economic Research, 22(3), 249–262. https://doi.org/10.1007/s11294-016-9591-y
- Eric, Z., & Donald, W. K. A. (2002). Further Evidence on the Great Crash, the Oil-Price Shock, and the Unit-Root Hypothesis. Journal of Business & Economic Statistics, 20(1), Taylor & Francis, 25–44. https://doi.org/10.1198/073500102753410372
- Espinoza, R., & Prasad, A. (2010). Nonperforming Loans in the GCC Banking System and Their Macroeconomic Effects. IMF Working Papers, 10(224), 1. https://doi.org/10.5089/9781455208890.001
- Fiott, D. (2017). The EU, NATO and the European Defence Market: Do Institutional Responses to Defence Globalisation Matter? European Security, 26(3), Taylor & Francis, 398–414. https://doi.org/10.1080/09662839.2017.1352582
- Gabauer, D., & Gupta, R. (2020). Spillovers across macroeconomic, financial and real estate uncertainties: A time-varying approach. Structural Change and Economic Dynamics, 52, 167–173. https://doi.org/10.1016/j.strueco.2019.09.009
- Gaber, S. (2009). Fiscal stimulations for improving the business environment in Republic of Macedonia. Perspectives of Innovations, Economics & Business, 3(2), 48–49. https://doi.org/10.15208/pieb.2009.51
- Ghosh, A. (2015). Banking-industry specific and regional economic determinants of non-performing loans: Evidence from US states. Journal of Financial Stability, 20, 93–104. https://doi.org/10.1016/j.jfs.2015.08.004
- Ghosh, A. (2017). Sector-Specific Analysis of Non-Performing Loans in the US Banking System and Their Macroeconomic Impact. Journal of Economics and Business, 93(September), 29–45. https://doi.org/10.1016/j.jeconbus.2017.06.002
- Golitsis, P. (2018). Interactions of Monetary Policies in South East Europe in a European Monetary Union Context. A Global-Vector Autoregressive Model [Doctoral dissertation, University of Sheffield].
- Golitsis, P., Bellos, S. K., & Alexandridis, A. (2020). The EMU-REER Spillovers on Southeastern European Economies: A G-VAR Model. Applied Economics Quarterly (Formerly: Konjunkturpolitik), 66(4), 259–290. https://doi.org/10.3790/aeq.66.4.259
- Golitsis, P., Bellos, S. K., Fassas, A. P., & Demiralay, S. (2021). The Spillover Effect of Euribor on Southeastern European Economies: A Global VAR Approach. Journal of East-West Business, 27(1), 57–91. https://doi.org/10.1080/10669868.2020.1826383
- Golitsis, P., Gkasis, P., & Bellos, S. K. (2022). Dynamic spillovers and linkages between gold, crude oil, S&P 500, and other economic and financial variables. Evidence from the USA. The North American Journal of Economics and Finance, 63, 101785. https://doi.org/10.1016/j.najef.2022.101785
- González, N. M. U., Hromcová, J., & José Callado Muñoz, F. (2017). Defence Spending, Institutional Environment and Economic Growth: Case of NATO. Working Papers (Universitat Autònoma de Barcelona. Departament d’Economia Aplicada), (4), Departament d’Economia Aplicada, 1. https://dialnet.unirioja.es/servlet/articulo?codigo=7062066
- Guidolin, M., Hansen, E., & Pedio, M. (2019). Cross-asset contagion in the financial crisis: A Bayesian time-varying parameter approach. Journal of Financial Markets, 45, 83–114. https://doi.org/10.1016/j.finmar.2019.04.001
- Gujarati, D. N. (2009). Basic econometrics (5th Edition) ed.). McGraw-Hill.
- Gulati, R., Goswami, A., & Kumar, S. (2019). What Drives Credit Risk in the Indian Banking Industry? An Empirical Investigation. Economic Systems, 43(1), Elsevier, 42–62. https://doi.org/10.1016/j.ecosys.2018.08.004
- Gupta, R., Ma, J., Risse, M., & Wohar, M. E. (2018). Common business cycles and volatilities in US states and MSAs: The role of economic uncertainty. Journal of Macroeconomics, 57, 317–337. https://doi.org/10.1016/j.jmacro.2018.06.009
- Jabbouri, I., & Naili, M. (2019). Determinants of Nonperforming Loans in Emerging Markets: Evidence from the MENA Region. Review of Pacific Basin Financial Markets and Policies, 22(4), World Scientific, 1950026. https://doi.org/10.1142/S0219091519500267
- Janeska, V., Mojsovska, S., & Lozanoska, A. (2016). Brain Drain from the Republic of Macedonia-Trencs, Implications, Policies. Economic Development/Ekonomiski Razvoj, 18, 3.
- Johansen, S., & Juselius, K. (1990). Maximum Likelihood Estimation and Inference on Cointegration—with Applications to the Demand for Money. Oxford Bulletin of Economics and Statistics, 52(2), 169–210. https://doi.org/10.1111/j.1468-0084.1990.mp52002003.x
- Jovanovic, B., & Petreski, M. (2012). Monetary Policy in a Small Open Economy with Fixed Exchange Rate: The Case of Macedonia. Economic Systems, 36(4), Elsevier, 594–608. https://doi.org/10.1016/j.ecosys.2012.02.003
- Kang, S., Hernandez, J. A., Sadorsky, P., & McIver, R. (2021). Frequency spillovers, connectedness, and the hedging effectiveness of oil and gold for US sector ETFs. Energy Economics, 99, 105278. https://doi.org/10.1016/j.eneco.2021.105278
- Keeton, W. R. (1999). Does Faster Loan Growth Lead to Higher Loan Losses? Economic Review-Federal Reserve Bank of Kansas City, 84, Federal Reserve Bank of Kansas City, 57–76. https://www.proquest.com/openview/71ac5a538ac57394755a0ee54c60a2b2/1?pq-origsite=gscholar&cbl=47211
- Kirchgässner, G., & Wolters, J. (2007). Introduction to Modern Time Series Analysis. Springer Science & Business Media.
- Kjosevski, J., Petkovski, M., & Naumovska, E. (2019). Bank-Specific and Macroeconomic Determinants of Non-Performing Loans in the Republic of Macedonia: Comparative Analysis of Enterprise and Household NPLs. Economic Research-Ekonomska Istraživanja, 32(1), Routledge, 1185–1203. https://doi.org/10.1080/1331677X.2019.1627894
- Klein, N. (2013). Non-Performing Loans in CESEE: Determinants and Impact on Macroeconomic Performance. IMF Working Papers, 13(72), 1. https://doi.org/10.5089/9781484318522.001
- Kripfganz, S., & Schneider, D. (2020). Response Surface Regressions for Critical Value. https://doi.org/10.1111/obes.12377
- Kuzucu, N., & Kuzucu, S. (2019). What Drives Non-Performing Loans? Evidence from Emerging and Advanced Economies during Pre- and Post-Global Financial Crisis. Emerging Markets Finance and Trade, 55(8), Taylor & Francis, 1694–1708. https://doi.org/10.1080/1540496X.2018.1547877
- Li, Y., Huang, J., Gao, W., & Zhang, H. (2021). Analyzing the time-frequency connectedness among oil, gold prices and BRICS geopolitical risks. Resources Policy, 73, 102134. https://doi.org/10.1016/j.resourpol.2021.102134
- Louzis, D. P., Vouldis, A. T., & Metaxas, V. L. (2012). Macroeconomic and bank-specific determinants of non-performing loans in Greece: A comparative study of mortgage, business and consumer loan portfolios. Journal of Banking & Finance, 36(4), 1012–1027. https://doi.org/10.1016/j.jbankfin.2011.10.012
- Lozanoska, A., & Dzambaska, E. (2015). Macroeconomic Assumptions for the Employment Policy-An Overview of the Situation in the Republic of Macedonia. Economic Development/Ekonomiski Razvoj, 17. https://www.ceeol.com/search/article-detail?id=288237
- Makri, V., Tsagkanos, A., & Bellas, A. (2014). Determinants of Non-Performing Loans: The Case of Eurozone. Panoeconomicus, 61(2), 193–206. https://doi.org/10.2298/PAN1402193M
- Ma, F., Lu, X., Wang, L., & Chevallier, J. (2021). Global economic policy uncertainty and gold futures market volatility: Evidence from Markov regime‐switching GARCH‐MIDAS models. Journal of Forecasting, 40(6), 1070–1085. https://doi.org/10.1002/for.2753
- McMillan, D. G. (2019). Cross-asset relations, correlations and economic implications. Global Finance Journal, 41, 60–78. https://doi.org/10.1016/j.gfj.2019.02.003
- McNown, R., Sam, C. Y., & Goh, S. K. (2018). Bootstrapping the autoregressive distributed lag test for cointegration. Applied Economics, 50(13), 1509–1521. https://doi.org/10.1080/00036846.2017.1366643
- Messai, A. S., & Jouini, F. (2013). Micro and macro determinants of non-performing loans. International Journal of Economics and Financial Issues, 3(4), Econjournals, 852. https://dergipark.org.tr/en/pub/ijefi/issue/31960/351961?publisher=http-www-cag-edu-tr-ilhan-ozturk
- Mitsas, S., Golitsis, P., & Khudoykulov, K. (2022). Investigating the impact of geopolitical risks on the commodity futures. Cogent Economics & Finance, 10(1). https://doi.org/10.1080/23322039.2022.2049477
- Naili, M., & Lahrichi, Y. (2020). The determinants of banks’ credit risk: review of the literature and future research Agenda. International Journal of Finance & Economics, December 2019 (August). https://doi.org/10.1002/ijfe.2156
- NBRNM. 2019. Banking system of the republic of North Macedonia: http://www.nbrm.mk/bankarski_sistiem_na_rm-en.nspx. Date Accessed January 13, 2020
- NBRNM. 2020. Financial stability report for the Republic of North Macedonia in 2019: https://www.nbrm.mk/ns-newsarticle-financial-stablity-report-for-the-republic-of-north-macedonia-in-2019.nspx. Date Accessed September 24, 2021.
- Nenovski, T., Bishev, G., & Eliskovski, M. (2018). Is there a role for monetary policy in stabilizing banking sector soundness and lending? Journal of Sustainable Development, 8(19), 34–61. https://www.ceeol.com/search/article-detail?id=676093
- Neofotistos, V. P. (2009). Bulgarian passports, Macedonian identity: the invention of EU citizenship in the Republic of Macedonia. Anthropology Today, 25(4), Wiley Online Library, 19–22. https://doi.org/10.1111/j.1467-8322.2009.00678.x
- Nikolov, M., & Popovska-Kamnar, N. (2016). Determinants of NPL growth in Macedonıa. Journal of Contemporary Economic and Business Issues, 3(2), 5–18. https://journals.ukim.mk/index.php/jeccf/article/view/93
- Nkusu, M. (2011). Nonperforming loans and macrofinancial vulnerabilities in advanced economies. IMF Working Papers, IMF Working Paper, 11(161), 1. https://doi.org/10.5089/9781455297740.001
- Ouattara, B. (2004). Modelling the long run determinants of private investment in Senegal (No. 04/05). Credit Research Paper.
- Peric, B. S., & Konjusak, N. (2017). How did rapid credit growth cause non-performing loans in the CEE Countries? South East European Journal of Economics and Business, 12(2), Sciendo, 73–84. https://doi.org/10.1515/jeb-2017-0019
- Pesaran, M. H., Shin, Y., & Richard, J. S. (2001). Bounds testing approaches to the analysis of level relationships. Journal of Applied Econometrics, 16(3), Wiley Online Library, 289–326. https://doi.org/10.1002/jae.616
- Petrevski, G., Bogoev, J., & Tevdovski, D. (2016). Fiscal and monetary policy effects in three south eastern European Economies. Empirical Economics, 50(2), Springer, 415–441. https://doi.org/10.1007/s00181-015-0932-0
- Peykov, N. (2022). The currency board in Bulgaria and its impact on sectoral economic activity. Eastern Journal of European Studies, 1. https://doi.org/10.47743/ejes-2022-0106
- Poposka, K. (2015). Bank Specific Determinants of Non-Performing Loans in the Republic of Macedonia. Економски Развој-Economic Development, 17(1–2), Економски институт-Скопје, 101–116. https://www.ceeol.com/search/article-detail?id=288243
- Quagliariello, M. (2007). Banks’ riskiness over the business cycle: a panel analysis on Italian Intermediaries. Applied Financial Economics, 17(2), Taylor & Francis, 119–138. https://doi.org/10.1080/09603100500486501
- Raddant, M. (2016). The Response of European Stock Markets to the Brexit. 100. Kiel Policy Brief.
- Radivojević, N., Cvijanović, D., Sekulic, D., Pavlovic, D., Jovic, S., & Maksimović, G. (2019). Econometric model of non-performing loans determinants. Physica A: Statistical Mechanics and Its Applications, 520, 481–488. https://doi.org/10.1016/j.physa.2019.01.015
- Rinaldi, L., & Sanchis-Arellano, A. (2006). Household debt sustainability. what explains household non-performing loans? An empirical analysis. 570. Working Paper Series. Working Paper Series. Frank.
- Saba, I., Kouser, R., & Azeem, M. (2012). Determinants of non performing loans: case of US banking sector. The Romanian Economic Journal, 44(6), 125–136. https://www.researchgate.net/profile/Rehana-Kouser/publication/330075583_Determinants_of_Non_Performing_Loans_Case_of_US_Banking_Sector/links/5c2bb773458515a4c7058d37/Determinants-of-Non-Performing-Loans-Case-of-US-Banking-Sector.pdf
- Sam, C. Y., McNown, R., & Goh, S. K. (2019). An augmented autoregressive distributed lag bounds test for cointegration. Economic Modelling, 80, 130–141. https://doi.org/10.1016/j.econmod.2018.11.001
- Spaseska, T., Risteska, A., Risteska, F., Sotiroski, K., Vitanova, G., & Odzaklieska, D. (2017). Determinants of Banks’ profitability in republic of Macedonia. Annal S of the „constanti N Brâncusi” University of Târgu Jiu, Economy Seri Es, „ACADEMICA BRÂNCUŞI” PUBLISHER, 30–42. https://eprints.uklo.edu.mk/2053/
- Staehr, K., & Uusküla, L. (2020). Macroeconomic and macro-financial factors as leading indicators of non-performing loans: Evidence from the EU countries. Journal of Economic Studies. https://www.emerald.com/insight/content/doi/10.1108/JES-03-2019-0107/full/html
- Sverko, I., Prga, I., & Vrdoljak, T. (2010). Non performing loans and loan loss provisions: The case of Croatia. Conference Proceedings: International conference of the faculty of economics Sarajevo. Sarajevo, Faculty of Economics Sarajevo. Economic development perspectives of SEE Region in Global Recession Context, 12.
- Tanasković, S., & Jandrić, M. (2015). Macroeconomic and institutional determinants of non-performing loans. Journal of Central Banking Theory and Practice, 4(1), Sciendo, 47–62. https://doi.org/10.1515/jcbtp-2015-0004
- Trenovski, B., & Tashevska, B. (2015). Fiscal or monetary dominance in a small, open economy with fixed exchange rate–the case of the Republic of Macedonia. Proceedings of Rijeka Faculty of Economics: Proceedings of Rijeka Faculty of Economics, 33(1), 125–145.
- Triki, M. B., & Maatoug, A. B. (2021). The GOLD market as a safe haven against the stock market uncertainty: Evidence from geopolitical risk. Resources Policy, 70, 101872. https://doi.org/10.1016/j.resourpol.2020.101872
- Verbeek, M. (2004). A Guide to Modern Econometrics (2nd ed) ed.). John Wiley & Sons Ltd.
- Vouldis, A. T., & Louzis, D. P. (2018). Leading indicators of non-performing loans in greece: the information content of macro-, micro- and bank-specific variables. Empirical Economics, 54(3), Springer, 1187–1214. https://doi.org/10.1007/s00181-017-1247-0
- Zhang, H., Demirer, R., Huang, J., Huang, W., & Suleman, M. T. (2021). Economic policy uncertainty and gold return dynamics: Evidence from high-frequency data. Resources Policy, 72, 102078. https://doi.org/10.1016/j.resourpol.2021.102078
Appendix
Figure A1. Variables in level.
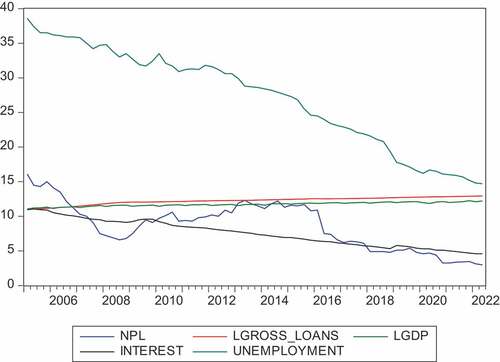
Figure A2. Variables in first difference.
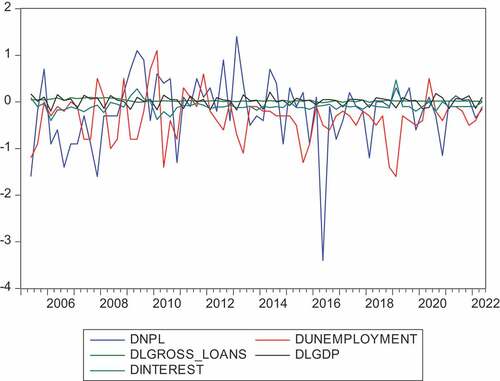
Table and Figure 5.1. Zivot-Andrews unit root test on NPL

Table and Figure 5.2. Zivot-Andrews unit root test on unemployment
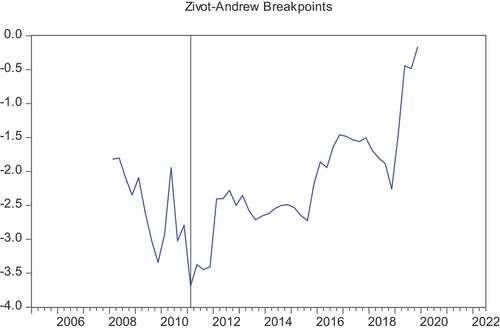
Table and Figure 5.3. Zivot-Andrews unit root test on interest rates
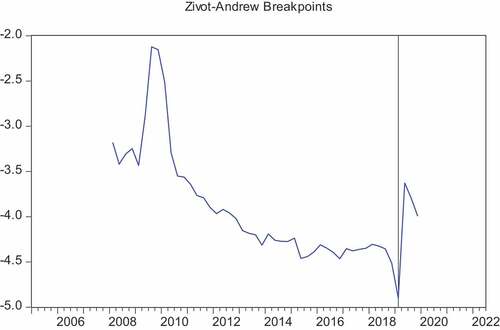
Table and Figure 5.4. Zivot-Andrews Unit Root Test on LGDP
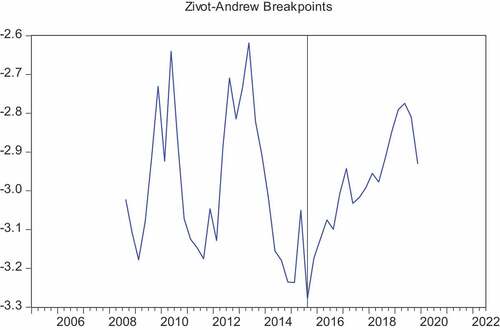
Table and Figure 5.5. Zivot-Andrews unit root test on LGross_Loans
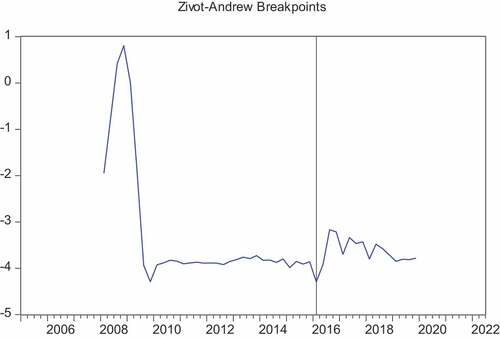
Table and Figure 5.6. Zivot-Andrews unit root test on dUnemployment
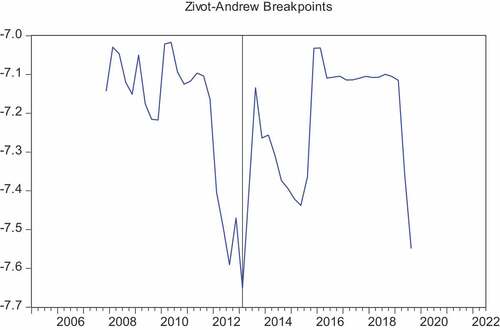
Table and Figure 5.7. Zivot-Andrews unit root test on dLGDP
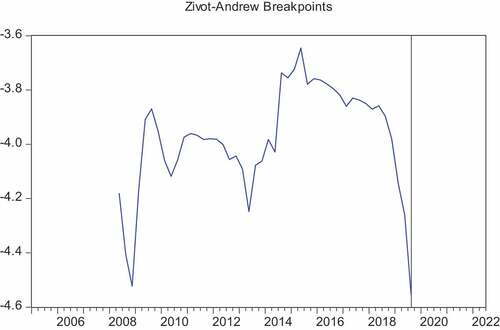
Table 6. The ARDL results in the short-run
Table 7. On the ARDL results in the short-run. The Wald tests
The ARDL results in the short-run
The ARDL results in the short-run
The ARDL results in the short-run
Table
Table 8. On the ARDL Long Run form and bound tests
Table
Table 9. Cointegration and Long run form or Error Correction form
Table 10. On residual diagnostics
Table
Table 11. On stability diagnostics