
 ?Mathematical formulae have been encoded as MathML and are displayed in this HTML version using MathJax in order to improve their display. Uncheck the box to turn MathJax off. This feature requires Javascript. Click on a formula to zoom.
Abstract
The study aims to investigate the effect of Corporate Sustainability Performance (CSP) on profitability by examining the moderating role of liquidity and stock price volatility in the Jordanian industrial sector. The sample under study contains 56 Jordanian industrial firms. The study developed an empirical multivariate panel data model to analyze the impact of sustainability (environmental, social and governance) on firm profitability. Further, 38 criteria were utilized in the study to measure CSP to understand whether firms ranked high on sustainability parameters perform better than low-ranked firms. The study reveals a significant positive relationship between CSP and profitability; liquidity and stock price volatility also moderate CSP’s effect on the profitability of industrial companies listed on the ASE. Empirical evidence suggests that companies in Jordan should focus on improving CSP activities; to enhance financial performance. The findings could be helpful to investors, senior managers in Jordanian industrial firms, and legislators in Jordan concerning decisions about how to enhance the quality of corporate sustainability and increase the possibility of maximizing the company’s profitability. Our methodology and evaluation of corporate sustainability in this context may also be helpful to other researchers on corporate sustainability in developing economies.
1. Introduction
Awareness about the protection of the future has increased day by day throughout the world. The fact that businesses remain insensitive to these demands causes them to be negatively affected by the increasing competition race (Kotabe & Helsen, Citation2020). This awareness has brought along the concept of sustainability. Sustainability is a set of vital processes that provide the means of life for various companies; this helps them maintain their reputation and achieve their long-term goals, as well as develop the means for their growth over time. Sustainability is considered a new dimension of providing a competitive advantage among businesses. Although scholars defined sustainability in various ways, sustainability is defined fundamentally built on three elements: economic, environmental, and social. Expressed as the reflection of the concept of sustainability on businesses, the concept of Corporate Sustainability Performance (CSP) is generally explained as the integration of sustainability elements into businesses (Dyllick & Muff, Citation2016). From this point of view, the performances of businesses that adopt the concept of sustainability are considered financial, environmental, and social performance dimensions.
Sustainability reports explain how businesses that adopt the concept of sustainability perform in sustainability, and the enormous number of companies that publish sustainability reports has been growing recently (Morgan et al., Citation2021). Although, in recent years, companies have placed more emphasis on sustainability to demonstrate their sensitivity to the environment and society in which they function. Consequently, as companies’ awareness grows over time, the question of how this affects financial performance has surfaced. Profitability indicates the effectiveness of a company’s operational and investment decisions, whereas profitability ratios assess how well a facility uses its resources to maximize earnings (Al-Dhunaibat & Muhammad, Citation2017). Furthermore, enhancing the company’s positive image requires a delicate balancing act with its performance. This may be expensive, but if done properly, these costs could be reduced by helping to cover operational costs (Despotovic et al., Citation2016).
On the other side, the market price of shares fluctuates sharply up and down due to a series of ramifications from the global financial crisis, which impacts the nature of investment decisions for dealers to either buy or sell shares. In contrast, the liquidity of shares is based on corporate profits when the share price rises. The impact of the crisis on the ASE (Amman Stock Exchange) was 3.4 billion (or 15.6%); the general Index of possible stock prices at the market value of free stocks fell by 40% (Salem, Citation2015).
Stock prices fluctuated according to the ASE amid active discussions led by industrial shares and excellent services. In addition, the volatility of stock market liquidity has recently received much attention in the financial literature, as Ji et al. (Citation2019); claimed that stock fluctuations and liquidity are one of the most critical aspects of the stock market development. In addition, stock fluctuations are affected by many factors, including interest rates, inflation, and currency rates, making financial assets more attractive to investors who can deal with them more easily. Also, markets allow investors to exit stocks if they want to change the composition of their investment portfolio. It also allows companies to have permanent access to capital through stock issuances, thus knowing the impact of volatility and liquidity of stock prices on corporate profitability. The main problem is industrial companies’ low level of profits, which affects the economies (Yameen et al., Citation2019).
Managers are an influential element in corporate management and have an impact on drawing the company’s strategies towards sustainable development. In developing countries, managers’ perceptions of CSP could be more precise (Zyadat, Citation2016). In addition, Yameen et al. (Citation2019) found that the liquidity ratio significantly impacts profitability. The main problem of this study lies in the low prices of stocks listed on the ASE and that Jordanian companies need to pay more attention to sustainable performance. Thus, this study’s main objective is to examine CSP’s effects on the Profitability of listed Industrial Companies in Jordan.
This study contributed to the existing literature through; identifying the current state of related studies and achieving the study’s objectives, which deal with the impact of CSP on corporate performance through Liquidity and Stock Price Volatility in Jordanian industrial companies. Moreover, this study has several significances identified, and this study attempts to fill in the gaps. The first significance is related to the population of this study. This study is comprehensive because it includes all industrial companies. The second significance is associated with the place of conducting the study. Most previous studies focused on sustainability in economic sectors. Developed countries dominate the sustainability studies, and scholars conducted few studies on developing countries in general and Jordan in particular. Thus, this study contributes to the literature in this regard.
Further, in terms of variables, the study found gaps related to the usage of the sustainability dimension on the performance of companies. Thus, the study chose the three dimensions and examined their effect on the performance of companies in Jordan. Additionally, there are gaps related to the use of publicly listed companies. Previous studies focus on service or manufacturing non-listed companies; the study fills up the gaps associated with publicly listed companies. Furthermore, in the context of data collection, most previous studies used secondary data, which they described as historical data based on previous studies. Some previous studies have adopted descriptive and exploratory methods to identify the extent to which sustainable development is applied and its relation to corporate performance.
In contrast, others have examined their variables’ correlative or causal relationships. The study also found a gap related to using the variable Liquidity and Stock Price Volatility in the context of sustainability. Few studies examined liquidity due to the need to find the potential of these variables in Jordan. For this reason, the study deploys liquidity as a moderating variable. Further, Stock Price Volatility is under-investigated in the environment such as Jordan and understanding its effect is essential for companies and decision-makers. Accordingly, this study examines Stock Price Volatility as a moderating variable.
2. Theoretical background and hypotheses development
2.1. The stakeholder theory
Stakeholder theory draws upon all internal and external relationships for organizations and manages all these relationships that drive the organization to survive because survival is the most important goal of any organization (Donaldson & Lee, Citation1995). The descriptive stakeholder theory concerns how the corporation attends to different stakeholders. According to instrumental stakeholder theory, if a corporation manages its relationships with stakeholders appropriately, it can improve its financial performance over time (Freeman, Citation1999). Sustainability practices can, therefore, be motivated by self-interest and to increase profit and shareholder value (Harjoto et al., Citation2015). For instance, 19, with better sustainability performance, a firm may attract more resources (Wood & Ross, Citation2006) to increase market opportunities and pricing premiums (Fombrun et al., Citation2000) as well as attract employees (Turban & Greening, Citation1997). Thus, managing stakeholder relations may result in competitive advantages (Barnett & Salomon, Citation2006).
In contrast, the normative stakeholder theory focuses on the moral and ethical arguments aimed at guiding stakeholder-oriented managers. Finally, the instrumental stakeholder theory investigated the consequences, i.e., the profit/wealth-enhancing possibilities, of considering a wide range of stakeholders in corporate strategy. Thus, making the latter most relevant to investigate and explain the linkage between CSP and financial performance.
2.2. Hypotheses development
2.2.1. CSP and profitability
Corporate sustainable performance is a positive predictor of several organizational outcomes. For instance, Alshehhi et al. (Citation2018) conducted a literature review study and found that 78% of publications report a positive relationship between CSP and financial performance. The authors also concluded that the variations in research methodology and measurement of variables lead to divergent views on the relationship. Similarly, Whetman (Citation2018) suggests that firms with lower institutional ownership significantly improve financial performance in the subsequent year after reporting by engaging in sustainability reporting. According to Hategan et al. (Citation2018), companies which implement CSR activities to a greater extent are more profitable in economic terms, which explains that firms with higher environmental investments have a higher profitability level than environmentally non-conscious firms (Shabbir & Wisdom, Citation2020). Likewise, Purbawangsa et al. (Citation2019), as a result of a comparison among three countries (Indonesia, China and India), concluded that CSR disclosure has a significant and positive effect on corporate value. Corporate governance and corporate profitability indirectly influence corporate value through mediation CSR disclosure. Therefore, Kinasih Yekti Nastiti et al. (Citation2019) suggested that firms must manage their working capital to increase their profits and achieve sustainable growth. contrast Rizki et al. (Citation2019) indicated that sustainability report does not affect firm value, and profitability affects firm value. On the other hand, Siregar (Citation2022) study indicated that profitability and liquidity positively impact sustainable reporting. Other findings also show that corporate governance can increase the positive impact of profitability on sustainable reporting. Therefore, the study proposed the following hypothesis:
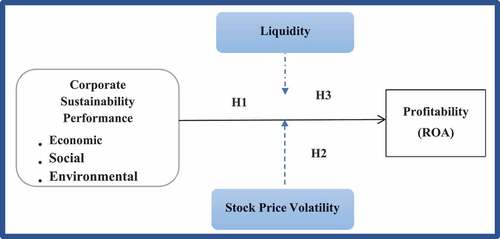
H1: CSPs significantly affect industrial companies’ profitability on the ASE.
2.2.2. Moderating effect of liquidity and volatility of CSP on profitability
Many studies claim that high stock price volatility is an indicator of the credibility of the share, which results in a positive increase in the profitability of companies. Further, when companies’ liquidity is high, this enables the companies to make additional investments which leads to a positive increase in profitability (Huang et al., Citation2011). According to the study of Manullang and Hutabarat (Citation2020), sustainable growth rate and liquidity significantly affect profitability. Moreover, CitationSiregar () indicated
that profitability and liquidity positively impact sustainable reporting. Other findings also show that corporate governance can increase the positive impact of profitability on sustainable reporting. Hatane and Soewarno (Citation2022), Claimed that the presence of sustainability report disclosure by the company would increase the profitability and liquidity of the company. In contrast, book value and leverage have no effect. The absence of significant influence of sustainability reports towards book value and leverage appears due to the low levels of the disclosure of sustainability reports.
In addition, another study indicated that liquidity and growth generally do not influence profitability in terms of return on equity. However, the result shows that a sustainable growth rate positively affects profitability (Ali et al., Citation2019). Finally, Ajide and Aderemi (Citation2014) concluded that liquidity management affected corporate sustainability. Regarding Stock Price Volatility, Zhang et al. (Citation2018) indicated that sustainability news release has the most significant drop in volatility persistence. Similarly, Galindo-Manrique et al. (Citation2021), Found a positive effect between Eco-Efficiency and Stock Market Volatility; accordingly, eco-efficient behaviour can improve financial performance by increasing wealth generation and decreasing the volatility of listed financial assets.
Finally, Shakil (Citation2022) indicated a significant influence of ESG on stock price volatility.
Accordingly, this study proposes that volatility and liquidity will moderate the effect of CSP on profitability. Therefore, the study proposed the following hypothesis:
H2: Stock Price Volatility moderates the effect of CSP on the profitability of Industrial Companies listed on the ASE.
H3: Liquidity moderates the effect of CSP on the profitability of Industrial Companies listed on the ASE.
3. Framework development
According to Stakeholder theory, companies that manage to take care of their stakeholders, such as customers, investors, community, employees, and management, can achieve better performance and increase the attractiveness of their shares which ultimately lead to higher price of its shares (Lourenço et al., Citation2012). According to the Dow Jones Corporate Sustainability Assessment Methodology Sustainability assessment checklist consist of 38 criteria economic (13), environmental (12), and social (13; Knoepfel, Citation2001). If the study finds relevant information in the annual report, “1” is assigned to the company. Otherwise, the company gets a “0” point. For example, in the study of Lourenço et al. (Citation2012), the theory was deployed to explain the effect of sustainable corporate performance on the price of shares. The study concluded that companies that apply high CSP would manage to increase the share price because investors value CSP’s importance and strategies to maintain a high level of CSP.
In American listed companies, Flammer (Citation2013) found that companies that have behaved sustainably have achieved higher stock price increases indicating a positive link between sustainability and the stock price increase. Similarly, in a study conducted by Van Stekelenburg et al. (Citation2015) in Europe, companies that have implemented the Dow Jones Sustainability Europe Index (DJSI Europe) have achieved an abnormal increase in the price of shares sustainability positive predictor of price volatility in the market. In this study, share price consists of two variables: price volatility and liquidity.
This study proposes that the aggregate level of CSP will affect the performance of companies in Jordan.
CSP significantly affected the current ratio, gross profit margin, and corporate governance index (Dincel & Gungor, Citation2018). The study also proposed that liquidity and stock price volatility will moderate this effect. Accordingly, based on the theoretical ground and hypothesis development discussed previously, the current study proposed the research framework. As shown in Figure .
Figure 1. Research model.
4. Methodology
This study aims to identify the impact of CSP on corporate profitability and learn about the moderate role of liquidity and stock price volatility in Jordan; the study has done them using the appropriate statistical analysis methods. Accordingly, a quantitative approach that utilized positivism was applied to determine the effect of CSP on the profitability of industrial companies in Jordan. The study collected the data from annual reports of the companies listed on the ASE and the percentages extracted according to the recommended formulas. In addition, the study adopted 38 criteria from previous studies. Moreover, the population of this study consists of all industrial companies listed on the ASE until (31/12/2020); the industrial sector consists of 56 companies (CitationASE (ASE)). Due to time constraints and large sample sizes, all industrial companies listed on the ASE have been chosen for sample size from 2015 to 2020.
4.1. Measurement of the variables
All variables are secondary data, and the study collected them from the annual reports of industrial companies. Stock price volatility, and measured using the following formula proposed by Baskin (Citation1989) and Ahmad et al. (Citation2018).
Where: P-Volit serves as the stock price volatility for firm ith in time tth, HP means the highest stock price for firm ith in time tth, while LP means the lowest stock price for firm ith in time tth.
Profitability can be measured using the Return on Assets (ROA)
Where: ROA: Return on assets. NI: Net income; TA: total assets. i = a company; t = year Liquidity can be measured using the Quick Ratio.
4.2. Where: QR: Quick Ratio. CA: Current assets. INV: Inventory; CL: Current liabilities. i = a company; t = year
Sustainability is measured based on three main dimensions: Economic, Environmental and Social. In the sustainability checklist, 38 criteria, economic (13), environmental (12), and social (13), were derived by the study from Dow Jones Corporate Sustainability Assessment Methodology. If the study finds relevant information in the annual report, “1” is assigned to the company. Otherwise, the company gets a “0” point. The appendix shows the items.
5. Equations model
The study applied the following model to test the hypotheses. The researchers developed the equations based on the proposed effect of the variables. The direct effect includes the effect of CSP on profitability. The moderating effect was created by multiplying the independent variable with the moderating variables to create the moderating effect. For example, the study computed the CSP by multiplying by the liquidity to create the moderating effect (LQ*CSP). The study followed similar procedures to create the moderating effect of stock price volatility (P-Vol) with CSP to create (P-VOL*CSP); this is in line with J. F. Hair et al. (Citation2010), who suggested creating the moderating or also known as the interaction effect, by multiplying the IV with the moderator. However, the study applies the following equations to test the hypotheses. Similar procedures for writing the equation used in the study (Karlsson & Bäckström, Citation2015)
6. Direct effect
Moderating Effect
6.1. Where: CSP: CSP ROA: Profitability; P-VOL: Stock Price volatility; LQ: Liquidity i = a; company t = year
β0 = intercept measures the expected value of the risk-free rate if the regression equals zero β1 = the coefficient of the independent variable u = the error term
7. Results
The study examined the normal distribution, outliers, multicollinearity tests, correlation, autocorrelation, and heteroscedasticity. Descriptive statistics measures were employed, including mean, standard deviation, and maximum and minimum values. In addition, the declaration of data as panel data was conducted and checking the assumption of regression analysis was. The study compared the fixed effect model and the random effect model using the Hausman test to determine the appropriate model. Thus, this study has declared the time as T = 6 and the number of companies as N = 56. Accordingly, the number of observations accounted for 336 (N = 56*T = 6). This finding has resulted in firmly balanced data.
8. Descriptive statistics
To describe the study’s variables (ROA, CSP, L, and P-Vol) for the sample of 56 companies over six years. The study provided information on the description of the variables in this section. The following section provides the minimum (Min) and maximum (Max) values, the mean (M), and the standard deviation (Std.). The results showed:
As shown in Table , the ROA ranged between (−103.113) as the minimum and (43.299) as the maximum, and the mean is (0.021238). In comparison, the standard deviation is (13.386). The standard deviation value that exceeded the arithmetic means indicates a large dispersion in the values of return on assets around the arithmetic means of the group of companies. It is also clear from the values that there is a large discrepancy in the values of return on assets among the study sample companies.
Table 1. Descriptive statistics measures among the variables
As shown in Table , the CSP ranged between (0.156) as the minimum and (1.000) as the maximum, and the mean is (0.6762). In contrast, the standard deviation is (0.2265). The standard deviation value, that is, at most, the value of the arithmetic mean, indicates that there is not a large dispersion in the values of CSP around the arithmetic mean of the group of companies.
It is also clear from the values that there is not a large discrepancy in the values of CSP among the study sample companies.
The standard deviation value that does not exceed the value of the arithmetic mean indicates that there is not a large dispersion in the L values around the arithmetic mean of the group of companies.
It is also clear from the values that there is a slight discrepancy in the values of L among the study sample companies. As shown in Table , the L ranged between (0.000) as the minimum and (174,508,300) as the maximum, and the mean is (246,200,808), while the standard deviation is (246,200,808).
Table shows the descriptive information about the study variables. As shown in Table , the P-VOL ranged between (0.050) as the minimum and (0.4430) as the maximum, and the mean is (0.123432). At the same time, the standard deviation is (0.0682894). The standard deviation value that does not exceed the value of the arithmetic mean indicates that there is not a large dispersion in the values of P-VOL around the arithmetic mean of the group of companies. It is also clear from the values that there is a slight discrepancy in the values of P-VOL among the study sample companies.
Table shows the information on the Frequencies and percentages of applying Indexes of Sustainability (Economic 13 indexes—Environmental 12 indexes—Social 13 indexes). The Indexes of the majority of Indexes of Sustainability were applied by more than 50% of the study sample companies, except for the (Brand management) Index, which was applied by (43.2%), and the study sample companies applied the economic sustainability Index (Corporate governance) by (80.1%).) of the study sample companies.
Table 2. Frequencies and percentages of applying indexes of sustainability
While all the companies applied the environmental sustainability indicator, which amounted to 12 indicators, and the business opportunities financial services- Environmental policy/management system- Water-Related Risks were the highest three applied sustainability indicators at a rate of (83.6%) for each of the companies in the study sample. The Climate change indicator was governance least applied (53.6%).
As for the Social indices of (13) indices, the two (Health Outcome Contribution—Talent Attraction & Retention) indicators were the highest applied at (83.6%) for each of them, and the Bioethics index came the least at (53.6%).
The study used a multi-regression analysis to check for collinearity. The study as ROA assigned the dependent variable. Other variables, such as CSP and the moderators, were included in the equation. shows the results of the multicollinearity analysis, and it shows that the value of VIF is less than 10, and the tolerance is greater than 0.10.
9. Correlation matrix
J. F. Hair et al. (Citation2010) also suggested that a correlation between the variables exceeding 0.90 is an indication that there is multicollinearity (). The study in Table gives the correlation among the variables, and it shows the correlation among the variables. The highest correlation is between the CSP and P-VOL, with a value of 0.315. The study indicated that all the correlation between the variables is less than 0.90, confirming that the collinearity is not an issue of the variables.
Table 3. Multicollinearity analysis
Table 4. Correlation matrix
10. Multivariate analysis
The study tested the hypotheses by using STATA. The study used the fixed effect model to test all the hypotheses. The role of thumb is to accept the hypothesis if the t-value
(t) is greater than 1.65 at a significance level (P-value or P) less than 0.1 and accept the hypothesis if the t-value is greater than 1.96 at a P-value level of less than 0.05 and accept the hypothesis if the t-value is 2.58 with a P-value less than 0.001. The study considers all the significance levels since the number of observations is small; this is in line with the suggestion of Hair et al. (Citation2017).
The direct effect hypotheses include the effect of CSP on ROA. There is one direct hypothesis. The dependent variable of this study is the ROA. Table shows the results of the hypotheses with ROA as the dependent variable. The model was statistically significant, with Prob >F accounts to 0.000 and F = 25.80. The r-square of the model is 0.57, indicating that CSP can explain 57% of the variation in the ROA.
Table 5. The effect of CSP on ROA
The direct hypothesis of this study assumed that CSP’s effect is positively related to the ROA of companies in Jordan. The finding of the hypotheses testing presented in Table 4.8 shows that the assumption is false. CSP positively affects the ROA (Coefficient = 0.194, T = 3.57, p = 0.001) and is statistically significant at 0.05 level. Thus, H1 is accepted.
This study has two main hypotheses related to the moderating effect of L and P-VOL between CSP and ROA. Additionally, to test the moderating effect, there are several ways. One is the hierarchical regression which relies on the changes in the r-square used by the study in the SPSS environment. However, using structural equation modelling such as STATA, there is a more straightforward method to test the moderating effect of variables. Researchers such as J. F. Hair et al. (Citation2010) and Awang et al. (Citation2014) suggested first standardizing the data and testing for the moderating effect. The study conducts the test by multiplying the independent variable (CSP) by the moderator (L and P-VOL) to create a new variable known as the moderating effect (i.e., CSP*P-VOL, CSP*L). Thus, in this study, the independent variable was multiplied by the moderator to create the moderating effect and examined the moderating effect on the dependent variable (ROA). The first moderating effect hypothesis proposed that P-VOL will moderate the effect of the CSP on ROA. The second moderating effect hypothesis proposed that L will moderate the effect of the CSP on ROA. In addition, the study examined the moderating effect of P-VOL between CSP and ROA. The model is statistically significant at prob>chi2 equals 0.000 and can explain 61% of the variation in the ROA. Table presents the results of testing the moderating effect of P-VOL. The study in the coming sections discusses further details of the moderating hypotheses.
Table 6. Moderating Effect of P-VOL between CSP and ROA
For the moderating effect of L with the ROA as a dependent variable, Table shows the results of testing the moderating effect of L between CSP and ROA. The p-value of the model is 0.000, indicating that it is statistically significant, and the r-square is 0.59, indicating that a percentage of 59 of the variation in the ROA which explained by the study by the CSP, L and the moderating effect CSP*L.
Table 7. Moderating effect of L between CSP and ROA
The moderate hypothesis of this study assumed that Stock Price Volatility moderate the effect of CSP on the profitability of Industrial Companies listed on the ASE. The result of the hypotheses testing in Table shows that the moderating effect (CSP*P-VOL) is positive with a coefficient of 0.071** at a significance level of 0.05. Thus, P-VOL can play a moderating role between CSP and ROA, indicating that the increase in the level of P-VOL as a moderator will lead to an increase in the relationship between CSP and ROA. Thus, H2 is accepted.
The second moderate hypothesis of this study assumed that Liquidity moderates the effect of CSP on the profitability of Industrial Companies listed on the ASE. The result shows that the moderating effect, i.e., CSP*L is positive and significant at a coefficient of 0.042** and a significance level of less than 0.05. Thus, this indicates that the L has a moderating effect between CSP and ROA. This moderating effect is positive due to the positive sign in front of the coefficient.
Thus, H03 is accepted.
11. Discussion and implications
Regarding H1, which examined the effect of CSP on the profitability of industrial companies listed on the ASE, the current study results revealed that CSP positively affected profitability measured by ROA. This result supports the viewpoint of stakeholder theory that argues about the benefits of CSP, such as increased productivity, lower legal and compliance costs, enhanced staff morale, and, therefore, improved financial performance (Freeman, Citation2010). In contrast, the positive effect of CSP on profitability is incompatible with shareholder theory which views a corporation’s sole responsibility as maximizing profits for its shareholders. In other words, if a corporation does something unrelated to profit, a shareholder will invest in another company more committed to making a profit (Friedman, Citation1962).
Moreover, the positive effect of CSP on profitability is consistent with much of the evidence, such as Tarmuji et al. (Citation2016) and Eccles et al. (Citation2016). They all found that CSP is a significant determinant of high financial performance. Therefore, this result proves the importance of CSP for improving firms’ financial performance and, thus, their continuity in the business world.
H2 focused on the effect of Stock Price Volatility as a moderator variable between CSP and the profitability of Industrial Companies listed on the ASE. The current study results revealed that stock price volatility moderates the positive effect of CSP on profitability. This result is compatible with the viewpoint of Luo & Bhattacharya (Citation2009), who argue that companies’ participation with CSP leads to mitigating stock price volatility. In other words, stock price volatility is related to the level of risk related to the stock. Therefore, CSP reduces 41 risks from investors’ perspectives and thus mitigates stock price volatility, improving corporate profitability.
Finally, H3 examined the liquidity as a moderator variable between CSP and the profitability of Industrial Companies listed on the ASE. The current study results revealed that liquidity moderates the positive effect of CSP on profitability. This result is compatible with Ramadan et al. (Citation2020), who found that liquidity positively affects profitability. Furthermore, this result is also consistent with Yameen et al. (Citation2019)’s viewpoint about considering liquidity as a significant determinant of profitability. On the other hand, this result is consistent with Al‐Matari (2021), who found that liquidity has a moderate positive relationship between the bank’s profitability score and performance. Based on the above, the results show that CSP significantly positively affects the profitability of industrial companies listed on the ASE. In addition, Stock price volatility moderates the positive effect of CSP on the profitability of industrial companies listed on the ASE. Moreover, liquidity moderates the positive effect of CSP on the profitability of Industrial Companies listed on the ASE.
The market assessment insight on sustainability practices followed by Jordanian companies leaves the possibility for future research. Accordingly, this study offers experiential support for the experts, decision-makers and researchers with information about deploying sustainable environmental, social and governance efforts in enabling companies to attain profit enlargement. Also, strategies and rules that consider sustainability criteria can make long-term value and provide companies with practical benefits.
12. Conclusion
In sum, the study aims to identify the effect of CSP on Profitability. In addition to examining the moderating role of liquidity and stock price volatility in Jordanian industrial companies. Thus, the study utilized 38 Dow Jones Corporate Sustainability Assessment Methodology criteria to measure CSP. Besides (the quick ratio) to measure liquidity, stock price volatility is measured using a formula from previous studies and utilized (Return on Assets) to measure profitability in this study. Moreover, the study collected data from annual reports of the companies listed on the ASE from 2015 to 2020. However, the data set was analyzed using STATA as the study accepted all the hypotheses in this study. Accordingly, The findings indicated a significant impact of corporate sustainability performance on profitability; also, liquidity and stock price volatility moderate the effect of corporate sustainability performance on the profitability of Industrial Companies listed on the Amman Stock Exchange. Lastly, price volatility is also a positive indicator as it helps in trading the shares of the companies and creates demand for the shares in the market. Therefore, the study suggested that companies in Jordan need to keep an adequate level of liquidity to facilitate immediate needs.
13. Limitations and directions for future study
Despite the contributions of this study, some limitations should be addressed in future as the study faced several limitations. Sustainability Data availability is the main limitation, whereas most companies need separate sustainability reporting, which needs to extract the sustainability data manually.
In addition, sustainability reporting is varied among companies because it is voluntary and lacks a standardized structure. Thus, this is a problem when relaying sustainability information to investors. Another area for improvement is the weak identification of sustainability performance indicators.
Based on the study findings, further research is needed to outline and classify suitable corporate financial indicators and how they correlate to sustainability performance procedures. Further research is needed to facilitate the understanding of the association between corporate sustainable performance and profitability. More research is needed to examine the impact of the total sustainability performance score and to closely establish the collective effect of all three dimensions to decrease the difference in theory and empirical findings. Finally, Studies from developing countries still need to be made available.
Disclosure statement
No potential conflict of interest was reported by the authors.
Additional information
Funding
References
- Abbade, E. B., de Vargas Mores, G., & Spanhol, C. P. (2014). The impact of entrepreneurial orientation on sustainable performance: Evidence of MSMES from Rio Grande do Sul. Revista de Gestão Social e Ambiental, 8(2), 49–17.
- Ahmad, M. A., Alrjoub, A. M. S., & Alrabba, H. M. (2018). The effect of dividend policy on stock price volatility: Empirical evidence from Amman stock exchange. Academy of Accounting and Financial Studies Journal, 22(2), 1–8. https://doi.org/10.13140/RG.2.2.26262.09289
- Ajide, F. M., & Aderemi, A. A. (2014). The effects of corporate social responsibility activity disclosure on corporate profitability: Empirical evidence from Nigerian commercial banks. IOSR Journal of Economics and Finance (IOSRJEF), 2(6), 17–25. https://doi.org/10.9790/5933-0261725
- Al-Dhunaibat, A., & Muhammad, A. (2017). The impact of profitability in managing profits in industrial companies listed on the ASE. Jordan Journal of Business Administration, 13(2), 23.
- Ali, M. M., Hussin, N. N. A., & Ghani, E. K. (2019). Liquidity, growth and profitability of non-financial public listed Malaysia: A Malaysian evidence. International Journal of Financial Research, 10(3), 194–202. https://doi.org/10.5430/ijfr.v10n3p194
- Alshehhi, A., Nobanee, H., & Khare, N. (2018). The impact of sustainability practices on corporate financial performance: Literature trends and future research potential. Sustainability (Switzerland), 10(2). https://doi.org/10.3390/su10020494
- ASE (ASE). The ASE issued a circular to its members regarding the re-circulation on Sunday, 10/5/2020. Access on 28/July/2020: https://www.ase.com.jo/ar/faqs
- Awang, M. M., Kutty, F. M., & Ahmad, A. R. (2014). Perceived social support and well being: First-Year student experience in university. International Education Studies, 7(13), 261–270. https://doi.org/10.5539/ies.v7n13p261
- Barnett, M. L., & Salomon, R. M. (2006). Beyond dichotomy: The curvilinear relationship between social responsibility and financial performance. Strategic Management Journal, 27(11), 1101–1122. https://doi.org/10.1002/smj.557
- Baskin, J. (1989). Dividend policy and the volatility of common stocks. Journal of portfolio management, 15(3), 19–25. https://doi.org/10.3905/jpm.1989.409203
- Despotovic, M., Nedic, V., Despotovic, D., & Cvetanovic, S. (2016). Review and statistical analysis of different global solar radiation sunshine models. Renewable and Sustainable Energy Reviews, 52, 1869–1880. https://doi.org/10.1016/j.rser.2015.08.035
- Dincel, C., & Gungor, N. (2018). Does corporate sustainability practices impact financial performance: A study based on BIST manufacturing firms. Pressacademia, 8(1), 9–13. https://doi.org/10.17261/pressacademia.2018.971
- Donaldson, T., & Lee, E. P. (1995). The stakeholder theory of the 45 corporation: Concepts, evidence, and implications. Academy of Management Review, 20(1), 65–91. https://doi.org/10.2307/258887
- Dyllick, T., & Muff, K. (2016). Clarifying the meaning of sustainable business: Introducing a typology from business-as-usual to true business sustainability. Organization & Environment, 29(2), 156–174. https://doi.org/10.1177/1086026615575176
- Eccles, R. G., Krzus, M. P., Rogers, J., & Serafeim, G. (2016). The need for sector-specific materiality and sustainability reporting standards. Journal of Applied Corporate Finance, 24(2), 65–71. https://doi.org/10.1111/j.1745-6622.2012.00380.x
- Flammer, C. (2013). Corporate social responsibility and stock prices: The environmental awareness of shareholders. Academy of Management Journal, 56(3), 758–781. https://doi.org/10.5465/amj.2011.0744
- Fombrun, C., Gardberg, N., & Sever, J. (2000). The Reputation QuotientSM: A multi-stakeholder measure of corporate reputation. Journal of Brand Management, 7(4), 241–255. https://doi.org/10.1057/bm.2000.10
- Freeman, R. E. (1999). Divergent Stakeholder Theory. Academy of Management Review, 24(2), 233–236. https://doi.org/10.2307/259078
- Freeman, R. E. (2010). Strategic management: A stakeholder approach. Cambridge university press.
- Friedman, M. (1962). Capitalism and Freedom. The University of Chicago Press.
- Galindo-Manrique, A. F., Pérez-Calderón, E., & Rodríguez-García, M. D. P. (2021). Eco-efficiency and stock market volatility: Emerging markets analysis. Administrative Sciences, 11(2), 36. https://doi.org/10.3390/admsci11020036
- Hair, J. F., Anderson, R. E., Babin, B. J., & Black, W. C. (2010). Multivariate data analysis: A global perspective (7th) ed.). Pearson.
- Hair, J. F., Jr, Sarstedt, M., Ringle, C. M., & Gudergan, S. P. (2017). Advanced issues in partial least squares structural equation modeling. Sage Publications.
- Harjoto, M., Laksmana, I., & Lee, R. (2015). Board diversity and corporate social responsibility. Journal of Business Ethics, 132(4), 641–660. https://doi.org/10.1007/s10551-014-2343-0
- Hatane, S. E., & Soewarno, N. (2022). Corporate social responsibility and internationalization in mitigating risk. International Journal of Sustainable Society, 14(3), 221–242. https://doi.org/10.1504/IJSSOC.2022.125647
- Hategan, C. D., Sirghi, N., Curea-Pitorac, R. I., & Hategan, V. P. (2018). Doing well or doing good: The relationship between corporate social responsibility and profit in Romanian companies. Sustainability, 10(4), 1041. https://doi.org/10.3390/su10041041
- Huang, -H.-H., Chan, M.-L., Huang, I.-H., & Chang, C.-H. (2011). Stock price volatility and overreaction in a political crisis: The effects of corporate governance and performance. Pacific-Basin Finance Journal, Elsevier, 19(1), 1–20. https://doi.org/10.1016/j.pacfin.2010.08.001
- Ji, Q., Bouri, E., & Roubaud, D. (2019). A dynamic network of implied volatility transmission among US equities, strategic commodities, and BRICS equities. International Review of Financial Analysis, 57, 1–12. https://doi.org/10.1016/j.irfa.2018.02.001
- Karlsson, J., & Bäckström, S. L. (2015). Corporate sustainability and financial performance: The influence of board diversity in Swedish.
- Kinasih Yekti Nastiti, P., Atahau, A. D. R., & Supramono, S. (2019). Working capital management and its influence on profitability and sustainable growth. Verslas: Teorija Ir praktika/Business: Theory and Practice, 20, 61–68. https://doi.org/10.3846/btp.2019.06
- Knoepfel, I. (2001). Dow Jones Sustainability group index: A global benchmark for corporate sustainability. Corporate Environmental Strategy, 8(1), 6–15. https://doi.org/10.1016/S1066-7938(00)00089-0
- Kotabe, M. M., & Helsen, K. (2020). Global marketing management. John Wiley & Sons.
- Lourenço, I. C., Branco, M. C., Curto, J. D., & Eugénio, T. (2012). How does the market value CSP? Journal of Business Ethics, 108(4), 417–428. https://doi.org/10.1007/s10551-011-1102-8
- X., & Bhattacharya, C. B. (2009). The debate over doing good: Corporate social performance, strategic marketing levers, and firm-idiosyncratic risk. Journal of Marketing, 73(6), 198–213.
- Lüpsen, H., & Rechenzentrum, R. Anova with binary variables-Alternatives for a dangerous F-test.
- Manullang, S., & Hutabarat, F. (2020). Sustainable growth and liquidity on profitability: A study on mining sector companies listed at Indonesia stock exchange in 2018. Jurnal AKSI (Akuntansi Dan Sistem Informasi), 5(1), 24–29. https://doi.org/10.32486/aksi.v5i1.470
- Morgan, A. K., Awafo, B. A., & Quartey, T. (2021). The effects of COVID-19 on global economic output and sustainability: Evidence from around the world and lessons for redress. Sustainability: Science, Practice and Policy, 17(1), 76–80. https://doi.org/10.1080/15487733.2020.1860345
- Purbawangsa, I. B. A., Solimun, S., Fernandes, A. A. R., & Rahayu, S. M. (2019). Corporate governance, corporate profitability toward corporate social responsibility disclosure and corporate value (comparative study in Indonesia, China and India stock exchange in 2013-2016). Social Responsibility Journal, 16(7), 983–999. https://doi.org/10.1108/SRJ-08-2017-0160
- Ramadan, A., Abdel Hakam, & Ibrahim. (2020). The impact of administrative efficiency, solvency and liquidity on the profitability of Egyptian insurance companies. Journal of Financial and Commercial Research, 21( first issue), 514–558.
- Rizki, M. K., Agriyanto, R., & Farida, D. N. (2019). The effect of sustainability report and profitability on company value: Evidence from Indonesian Sharia shares. Economica: Jurnal Ekonomi Islam, 10(1), 117–140. https://doi.org/10.21580/economica.2019.10.1.3747
- Salem, A. Z. (2015). The role of financial ratios for forecasting the share prices of Jordanian public joint-stock industrial companies listed on the ASE. Test study. Middle East University.
- Shabbir, M. S., & Wisdom, O. (2020). The relationship between corporate social responsibility, environmental investments and financial performance: Evidence from manufacturing companies. Environmental Science and Pollution Research, 27(32), 39946–39957. https://doi.org/10.1007/s11356-020-10217-0
- Shakil, M. H. (2022). Environmental, social and governance performance and stock price volatility: A moderating role of firm size. Journal of Public Affairs, 22(3), e2574. https://doi.org/10.1002/pa.2574
- Siregar, B. (3). The effect of profitability, liquidity, and solvency on sustainable reporting with corporate governance as moderating variable. Journal of International Conference Proceedings (JICP), 5(), 79–87. https://doi.org/10.32535/jicp.v5i3.1761
- Tarmuji, I., Maelah, R., & Tarmuji, N. H. (2016). The impact of environmental, social and governance practices (ESG) on economic performance: Evidence from ESG score. International Journal of Trade, Economics and Finance, 7(3), 67. https://doi.org/10.18178/ijtef.2016.7.3.501
- Turban, D. B., & Greening, D. W. (1997). Corporate social performance and organizational attractiveness to prospective employees. Academy of Management Journal, 40(3), 658–672. https://doi.org/10.2307/257057
- Van Stekelenburg, A., Georgakopoulos, G., Sotiropoulou, V., Vasileiou, K. Z., & Vlachos, I. (2015). The relation between sustainability performance and stock market returns an empirical analysis of the dow jones sustainability index Europe. International Journal of Economics and Finance, 7(7), available at. https://doi.org/10.5539/ijef.v7n7p74
- Whetman, L. L. (2018). The impact of sustainability reporting on firm profitability. Undergraduate Economic Review, 14(1), 4. https://digitalcommons.iwu.edu/uer/vol14/iss1/4/
- Wood, D., & Ross, D. G. (2006). Environmental social controls and capital investments: Australian evidence. Accounting and Finance, 46(4), 677–695. https://doi.org/10.1111/j.1467-629X.2006.00180.x
- Yameen, M., Farhan, N. H., & Tabash, M. I. (2019). The impact of liquidity on firms’ performance: Empirical investigation from Indian pharmaceutical companies. Academic Journal of Interdisciplinary Studies, 8(3), 212212. https://doi.org/10.36941/ajis-2019-0019
- Zhang, J., Djajadikerta, H. G., & Zhang, Z. (2018). Does sustainability engagement affect stock return volatility? Evidence from the Chinese financial market. Sustainability, 10(10), 3361. https://doi.org/10.3390/su10103361
- Zyadat, A. A. H. (2016). The impact of sustainability on the financial performance of Jordanian Islamic banks. International Journal of Economics and Finance, 9(1), 55–63. https://doi.org/10.5539/ijef.v9n1p55