
 ?Mathematical formulae have been encoded as MathML and are displayed in this HTML version using MathJax in order to improve their display. Uncheck the box to turn MathJax off. This feature requires Javascript. Click on a formula to zoom.
Abstract
The purpose of this study is to investigate the integration of forensic accounting and big data technology frameworks in relation to the mitigation of internal fraud risk in the banking industry. This study employed an explanatory research design involving the use of simulated data to mirror the situation in the banking industry. To this end, the big data analytical approach considered is machine learning that involves a neural network with two-layer feed forward, one hidden layer and five hidden neuron layers created to detect the presence of fraud and classify them into two, viz.: fraudulent and non-fraudulent activities. Both the input and output target samples are automatically divided into training, validation, and test datasets, while the confusion matrix is employed to visualise the percentages of correct and incorrect classifications. Furthermore, the clustering of the fraud indicators was also carried out to group them based on their similarities. The results obtained demonstrate the feasibility of neural networks in classifying internal fraud into three levels of risks and fraud detection. This is evidenced in the percentage of correct classification (95%) and misclassification (5%) obtained from the confusion matrix. The model also demonstrates the feasibility of clustering the potential red flags of internal fraud. This study provides an understanding into the attributes of internal fraud and a practical guided approach to implement an integrated forensic accounting and big data technology framework for internal fraud mitigation. The forensic accountant should ensure that the machine learning models are regularly updated with new datasets for automatic classification and clustering analysis. There is still scanty information regarding the integration of forensic accounting and big data technology for mitigation of internal fraud risk in the banking industry. Hence, it is envisaged that this study will contribute to the method, theory and practise of internal fraud mitigation.
1. Introduction
According to the Association of Certified Fraud Examiners (ACFE; Citation2012), fraud involves the use of one’s occupation for personal benefit through a deliberate misappropriation of the organisation’s resources. Many reports and authors opined that fraud is a deliberate act marked with deception, violation of trust and concealment with the aim of siphoning organisation’s resources for personal gains (American Institute of Certified Public Accountants (AICPA), Citation2002; Institute of Internal Auditors (Citation2009); Ramamoorti et al. (Citation2014); Hamilton & Justin, Citation2012:114). Idolor (Citation2010) also stated that corporate fraud could also be in the form of forgery, record falsification, theft or conversion of the organisation’s assets into personal use.
Ezejiofor et al. (Citation2016) classified fraud perpetration into three types, namely: internal, external and mixed fraud. The focus of this study is on internal fraud, which is regarded as the fraud perpetrated by the employees of an organisation.
Existing fraud theories such as the fraud triangle theory, fraud diamond theory and fraud box key model have linked fraud perpetration to possible causes such as opportunity, pressure, rationality, capability (knowledge of the organisation’s system and ability to manipulate it), as well as absence of good corporate governance (Cressey, Citation1973; Wolfe & Hermanson, Citation2004; Okoye & Onodi, Citation2014). Bhasin (Citation2015) stated that many banks still rely on customers’ complaints, whistle-blowers, internal audits and random verification to combat fraud. This may be challenging due to the complex nature of fraud marked by deception, concealment, conspiracy and destruction of evidence, often making fraud detection a daunting task. However, the development of a robust internal control mechanism to detect and prevent fraud is one of the core responsibilities of the organisation’s management.
The effect of fraud on organisations could be detrimental resulting in financial loss, operational inefficiencies, customers’ dissatisfaction and reputational loss (Bhasin Citation2020a, Citation2011). This implies that for an organisation to achieve operational excellence, goodwill and its bottom-line of profitability, fraud incidences must be tackled and minimised. According to Klein (Citation2015), business organisations lose up to 5% of their revenues yearly to fraud. In relation to the 2013 estimated gross world product, this estimated revenue loss accounts for about USD3.7 trillion in gross loss globally (Bhasin, Citation2015; Klein, Citation2015).
The success of forensic accounting for fraud mitigation is partly a function of the tools employed for data analytics (Hamdan, Citation2018). Most forensic accounting, especially in emerging economies, face challenges in the area of deployment of the data analytical tools for fraud investigation due to lack of the required skills or expertise. This has slowed down the full emergence of forensic accounting for fraud detection in some countries (Akhidime & Uagbale-Ekatah, Citation2014). The choice of the forensic accounting investigative tool is partly a function of the skills and expertise of the forensic investigator and this has a major effect on the outcome of the investigation process. The process of fraud investigation and detection in organisations is increasingly becoming more dynamic and complex. The dynamic nature of fraudulent schemes and changes in accounting principles, procedures and policies often complicate the fraud investigation processes (Ozili, Citation2018). This is coupled with the fact that fraud investigation and detection in this digital era is marked with conspiracy, deception and concealment, which often make it a daunting task to unravel the root cause and the perpetrators (Enofe et al., Citation2017; Ezejiofor et al., Citation2016). Due to this, a combination of the knowledge, skill, and experience of a forensic accountant plays a major role in fraud detection. Thus, this necessitates the use of advanced and cognitive analytics. Forensic accountant needs to be kept abreast of the recent advances in data analytics domain to prevent absolute reliance on the traditional data analytics for uncovering fraud in this digital era. Traditional data analytics techniques might be tedious, time-consuming and less effective in this era of emerging digital technologies. For instance, where there is vast amount of data of different types garnered from different sources, more time and personnel may be needed to support the workflow in the traditional data analytics. Hence, the need for the use of the big data technology. Mckinsey Global Institute (Citation2011) and Warren et al. (Citation2015) opined that the high volume and high variety nature of big data may be difficult to manage by the traditional data analytic techniques. Although traditional data analytic techniques are still useful for visualisation of datasets, advanced and cognitive analytics boast of more flexibility and automation of the data analysis phase, thus eliminating the rigour of manual work and susceptibility to human error. Advanced and cognitive analytics also boast of high computational efficiency, and data narrative, which can guide forensic accountants to make informed conclusion about suspected fraud cases.
Forensic accounting implementation frameworks geared towards fraud mitigation have been developed in recent studies. The motivation for this study is the quest to integrate forensic and big data technology that has not been reported in the existing literature. The aim of this study is to investigate the integration of forensic accounting and big data technology frameworks in relation to the mitigation of internal fraud risk in the banking industry. This study provides an understanding into the attributes of internal fraud and a practical guided approach to implement an integrated forensic accounting and big data technology framework for internal fraud mitigation.
This study finds that the integration of big data technology into the forensic accounting framework can enhance the data analysis phase of the forensic accounting framework. The machine learning approach employed for the simulated data in this study shows feasibility for achieving fraud classification and clustering of the potential red flags for internal fraud perpetration. The rest of the paper is organised as follows: the second section presents the overview of the existing literature review, while the third section presents the methodology employed in this study. This is followed by the results and discussion in the fourth section, while the last section presents the conclusion and recommendation drawn from the outcome of the study in relation to the study objectives.
2. Literature review
The literature review in this section comprises an overview of some existing works on internal fraud, forensic accounting and big data technology.
2.1. Internal fraud
Internal fraud has been defined as the fraud perpetrated by an organisation’s employee (Ezejiofor et al., Citation2016; Kumar & Sriganga, Citation2014; Srivastava & Bhatnagar, Citation2021). Modugu and Anyaduba (Citation2013) indicated that an organisation’s employee can take undue advantage of the perceived loop holes in the control structure of an organisation coupled with easy access to organisation’s information to perpetrate and conceal fraud. Hinde (Citation2003) opined that that many organisation’s security breaches aimed at fraud perpetration can be traced to internal employees directly or indirectly through collaboration with the people outside the organisation.
According to Chartered Institute of Management Accountants (Chartered Institute of Management Accountants, CIMA, Citation2008), internal fraud can be divided into three broad categories: asset misappropriation (cash and non-cash), fraudulent statement (financial and non-financial) and corruption (conflict of interest and bribery or extortion). The most common of the types of internal fraud is asset misappropriation. This happens when an employee steals or mismanage the organisation’s resources. Examples include cash theft, fraudulent billing, inventory, or inflated reimbursement (Agarwal, Citation2022). On the other hand, financial statement fraud involves intentional error or omission such as presentation of false statements, forgery, record alteration, etc., in the financial reporting purposely to deceive the financial statement users (Kenyon & Tilton, Citation2011). In financial statements, fraud perpetrators deliberately present incorrect financial statements to deceive or misinform the users of such information (Rezaee, Citation2005).
The third category of fraud: corruption occurs whenever an employee abuses personal influence to impinge on the tenants of business transactions, as in the cases of bribery or conflicts of interest (Venegas, Citation2012). Srivastava and Bhatnagar (Citation2021) identified some factors that promote internal frauds such as weak internal control system, lack of the required expertise and technology to combat internal fraud amongst others. The authors suggested that a data driven approach is more effective than the conventional approaches employed by many banks in tackling internal fraud.
Kenyon and Tilton (Citation2011) and Clayton (Citation2011) identified some potential red flags, which are indicators of internal fraud perpetration. These include:
multiple customers’ complains
unusual reimbursement
duplicate invoices or transactions
non-standard or suspicious journal entries
activities in dormant or controversial accounts
consistent errors, alterations or discrepancies in financial or accounting records,
unrecorded or incomplete documentation of transactions
false documentations or forgery
unauthorised transactions
missing documents that could serve as evidences
provision of photocopies without the original documents.
Kenyon and Tilton (Citation2011) and Clayton (Citation2011) further explain the need for a fraud investigator to have a good understanding of the motivation for fraud perpetration and the nature of transaction carried out as this will aid the identification of the areas where fraud is perpetrated. Potential red flags could also indicate the attributes of some employees who commit fraud. A fraud investigator must also be able to identify the potential red flags and also be aware of the trends and irregularities connected to the potential red flags, including areas that require further analysis or monitoring. The potential red flags can be detected via physical inspection or observation and can also be detected through review or analysis of the dataset (Kenyon & Tilton, Citation2011). Clayton (Citation2011) indicated that data analytics can aid the identification of high fraud risk, suspicious journal entries and other potential red flags of fraud. The identification of red flags could also aid the process of fraud investigation, detection and prevention (Kenyon & Tilton, Citation2011).
However, the development of robust management control systems with effective internal control mechanisms, that will ensure transaction approvals, proper monitoring, access and staff controls, can aid the mitigation of internal fraud perpetration. Venegas (Citation2012) proposed a framework for internal fraud control, which links the control environment to the risk management processes. The risk management processes comprise three major components, namely: control activities, control procedures and monitoring procedures. Pizzi et al. (Citation2021) proposed the digital transformation on internal auditing. The study revealed that the digital transformation of the internal auditing process could positively impact the processes of continuous auditing, fraud detection, data analytics and technological innovation Pizzi et al. (Citation2021). Furthermore, the use of Blockchain technology as a tool for professional auditing to improve business information systems and prevent fraud in a time effective manner has also been proposed (Lombardi et al., Citation2021). Although, it was reported that the Blockchain technology could potentially disrupt the auditing system at the initial stage, the positive effect on auditing tradition and activities was highlighted by Lombardi et al. (Citation2021). In addition, there have been recent discussions about smart contracts enabling Audit 4.0 to promote transparency, reporting and reporting disclosure (Lombardi et al., Citation2021).
2.2. Forensic accounting
Forensic accounting is a technique that integrates the conventional accounting system into the legal framework for the purpose of fraud mitigation (Gerson et al., Citation2011). Bassey and Ahonkhai (Citation2017), stated that forensic accounting takes into cognisance the principles of accounting, investigative and legal procedures for tackling fraud. As a fraud mitigating tool, forensic accounting can detect both internal and external fraud schemes. It has a framework for information gathering, fraud investigation, data analytics, risk assessment, fraud detection and litigation (Modugu & Anyaduba, Citation2013; Akinbowale et al., Citation2020b). There exists a consensus among the authors that forensic accounting can be employed for fraud detection, investigation and fraud examination or analysis (Akinbowale et al., Citation2020a; Huber, Citation2017; Kranacher & Riley, Citation2019; Liodorova & Fursova, Citation2018; Perduv et al., Citation2018; Serhii et al., Citation2019; Shimoli, Citation2015). However, the lack of the required expertise, choice of data analytics techniques and implementation frameworks are some of the identified challenges mitigating effective implementation of forensic accounting for fraud mitigation.
Some existing studies have highlighted the nature of skill and expertise required by a professional forensic accountant for fraud investigation. These include accounting, auditing, investigative, legal and data analytics skills amongst others (Akinbowale et al., Citation2020b; Ozili, Citation2015). Some authors have indicated the need for the incorporation of forensic accounting education in the curriculum of academic institutions so that students can acquire the basic forensic accounting skills and knowledge during their academic programmes improve their expertise (Efiong, Citation2012; Kramer et al., Citation2017; Rezaee et al., Citation2016; Seda et al., Citation2019).
To mitigate this, forensic accounting implementation frameworks geared towards fraud mitigation have been developed (Akinbowale et al., Citation2020b, Citation2021). However, the integration of forensic accounting and big data technology has not been reported in the existing literature. The success of forensic accounting implementation for fraud mitigation is partly a function of the tools employed for data analytics (Hamdan, Citation2018). According to Ozili (Citation2018), the theory of forensic accounting indicates that the decisions after forensic investigation are a reflection of the forensic techniques employed. To promote the reliability and success of forensic accounting investigation, this study attempts to integrate the forensic accounting framework and big data technology.
2.3. Big data technology
The word “big data” is used to refer to vast amount of data collected at high velocity and from diverse sources for processing to make informed decisions (De Dott, Citation2020). There are three key attributes that are commonly used to describe the “big data.” These are, namely: high volume (vast size or amount of data garnered), high velocity (the speed at which the data was collected) and high variety (the diverse sources from which the data were garnered; Arnaboldi et al., Citation2017; De Dott, Citation2020; Moffitt & Vasarhelyi, Citation2013; Vasarhelyi et al., Citation2015; Yoon et al., Citation2015; Zhang et al., Citation2015). Thus, big data can be defined as a collection of high volume data of different types and from different sources. The process of scrutinizing, pre-processing and analysing big data to obtain useful information such as detection of certain trends or patterns to make an informed decision is usually referred to as big data analytics (Cao et al., Citation2015).
Clayton (Citation2011) as well as Kenyon and Tilton (Citation2011) suggested data analytics involving the use of data mining techniques for the investigation of suspected fraud cases. The authors indicated that the use of data mining techniques could aid pattern recognition (detection of irregular patterns and other anomalies in transactions). It could also provide a summary of activities related to transactions and other internal fraud red flags. Kumar and Sriganga (Citation2014) suggested that by leveraging on the power of data analytics, organisations can minimise the occurrence of internal fraud.
In data mining, the clustering analysis can aid the classification of information with similar features, while the association rules can assist in establishing the existing relationships within the dataset. The regression analysis can assist in the determination of the magnitude of changes in the data pattern when certain variables are changed. Hence, the application of data mining techniques can enhance data processing and promote the reliability of the acquired information in the quest to mitigate fraud (Kumar & Sriganga, Citation2014; Miller & Martson, Citation2011) pointed out the prevalent frauds perpetrated internally in banks. This study further classified internal fraud into different types with a focus on the data mining technique used for detecting internal frauds. There is a consensus among the authors that the implementation of big data technology can assist in uncovering corporate fraud (Yoon et al., Citation2015; Cao et al., Citation2015; Vasarhelyi et al., Citation2015; Rahmawati et al., Citation2016 &, Citation2017; Jans et al., Citation2011; Baader & Krcmar, Citation2018; Werner, Citation2016; Tang & Karim, Citation2019; Dagilienė & Klovienė, Citation2019; Chiu et al., Citation2020; Balios et al., Citation2020). Nonetheless, the absence of quality data, lack of the required expertise as well as implementation frameworks are some issues mitigating effective deployment of the big data technology for fraud mitigation.
2.4. Forensic big data analytics
Bhasin (Citation2016) stated that data analytics can assist forensic investigation in the process of fraud investigation. Cusack and Ahokov (Citation2016) explained that the data analytical technique can be used for fraud detection via data acquisition and analysis using specialised software to detect anomalies in the trends or patterns of the acquired data. The big data analytic process can provide vital and credible information to a forensic investigator in detecting certain patterns and trends or anomalies within a dataset (Clayton, Citation2011; Decker et al., Citation2011; Kenyon & Tilton, Citation2011; Miller & Martson, Citation2011). The investigative process of forensic accounting comprises forensic analytics involving evidence gathering and data analysis in order to obtain evidences admissible in the court (Nigrini, Citation2011). However, many forensic analytic tools such as quantitative methods such as the Benford’s Law, benchmarking, time-series methods, risk scoring, etc., have been reported (Nigrini, Citation2011). The forensic analytical tools could also range from the use of common software such as MS Excel and MS Access for a small dataset to the ones that can handle large datasets such as the MS SQL Server and Oracle (Decker et al., Citation2011). The use of software packages such as the Statistical Analysis System (SAS) and Statistical Package for Social Science (SPSS) for statistical analyses can also be used for data analysis (Decker et al., Citation2011). However, the use of the big data and machine learning approach in forensic analytics is still evolving and has not been sufficiently highlighted by the existing literature. Mittal et al. (Citation2021) stated that the integration of big data technologies into the forensic accounting domain can facilitate fraud mitigation. The integration of big data analytics, specifically machine learning, into the forensic analytic framework can assist forensic accountants to quickly and effectively identify and investigate the root causes of fraud incidences and prevent future occurrences. The machine learning technique is also flexible and can be combined with statistical concepts to develop a cognitive analytic framework that forensic accountants can employ to detect the motives and methods of the fraudsters with improved sensing capabilities for large dataset. Data mining techniques can be integrated into the data analysis phase of the forensic accounting framework to achieve fraud detection or prediction, data clustering and classification in order to obtain outputs such as suspicion scores or rules to visualise anomalies in a dataset. This can enable the generation of association rules, identification of relationships, identification of customers’ approval patterns, etc., that can enable easy tracing of trends and suspicious transactions.
From the literature reviewed, it is obvious that there is still a death of information regarding the integration of forensic accounting and big data technology for mitigation internal fraud risk in the banking industry. Hence, it is envisaged that this study will contribute to the method, theory and practise of internal fraud mitigation.
3. Methodology
This study employed an explanatory research design involving the use of simulated data to mirror the situation in the banking industry. For the purpose of this study, the big data analytical approach considered is the machine learning.
Machine learning is a blend of numerous computer algorithms, which allows the computer to accomplish a task without difficult coding (Raghavan & Gayar, Citation2019). The machine-learning model learns by training the datasets and decision or predictions can be made based on the historical data trained. Fraud is dynamic in nature and the recent technological advancement coupled with the creative methods employed by the fraudsters necessitates the use of a versatile algorithm capable of studying historical data and identifying anomalies in the dataset. Compared to the rules-based approach, the machine learning approach was preferred in this study because of its capability to study historical data, and establish a relationship, which is useful for making future predictions. It is also time effective and can accelerate fraud detection. In addition, it can identify hidden correlations between the data in real time and classify transactions as normal or fraudulent. The rules-based system approach is a knowledge-based approach, which employs a series of “IF-THEN” statements to reach a conclusion based on certain rules or logic. The rules-based system applies a set of rules to deal with data or some established facts about a situation (Liu & Cocea, Citation2015). Since fraud has different features with different peculiarities, it implies that different rules must be created for different fraud cases, which might be tedious and time-consuming. With the emerging digital technologies, which characterise modern banking operations, a robust algorithm that can handle the complexity and volume of transactions will be more efficient in combating fraud. Machine learning algorithms can trace or detect hidden transactions and update detected patterns in real time. The higher the volume of dataset fed into the network, the higher its precision for fraud detection.
The following subsection elaborate more in these topics.
3.1. Framework for the integration of forensic accounting and big data technology
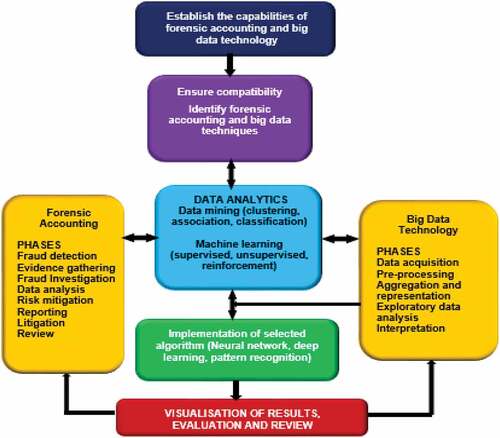
Figure presents the proposed framework for the integration of forensic accounting and big data technology for fraud mitigation. Analysis from big data technology can be combined with other evidence acquired by the forensic accounting investigators to substantiate or refute a suspected fraud case. Besides, the forensic accounting investigators can employ the big data analytic techniques such as data mining, machine learning, etc., to uncover fraud cases rather than relying on the traditional data analytics, where a centralized database architecture is employed to store and manage acquired data in a fixed format.
Figure 1. Proposed framework for the integration of forensic accounting and big data technology for fraud mitigation.
A forensic accountant might consider the combination of the data mining and machine learning for investigating suspected fraud cases such as unauthorized changes in the master vendor file, cheque alteration, ghost employees, unauthorized changes in wages or salary falsification, unapproved commissions or corruption schemes, fraudulent expense reimbursements, theft of cash receipts, inventory schemes, as well as fraudulent financial statements amongst others.
In the context of fraud investigation by a forensic accountant, big data relate to the acquisition of vast and diverse amount of datasets, which may include structured, semi-structured and unstructured data. The data may be acquired in different volumes thus making it difficult to process or manage using traditional data analytics. Big data can drive the machine learning towards uncovering trends, hidden patterns and relationships in large amounts of raw data in order to make informed decisions (Ngai et al., Citation2011).
Sometimes, forensic accountants are faced with the challenges of combining the pieces of evidence gathered from different sources. Thus, the big data analytics can aid the integration of the different types of information from multiple sources and transform them into a valuable information in deciding suspected fraud cases. In some cases, it can be combined with the traditional data analytics’ and experts’ opinion to substantiate evidence of fraud incidences.
The following are the requirements for the integration of the forensic accounting and big data technology as shown in Figure .
Establish the capability of both techniques and their investigators (forensic accounting and big data techniques) as well as the scope of the suspected fraud case.
Establish the scope of the data and evidence available for analysis.
Establish the compatibility of forensic accounting and big data techniques. The proposed machine learning techniques works more effectively when used for the analysis of big data (vast amount of data of different types and sources). In a situation where there is limited amount of data for analysis, the traditional data analytics may be considered.
Establish the type of analysis to be carried out and select the right dig data analytic technique.
For instance, when the focus of the investigator is to detect hidden patterns, trends, anomalies or relationship in the dataset, the data mining approach can be considered. The data mining comprises of the following phases: data acquisition, selection of the target data from the data pool, data pre-processing, data transformation and analysis, pattern identification and evaluation.
On the other hand, the machine learning algorithms can train historical data or information which represents the relationships in the dataset to build models to predict future outcomes. Once the historical data is trained, the machine can apply learnt patterns on new dataset to better and future predictions. Depending on the nature of data available and the scope of investigation, it can be achieved under the supervised, unsupervised, reinforcement or deep learning environments. Under the supervised learning environment, the machine is trained to learn, recognise patterns and make predictions using labelled dataset (input and output datasets). Conversely, under the unsupervised learning environment, the machine is trained to learn, recognise patterns and make predictions using unlabelled dataset (input dataset only). For the reinforcement learning environment, the machine is trained to learn, recognise patterns and make predictions from unfamiliar dataset using trial and error approach. The deep learning is a subset of the machine learning having advanced neural networks inspired by biological neural networks. The neural network has nodes with interconnected layers which communicates with each other to analyse high volume input dataset.
The first step in the implementation of this proposed framework is to establish the capabilities of forensic accounting and big data technology depending on the nature of the suspected fraud case to be investigated. Generally, a forensic accountant must possess strong investigative and analytical capabilities, with a good understanding of the accounting and legal principles (Akinbowale et al., Citation2020b). The capability and big data analytics skills of the fraud investigator must also be established. These include data preparation and exploration, real-time analytics and reporting, data integration and management skills amongst others. Since forensic accounting and big data technology have different techniques based on the need or requirements, there is a need to ensure compatibility of the forensic accounting and big data technique geared towards fraud mitigation. The selection of the right choice of technique is crucial to the success of the investigation and analysis (Hamdan, Citation2018). In the data analysis phase of the forensic accounting implementation, big data techniques can be used depending on the fraud case to be investigated. For instance, the data analytic techniques can be used for investigating cases relating to accounts payables, payroll, cash disbursements and reimbursements, journal entries, master vendor lists, accounts receivables and cash receipts, inventory, financial ratios, etc. The use of forensic accounting software and data analytics can allow forensic investigators to carry out multiple tasks in a fraction of the time on all the identified potential red flags.
Data mining techniques with clustering, association, or classification rules can be employed for extracting valuable information from large amount of data. It is suitable for discovering accurate, unique and useful patterns in the data. On the other hand, the machine learning can be employed under the supervised, unsupervised, reinforcement or deep learning environments for investigation and future predictions from historical data.
This study employs simulated data for the implementation of the big data analytics. Specifically, the machine learning approach was used under the supervised learning environment. Under the supervised learning environment, the input and output data are given and the input dataset is trained to obtain the predicted output.
3.2. Procedure for the classification analysis
The literature survey highlights 11 potential red flags for internal fraud in the banking industry. A forensic accountant can leverage on the potential red flags identified to detect fraud or monitor employees and transactions. First, a forensic accountant needs to carry out a preliminary analysis of the potential red flags to understand their features, the employees linked to these indicators and scope of occurrence. As it relates to fraud mitigation, the preliminary analysis will provide an insight into the risk levels of the fraud indicators. Based on the risk levels, risk scores can be allocated to the fraud indicators. Thereafter, a forensic accountant may apply machine learning techniques to the dataset for the purpose of fraud detection or prediction, to obtain outputs such as suspicion scores to detect and visualise anomalies in the dataset. Furthermore, a forensic accountant can also use the machine learning technique to identify the relationships and patterns in the dataset as well as the employees involved. This will enable easy tracking of transactions, identification and investigation of suspected fraud cases.
In this example, the identification of the potential red flags and their risk levels was followed by the allocation of scores to the identified internal fraud indicators. A Neural Network with two-layer feed forward, one hidden layer and five hidden neuron layers was created to detect the presence of fraud and classify them into two, viz., fraudulent and non-fraudulent activities. Both the input and output target samples are automatically divided into training, validation, and test datasets, while the confusion matrix was employed to visualise the percentages of correct and incorrect classifications. The essence of the training dataset is to fit the model so that the model can learn from the input data to make the right classification. On the other hand, the validation test dataset is employed for the optimisation of the model parameters, while the test dataset is employed to evaluate the performance of the classifier model.
The simulation dataset considered of 20 banks with the potential red flags for internal fraud established in the literature by Kenyon and Tilton (Citation2011) and Clayton (Citation2011) are used as the input factors. Scores on a probability scale are allocated to the factors based on the frequency of perpetration in the 20 banks as an example (Table ).
Table 1. Input factors and the allocated scores
Where A represents multiple customers’ complains, B represents unusual reimbursement, C represent duplicate invoices or transactions, D represents non-standard or suspicious journal entries, E represents activities in dormant or controversial accounts, F represents consistent errors, alterations or discrepancies in financial or accounting records, G represents unrecorded or incomplete documentation of transactions, H represents false documentations or forgery, I represents unauthorised transactions, J represents missing documents that could serve as evidences and K represents provision of photocopies without the original documents etc.
The first goal is to build a classifier that can differentiate between a normal activity and a fraud-related activity from the simulated data used as an example in this study. This classification analysis is a supervised learning with input and output variables where the classifier learns how to weight multiple features and produces a generalised mapping that is not over-fitted. One of the major limitations of this approach is that it may misclassify activities that are not included in the historical or input data fed into the network.
The output target variable denoted as “t” has two rows, with the 20 values having either [1;0] for a fraudulent activity or [0;1] for a normal activity (non-fraudulent activity) as shown in Table .
Table 2. Output factors and the allocated values
Having identified the factors, the information is fed into the neural network application in a MATLAB 2020b environment to classify non-fraudulent and fraudulent activities.
The neural network is initialized with random initial weights, and a single-hidden layer feed forward neural network with five hidden layer neurons is created and trained using a scaled conjugate gradient backpropagation. The input and output target samples are automatically divided into training, validation, and test datasets by the developed neural network. The training set is used to teach the neural network and the training continues until the performance goal is met. The test dataset provides an independent measure of the accuracy of the network. The validation dataset is used to measure network generalization, and to stop the training when there is no further improvement in the generalization.
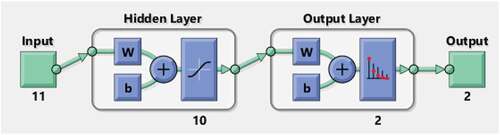
Figure provides the neural network architecture for the fraud detection problem, which comprises 11 inputs (the factors), 10 hidden layers and 2 output layers (which represents the outcome; fraudulent activity or non-fraudulent activity). The hidden layer is a layer between the input and output layers, which performs a non-linear transformation of the inputs where the neurons take in a set of weighted inputs to produce an output through an activation function. Training is an iterative process carried out until the performance goal is met. Otherwise, the weights and bias can be adjusted until the network is adequately trained for predictive purpose. An adequately trained neural network is signalled by a negligible mean square error.
Figure 2. The neural network architecture for fraud detection.
3.3. Procedure for the clustering analysis
The clustering of the fraud indicators presented in Table was also carried out to group the input factors, based on their similarities. The clustering analysis under the unsupervised learning can overcome the limitation of the supervised learning by identifying anomalies in transactions with little or no data. The clustering model can continuously process data and update new data and patterns automatically
Figure presents the architecture for the clustering analysis. This is an unsupervised learning comprising only the inputs (11 identified red flags for internal fraud). The aim is to group the red flags based on their similarities. The architecture consists of a self-organising map with a competitive layer that classifies the dataset of vectors with any number of dimensions into the classes as the layers of the neurons. The neurons are arranged in a 2D topology. This permits the layer to form a representation of the distribution and a two-dimensional approximation of the topology of the dataset. The input factors (11 potential red flags for internal fraud perpetration) in Table were fed as a matrix into the MATLAB 2020b and the developed neural network is trained iteratively with the aid of the Self-Organising Map (SOM) batch algorithm. The SOM algorithm is a good clustering algorithm and was considered for use in this study because its classifications can retain topological information about the similarities in the groups.
Figure 3. The neural network architecture for the clustering analysis.
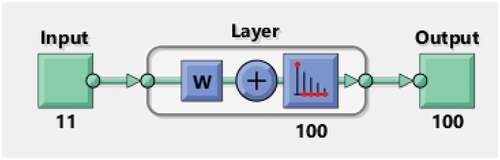
The fraud attributes in Table act as the inputs into the SOM, which maps them onto a 2-dimensional layer of neurons as shown in Figure . The network output is a 100 × 20 matrix, where each ith column represents the jth cluster for each ith input vector with a 1 in its jth element.
4. Results and discusion
This section presents the results obtained for the classification and clustering analysis, respectively.
4.1. Results obtained for the classification analysis
Figure shows the performance of the network measured in terms of mean squared error, shown on a logarithmic scale. Performance is shown for the training, validation, and test sets and the magnitude of the mean square error decreases as the network is trained. The performance goal was met at the 35th epoch with a negligible mean square error value of 8.4094e-05. The number of epochs represents the number of times the iteration was performed before the performance goal was met. The negligible value of the mean square error shows that the network has been adequately trained for fraud classification.
Figure 4. The validation performance goal.
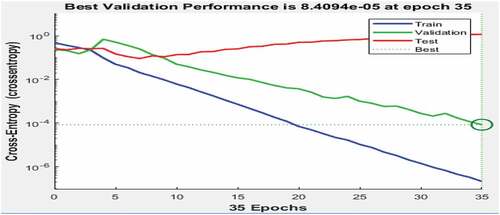
Figure shows the plot of the gradient and validation check after the training of the neural network. The gradient is at 35 epochs. The training stopped at the 35th iteration once the data begins to overfit. The best validation performance shows that there was zero validation failure at the 35th iteration. After the 35th iteration, the validation may show evidence of failure due to overfitting of data.
Figure 5. The gradient and validation check.
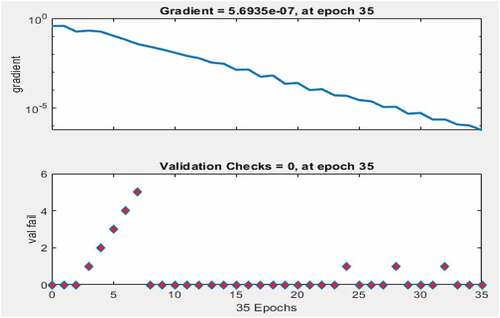
The small values of the gradient () lend credence to the fact that the error is negligible and that there is a high degree of agreement between the target and the output from the network.
Figure shows the error histogram. The error is obtained by finding the difference between the targets and outputs from the network. Large error indicates that the network is not adequately trained and may misclassify the internal fraud indicators. On the other hand, negligible value of error is an indication that the network is adequately trained with minimal chances for misclassification. As shown by the Figure, the values of the error were minimal (not up to 1). The bins represent the number of vertical bars and each of the bars depict the number of samples from the dataset. In this figure, the error histogram comprises 20 bins. The error range is between −0.942 and 0.942. This was divided into 20 smaller bins, and the error is calculated thus;
Figure 6. Error histogram.
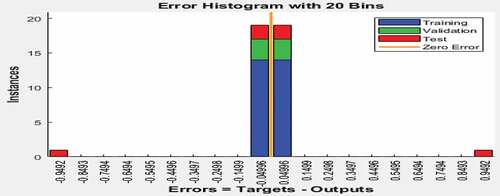
The width of the error corresponds to 0.0942. Furthermore, the error at the left-hand side of the plot was −0.04996 when the vertical height of the bin for the data validation is 18. This means that 18 samples from the validation dataset have errors, which fall within such a range. The error range is, therefore, calculated thus;
The range of error is negligible, thus, indicating that there is a high degree of agreement between the targets and the neural network outputs (Daniyan et al., Citation2020). This also signifies there is a high probability that the neural network can classify the potential fraud red flags correctly as fraudulent and non-fraudulent activities.
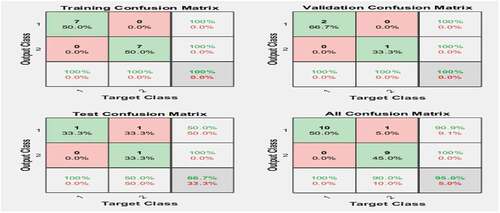
Figure shows the confusion matrix, which measures how well the neural network has fit the dataset. The percentages of correct and incorrect classifications are shown in the confusion matrix. Correct classifications are depicted with the green squares on the matrix diagonal, while the red squares represent the incorrect classifications. The confusion matrix indicates that for the training and validation processes, there are 100% correct classifications. For the testing process, there are 66.7% correct classifications, while 33.3% are misclassified. For the overall confusion matrix, 50% of the activities are correctly classified as fraudulent cases, while 45% are correctly classified as normal (non-fraudulent activities). Thus, 95% of the classifications are correct, while only 5% of the activities are misclassified. The few misclassifications indicate the accuracy of the developed network in classifying fraudulent and non-fraudulent activities.
Figure 7. The confusion matrix.
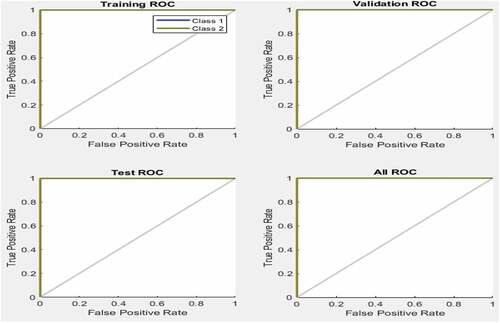
The receiver operating characteristic plot (Figure ) is another measure of how well the neural network fits the dataset. Class 1 shows the fraudulent activities, while class 2 indicates the normal activities (non-fraudulent activities). Figure also shows how the false positive and true positive rates relate to the threshold of the outputs that is varied from 0 to 1. The farther left and up the line is, the fewer the number of the false positives. The best classifiers have a line going from the bottom left corner to the top-right corner, as shown in Figure . The confusion matrix classifies its output as “True positive” when the model classifies the output correctly as positive. In other words, when there is agreement between the prediction from the neural network model and the actual situation that the activities are not fraudulent. “True negative” stands for a situation whereby the model classifies the output correctly as negative. In other words, when the prediction from the neural network agrees with the actual situation that the activities are fraudulent. “False positive” is a situation whereby the model predicts that there are fraudulent activities, whereas in the actual situation there are no fraudulent activities. Finally, “False negative” is a situation whereby the model prediction states that there are no fraudulent activities, whereas in the actual condition, there are fraudulent activities.
Figure 8. The receiver operating characteristics.
The results obtained for the classification analysis demonstrated the feasibility of the developed neural network model in classifying internal fraud into two types, fraudulent and non-fraudulent activities. This is evidenced in the negligible percentages of misclassification (5%) and correctly classified activities (95%) obtained from the confusion matrix.
4.2. Results obtained for the clustering analysis
Figure presents the SOM topology comprising 100 neurons positioned in a 10 × 10 decagonal grid. Each neuron has learned to represent the different fraud attributes, with adjacent neurons typically representing their similar classes. This implies that the pattern of the fraud attributes can be recognised by the neural network architecture and a forensic accountant can be notified in real time once such a pattern is detected. Likewise, Figure presents the SOM host which calculates the classes for each fraud attributes. It shows the number of fraudulent cases in each class. The areas of neurons with large numbers of hits represent the classes having similar highly populated regions of the feature space. The areas with few hits indicate sparsely populated regions of the feature space. Figures assist to understand the internal fraud red flags with the same or similar attributes. Internal fraud red flags with the same cluster have the same or similar attributes. This implies that there exists a relationship between the fraud red flags; hence, the clustering will enable proper understanding of the existing relationship and how to tackle it. For instance, when a forensic accountant identifies a fraud cluster, it implies that all the potential red flags in the cluster may lead to a fraud case and as such must be investigated.
Figure 9. The SOM topography.
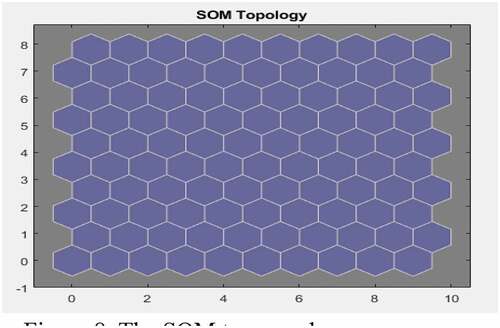
Figure 10. The SOM hits.
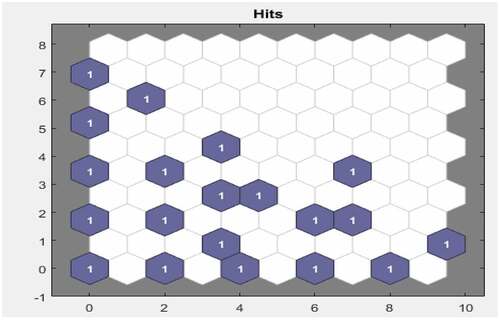
Figure shows the distance between a neuron’s class from its neighbours. The areas marked with bright connections indicate the highly connected areas of the input space. On the other hand, the areas marked with dark connections indicate the classes that represent the regions of the feature space, which are distant apart. For instance, the bright connections in the figure may indicate the presence of possible connections among the fraud attributes. For instance, it may indicate the presence of unapproved transactions thus indicating potential fraud. The areas marked with dark connections, which are distant apart, may thus indicate the absence of connections among the attributes, indicating the absence of fraud. The long borders of dark connections that separate the large regions of the input space show that the classes on either side of the border depict fraudulent activities with different features. Figure shows the neuron neighbour connections, which are typically used to classify similar samples. This figure indicates the suitability of the unsupervised machine learning approach to detect hidden patterns that may not be visible or detected by manual or other examination techniques.
Figure 11. SOM neighbour weight distance.
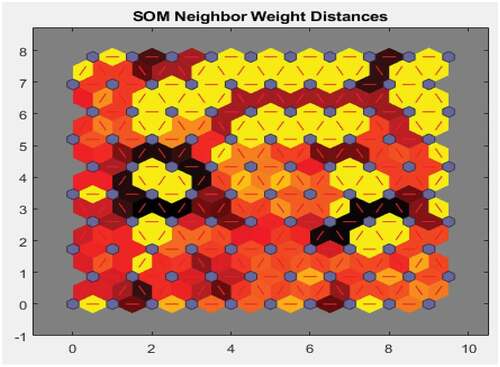
Figure 12. SOM neighbour connections.
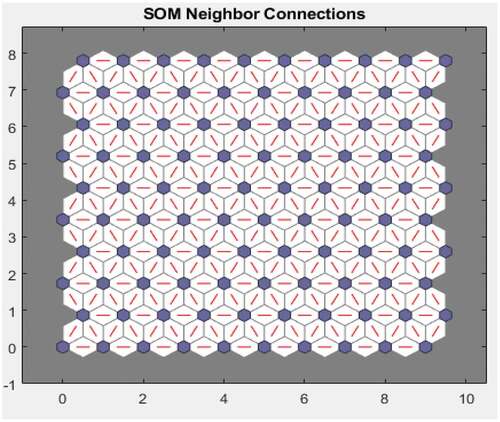
Figure presents the SOM weight positions. It can be seen from the figure that the weights cover all parts of the data. Thus, whenever new data is fed as an input, it can easily be assigned to the exact cluster. The position of the data points implies a good representation of the dataset.
Figure 13. The SOM weight positions.

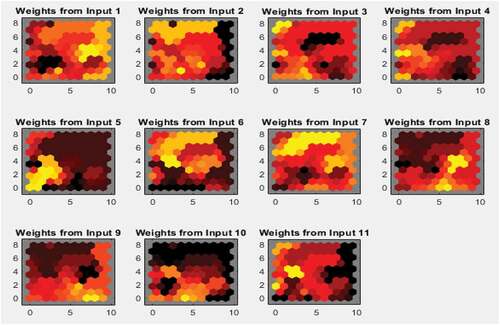
Figure shows the weight plane for each of the 11 input attributes. The figure displays the weights that connect each input to each of the 100 neurons in the 10 × 10 decagonal grid. The area with dark patches depicts larger weights. The correlation between the inputs is signalled by the presence of similar weight planes.
Figure 14. The weights of the eleven potential red flags.
5. Conclusion and policy implications
The aim of this study was to investigate the integration of forensic accounting and big data technology frameworks in relation to the mitigation of internal fraud risk in the banking industry. This was achieved with the aid of explanatory research design involving the use of simulated data to mirror the situation in the banking industry. This study contributes to knowledge with the development of a framework for the integration of forensic accounting and big data technology for fraud mitigation. It provides an understanding into the attributes of internal fraud and a practical guided approach to implement an integrated forensic accounting and big data technology framework for internal fraud mitigation.
Furthermore, neural network analysis involving classification and clustering analyses was performed in the MATLAB 2020b environment. From the literature survey, 11 potential red flags for internal fraud in the banking industry were identified. This was followed by the allocation of scores to the identified internal fraud indicators. The results obtained demonstrate the feasibility of classifying internal fraud into three levels of risks and fraud detection. This is evidenced in the percentages of correctly classified activities (95%) and misclassification (5%) obtained from the confusion matrix. In addition, the clustering analysis shows the link among the potential red flags for internal fraud. The understanding of the relationship among the potential red flags may be necessary for making effective decisions regarding the mitigation of internal fraud.
Big data technology is an innovative way a forensic accountant can employ to detect or prevent trends, suspicious transactions or activities. It is so efficient that it can detect and analyse the slight differences in transactions, and flag them as potential fraud activities.
Hence, the banking institutions are encouraged to adjust their business model to incorporate this developed integrated forensic accounting and big data technology framework for mitigating internal fraud to promote customers’ satisfaction, and reputation while minimising internal fraud-related cases. The integration of big data and machine learning into forensic analytics for fraud mitigation is a promising process that requires further research. It could, therefore, use of added value and credibility to the forensic accounting profession, education and research geared towards fraud mitigation. With the integration of big data technology and machine learning into the forensic accounting framework, there may be a need for the establishment of standard guidelines and procedures for its implementation. Furthermore, there may also be a need for human capacity development through trainings to upskill forensic accountants in this regard. As demonstrated in this study, at the data analysis phase of forensic accounting implementation, machine learning approach can be used to classify and detect fraud-related cases by using neural network algorithms that can solve classification, pattern recognition and clustering problems. For the classification problem, activities can be classified as fraudulent or non-fraudulent activities once the historical data relating to the activities are adequately trained in the network. On the other hand, once the forensic accountant has the clustering machine learning model, it has to be constantly updated by feeding in new data and automatically, new fraud pattern will be detected. This study is limited to the use of simulated data to demonstrate the classification and clustering capacities of the machine learning algortithms under the supervised and unsupervised learning environments. Hence, future works can consider the validation of the developed machine learning models with actual datasets.
Disclosure Statement
No potential conflict of interest was reported by the author(s).
Additional information
Funding
References
- Agarwal, S. (2022). Understanding misappropriation of assets at workplace. https://thedailyguardian.com/understanding-misappropriation-of-assets-at-workplaces/ [Accessed 5th August, 2022]
- Akhidime, A. E., & Uagbale-Ekatah, R. E. (2014). The growing relevance of forensic accounting as a tool for combating fraud and corruption: Nigeria experience. Research Journal of Finance and Accounting, 5(2), 71–22.
- Akinbowale, O. E., Klingelhöfer, H. E., & Zerihun, M. F. (2020a). Analysis of cyber-crime effects on the banking industry using balance score card: A survey of literature. Journal of Financial Crime, 27(3), 945–958. https://doi.org/10.1108/JFC-03-2020-0037
- Akinbowale, O. E., Klingelhöfer, H. E., & Zerihun, M. F. (2020b). An innovative approach in combating economic crime using forensic accounting techniques. Journal of Financial Crime, 27(4), 1253–1271. https://doi.org/10.1108/JFC-04-2020-0053
- Akinbowale, O. E., Klingelhöfer, H. E., & Zerihun, M. F. (2021). The integration of forensic accounting and the management control system as tools for combating cyberfraud. Academy of Accounting and Financial Studies Journal, 25(2), 1–14.
- American Institute of Certified Public Accountants (AICPA). (2002). Statement of auditing standards 99 consideration of fraud in a financial statement audit. American Institute of Certified Public Accountants, US.
- Arnaboldi, M., Busco, C., & Cuganesan, S. (2017). Accounting, accountability, social media and big data: Revolution or hype? Accounting, Auditing & Accountability Journal, 30(4), 762–776. https://doi.org/10.1108/AAAJ-03-2017-2880
- Association of Certified Fraud Examiners (ACFE). (2012). “Report to the nation on occupational fraud and abuse 2012 global fraud study”.
- Baader, G., & Krcmar, H. (2018). Reducing false positives in fraud detection: Combining the red flag approach with process mining. International Journal of Accounting Information Systems, 31, 1–16. https://doi.org/10.1016/j.accinf.2018.03.004
- Balios, D., Kotsilaras, P., Eriotis, N., & Vasiliou, D. (2020). Big data, data analytics and external auditing. Journal of Modern Accounting and Auditing, 16(5), 211–219. https://doi.org/10.17265/1548-6583/2020.05.002
- Bassey, B. E., & Ahonkhai, O. E. (2017). Effect of forensic accounting and litigation support on fraud detection of banks in Nigeria. Journal of Business and Management, 19(6), 56–60. https://doi.org/10.9790/5933-0904017989
- Bhasin, M. L. (2011). Corporate governance disclosure practices in India: An empirical study. International Journal of Contemporary Business Studies, 2(4), 34–57.
- Bhasin, M. L. (2015). An empirical study of frauds in the banks. European Journal of Business and Social Sciences, 4(7), 1–12.
- Bhasin, M. L. (2016). The role of technology in combating bank frauds: Perspectives and prospects. EcoForum, 2(9), 200–212.
- Cao, M., Chychyla, R., & Stewart, T. (2015). Big data analytics in financial statement audits. Accounting Horizons, 29(2), 423–429. https://doi.org/10.2308/acch-51068
- Chartered Institute of Management Accountants, CIMA. (2008). Fraud risk management a guide to good practice. pp. 1–82. https://www.cimaglobal.com/Documents/ImportedDocuments/cid_techguide_fraud_risk_management_feb09.pdf.pdf. [Accessed: 22nd July, 2022]
- Chiu, T., Wang, Y., & Vasarhelyi, M. A. (2020). The automation of financial statement fraud detection: A framework using process mining. Journal of Forensic and Investigative Accounting, 12(1), 86–108.
- Clayton, M. M. (2011). Investigative techniques. In A guide to forensic accounting investigation, (Second). Edited by T. W. Golden, S. L. Skalak, M. M. Clayton, & J. S. Pill. John Wiley & Sons. Inc., US. 271–281.
- Cressey, D. R. (1973). Other People's Money; a Study in the Social Psychology of Embezzlement.
- Cusack, B., & Ahokov, T. (2016). Improving forensic software tool performance in detecting fraud for financial statements. In C. Valli (Ed.). The Proceedings of 14th Australian Digital Forensics Conference, 5-6 December 2016, Edith Cowan University, Perth, Australia, pp. 17–24.
- Dagilienė, L., & Klovienė, L. (2019). Motivation to use big data and big data analytics in external auditing. Managerial Auditing Journal, 34(7), 750–782. https://doi.org/10.1108/MAJ-01-2018-1773
- Daniyan, I. A., Tlhabadira, I., Mpofu, K., & Adeodu, A. O. (2020). Development of numerical models for the prediction of temperature and surface roughness during the machining operation of Titanium alloy (Ti6Al4V). Acta Polytechnica Journal, 60(5), 369–390. https://doi.org/10.14311/AP.2020.60.0369
- Decker, D., Blanc, A., Loveland, J., & Clayton, M. (2011). Data mining analysis of structured and unstructured information. In T. W. Golden, S. L. Skalak, M. M. Clayton, & J. S. Pill (Eds.), A guide to forensic accounting investigation (Second Edition) ed., pp. 333–362). PricewaterhouseCoopers.
- de Dott, R. M. (2020). The use of big data analytics and artificial intelligence tools to prevent fraud in the audit field: A conceptual frame. Rivista Italiana Di Ragioneria E Di Economia Aziendale, 380–389.
- Efiong, E. J. (2012). Forensic accounting education: An exploration of level of awareness in developing economies-Nigeria as a case study. International Journal of Business and Management, 7(4), 26–34. https://doi.org/10.5539/ijbm.v7n4p26
- Enofe, A. O., Abilogun, T. O., Omoolorun, A. J., & Elaiho, E. M. (2017). Bank Fraud and Preventive Measures in Nigeria: An Empirical Review. International Journal of Academic Research in Business and Social Sciences, 7(7), 40–51. https://doi.org/10.6007/IJARBSS/v7-i7/3076
- Ezejiofor, R. A., Nwakoby, N. P., & Okoye, J. F. N. (2016). Impact of forensic accounting on combating fraud in Nigerian banking industry. International Journal of Academic Research in Management and Business, 1(1), 1–19.
- Gerson, J. S., Brolly, J. P., & Skalak, S. I. (2011). The role of auditor and forensic accounting investigator. In T. W. Golden, S. L. Skalak, M. M. Clayton, & J. S. Pill (Eds.), A guide to forensic accounting investigation (Second Edition) ed., pp. 37–61). PricewaterhouseCoopers.
- Hamdan, M. W. (2018). The role of forensic accounting in discovering financial fraud. International Journal Accounting Research, 6(2), 1–6. https://doi.org/10.35248/2472114X.18.6.176
- Hamilton, D., & Justin, M. O. G. (2012). Dimensions of Fraud in Nigeria Quoted Firms. American Journal of Social Science, 3(3), 112–120. https://doi.org/10.5251/ajsms.2012.3.3.112.120
- Hinde, S. (2003). Computer security: Mapping the future. Computers and Security, 22(8), 664–669. https://doi.org/10.1016/S0167-4048(03)00003-8
- Huber, W. (2017). Forensic accounting, fraud theory, and the end of the fraud triangle. Journal of Theoretical Accounting Research, 12(2), 28–48. https://ssrn.com/abstract=2423809
- Idolor, E. J. (2010). Bank frauds in Nigeria: Underlying causes, effects and possible remedies. African Journal of Accounting, Economics, Finance and Banking Research, 6(6), 62–80.
- Institute of Internal Auditors. (2009). International professional practices framework, practice guide: Internal auditing and fraud. pp. 1–42. https://www.academia.edu/36393289/IPPF_Practice_Guide_Internal_audItInG_and_Fraud [Accessed: 25th March, 2021]
- Jans, M., Alles, M., & Vasarhelyi, M. (2011). Process mining of event logs in internal auditing: A case study. In The 2nd International Symposium on Accounting Information Systems, Italy.
- Kenyon, W., & Tilton, P. D. (2011). Potential red flags and fraud detection techniques. In T. W. Golden, S. L. Skalak, M. M. Clayton, & J. S. Pill (Eds.), A guide to forensic accounting investigation (Second Edition) ed., pp. 231–269). John Wiley & Sons. Inc., US.
- Klein, R. (2015). How to avoid or minimize fraud exposures. The CPA Journal, 6–11.
- Kramer, B., Seda, M., & Bobashev, G. (2017). Current opinions on forensic accounting education. Accounting Research Journal, 30(3), 249–264. https://doi.org/10.1108/ARJ-06-2015-0082
- Kranacher, M. J., & Riley, R. (2019). Forensic accounting and fraud examination. John Wiley & Sons.
- Kumar, V., & Sriganga, B. K. (2014). A review on data mining techniques to detect insider fraud in banks. International Journal of Advanced Research in Computer Science and Software Engineering, 4(12), 370–380.
- Liodorova, J., & Fursova, V. (2018). Forensic accounting in the world: Past and present. Journal of Economics and Management Research, 7, 84–99. https://doi.org/10.22364/jemr.7.06
- Liu, H., & Cocea, M. (2015). Rule based systems for big data: A machine learning approach. Studies in Big Data 13, Springer.
- Lombardi, R., de Villiers, C., Moscariello, N., & Pizzo, M. (2021). The disruption of blockchain in auditing–A systematic literature review and an agenda for future research. Accounting, Auditing & Accountability Journal, 35(7), 1534–1565. https://doi.org/10.1108/AAAJ-10-2020-4992
- Mckinsey Global Institute. (2011). Big data: The next frontier for innovation, competition, and productivity. https://www.mckinsey.com/capabilities/mckinsey-digital/our-insights/big-data-the-next-frontier-for-innovation [Accessed 6th December, 2022]
- Miller, F. R., & Martson, D. L. (2011). Building a case: Gathering and documenting evidence: In a guide to forensic accounting investigation (Second Edition). T. W. Golden, S. L. Skalak, M. M. Clayton, & J. S. Pill. PricewaterhouseCoopers:. pp. 175–189.
- Mittal, P., Kaur, A., & Gupta, P. K. (2021). The mediating role of big data to influence practitioners to use forensic accounting for fraud detection. European Journal of Business Science and Technology, 7(1), 47–58. https://doi.org/10.11118/ejobsat.2021.009
- Modugu, K. P., & Anyaduba, J. O. (2013). Forensic Accounting and Financial Fraud in Nigeria: An Empirical Approach. International Journal of Business and Social Science, 4(7), 281–289.
- Modugu, K. P., & Anyaduba, J. O. (2013). Forensic accounting and financial fraud in Nigeria: An empirical approach. International Journal of Business and Social Science, 4(7), 281–289.
- Moffitt, K. C., & Vasarhelyi, M. A. (2013). AIS in an age of big data. Journal of Information Systems, 27(2), 1–19. https://doi.org/10.2308/isys-10372
- Ngai, E. W. T., Hu, Y., Wong, Y. H., Chen, Y., & Sun, X. (2011). The application of data mining techniques in financial fraud detection: A classification framework and an academic review of literature. Decision Support Systems, 50(3), 559–569. https://doi.org/10.1016/j.dss.2010.08.006
- Nigrini, M. J. (2011). Forensic analytics: Methods and techniques for forensic accounting investigation (2nd) ed. John Wiley and Sons.
- Onodi, B. E. O., I., E., & Egbunike, P. A. (2017). Application of Fraud Box-Key Model in the Determination of Fraud Risk Factors: Evidence from Banks in Nigeria. Journal of Global Accounting, 5(1), 99–112.
- Ozili, P. K. (2015). Forensic accounting and fraud: A review of literature and policy implications. International Journal of Accounting and Economics Studies, 3(1), 63–68. https://doi.org/10.14419/ijaes.v3i1.4541
- Ozili, P. K. (2018). Advances and issues in fraud research: A commentary. https://mpra.ub.uni-muenchen.de/84879/ MPRA Paper No. 84879, pp. 1–12. [Accessed: 17th August 2019].
- Perduv, V., Ceklic, J., & Ceklic, B. (2018). The role of forensic accounting in corporate governance for economic studies. Poslovne Studije, Business Studies, 10(19–20), 119–131. https://doi.org/10.7251/POS18119V
- Pizzi, S., Venturelli, A., Variale, M., & Macario, G. P. (2021). Assessing the impacts of digital transformation on internal auditing: A bibliometric analysis. Technology in Society, 67, 101738. https://doi.org/10.1016/j.techsoc.2021.101738
- Raghavan, P., & Gayar, N. E. 2019. Fraud Detection using Machine Learning and Deep Learning 2019 International Conference on Computational Intelligence and Knowledge Economy, Dubai, United Arab Emirates, https://doi.org/10.1109/ICCIKE47802.2019.9004231
- Rahmawati, D., Sarno, R., Fatichah, C., & Sunaryono, D. (2017). Fraud detection on event log of bank financial credit business process using Hidden Markov model algorithm. Proceedings 2017 3rd International Conference on Science in Information Technology, IEEE, pp. 35–40.
- Rahmawati, D., Yaqin, M. A., & Sarno, R. (2016). Fraud detection on event logs of goods and services procurement business process using Heuristics miner algorithm. Proceedings of 2016 International Conference on Information & Communication Technology and Systems, IEEE, pp. 249–254.
- Ramamoorti, S., Morrison, D., & Koletar, J. W. (2014). Bringing Freud to fraud. Journal of Forensic & Investigative Accounting, 6(1), 47–81.
- Rezaee, Z. (2005). Causes, consequences, and deterrence of financial statement fraud. Critical Perspectives on Accounting, 16(3), 277–298. https://doi.org/10.1016/S1045-2354(03)00072-8
- Rezaee, Z., Lo, D., H. A., M., & Suen, A. (2016). Forensic accounting education and practice: Insights from China. Journal of Forensic & Investigative Accounting, 8(1), 106–119.
- Seda, M. A., Peterson, K. B., & Crumbley, D. L. (2019). An examination of computer forensics and related certifications in the accounting curriculum. Journal of Digital Forensics, Security and Law, 14(1), Article 4, 1–24. https://doi.org/10.15394/jdfsl.2019.1578
- Serhii, K., Vadym, P., Oleg, K., Oleksandr, M., & Strilets, O. (2019). Forensic economic examination as a means of investigation and counteraction of economic crimes in East Europe (Example of Ukraine). Journal of Legal, Ethical and Regulatory Issues, 22(3), 1–8. https://doi.org/10.1544/-0044-22-3-332
- Shimoli, D. (2015). Forensic accounting: Signaling practicing accountants to improve skillset and forming regulatory body for forensic accountants in India. Global Journal for Research Analysis, 4(5), 63–66.
- Srivastava, S., & Bhatnagar, R. (2021). Process mining techniques for detecting fraud in banks: A study. Turkish Journal of Computer and Mathematics Education, 12(12), 3358–3375.
- Tang, J., & Karim, K. E. (2019). Financial fraud detection and big data analytics–Implications on auditors’ use of fraud brainstorming session. Managerial Auditing Journal, 34(3), 324–337. https://doi.org/10.1108/MAJ-01-2018-1767
- Vasarhelyi, M. A., Kogan, A., & Tuttle, B. M. (2015). Big data in accounting: An overview. Accounting Horizons, 29(2), 381–396. https://doi.org/10.2308/acch-51071
- Venegas, J. C. (2012). Fiscal Accounts. pp. 1–86.
- Warren, J. D., Jr, Moffitt, K. C., & Byrnes, P. (2015). How big data will change accounting. Accounting Horizons, 29(2), 397–407. https://doi.org/10.2308/acch-51069
- Werner, M. (2016). Process model representation layers for financial audits. In: 49th Hawaii International Conference on System Sciences 2016, US. IEEE, pp. 5338–5347.
- Wolfe, D. T., & Hermanson, D. R. (2004). The Fraud Diamond: Considering the Four Elements of Fraud. The CPA Journal, 74(12), 38–42.
- Yoon, K., Hoogduin, L., & Zhang, L. (2015). Big data as complementary audit evidence. Accounting Horizons, 29(2), 431–438. https://doi.org/10.2308/acch-51076
- Zhang, J., Yang, X., & Appelbaum, D. (2015). Toward effective big data analysis in continuous auditing. Accounting Horizons, 29(2), 469–476. https://doi.org/10.2308/acch-51070