
 ?Mathematical formulae have been encoded as MathML and are displayed in this HTML version using MathJax in order to improve their display. Uncheck the box to turn MathJax off. This feature requires Javascript. Click on a formula to zoom.
Abstract
ASEAN nations started ASEAN Economic Community (AEC) initiatives, with the goal of improving the economic movement in ASEAN. The initiative is expected to lead to higher integration in the regions. The objective of this research was to study the integration of equity markets in the ASEAN-5 nations (Indonesia, Malaysia, Singapore, Thailand, and the Philippines), particularly those involving the Indonesian stock market (Indonesia’s economy is the largest in the region), and to analyze the diversification opportunities among ASEAN equity exchanges. Theoretically, capital markets in these nations should be more integrated following the introduction of AEC due to the integration of their economy and removal of several investment restrictions, including foreign ownership limitation. The data used was weekly data was used from January 2000 to June 2019, which was divided into four periods: pre-crisis, crisis, post-crisis and AEC. The methods used were DCC-GARCH, AG-DCC, volatility spillovers, Granger causality and diversification ratio from the mean-variance framework. The results showed robust evidence that there were still less integrated equity markets in ASEAN-5. The volatility spillover declined during the post-crisis period and was relatively stable during the AEC period. This result implies that ASEAN-5 initiatives have an impact on the capital markets. However, the implementation of the AEC is still far from successful since the equity exchanges have become less integrated than in the post-crisis period. Investors in Malaysia, Singapore, and the Philippines are encouraged to avoid investing heavily in Indonesia and Thailand equities during market turmoil since both are net contributors to volatility.
1. Introduction
Equity market liberalization improved capital inflows, and advancement in technology has supported investors to invest internationally (Batten & Kearney, Citation2006; Buğan et al., Citation2022; Cevik et al., Citation2022; Kearney & Lucey, Citation2004). These conditions may have increased the relationship between stock markets in different countries. Referring to modern portfolio theory, investors should aim to diversify their portfolio of assets to gain a good risk-return relationship (Nugroho et al., Citation2018). Investors may gain some benefit if the portfolio consists of assets with low correlation or no correlation (Mangram, Citation2013; Markowitz, Citation1952; Robiyanto et al., Citation2020).
In relation to the cross-country portfolio, this suggests that investors should consider including other countries’ equities in their portfolio (Karim & Rahman, Citation2020; Macedo et al., Citation1984; Thomas et al., Citation2017). However, long-run co-movements between different equity markets may reduce portfolio diversification internationally. Therefore, research on segmented markets that can offer diversification advantages to international investors is needed.
Since 2015, ASEAN nations have cooperated to improve economic movement with the AEC. The primary goal of AEC is to strengthen the financial markets of its nations. The creation of free trade pacts and regional integration initiatives are some of the important issues (Gugler & Vanoli, Citation2017). Other goals of AEC includethe developing the financial industry and integrating ASEAN’s financial markets (Jarungkitkul & Sukcharoensin, Citation2016). Moreover, the integration of equity markets has been marked by the liberalization of markets, such as the increased cross-border capital flows into ASEAN. The AEC initiative is faithfully to make ASEAN a free region for the movement of goods or services, proficient labor, and funds. It is expected that integration of equity markets will help improve capital flows and reduce financial uncertainty (Caporale et al., Citation2022; Robiyanto et al., Citation2016).
Research on equity markets integration using Asian exchanges as the subject, particularly involving the Indonesia Stock Exchange, have been conducted previously with fairly inconclusive results fairly inconclusive results. For example, Suryanta (Citation2011) stated that the Indonesian capital market was not integrated with Malaysia, Singapore, Thailand, and the Philippines. Meanwhile, Robiyanto (Citation2018), who used DCC-GARCH (Dynamic Conditional Correlation-Generalized Autoregressive Conditional Heteroscedasticity) method, indicated that the Philippines’ market was segmented and the level of integration was improving from pre-crisis to post-crisis era. In addition, Robiyanto (Citation2017), using the OGARCH (Orthogonal Generalized Autoregressive Conditional Heteroscedasticity) method, revealed that the Indonesian equity market was integrated with ASEAN exchanges, except for the Philippines. Lasly, Thomas et al. (Citation2017) suggested that China, Thailand, Sri Lanka, and Pakistan markets were not integrated with other equity markets in the Asia-Pacific.
The primary aim of this research was to investigate the integration of equity markets in the ASEAN-5 nations, particularly involving the Indonesian stock market and the inclusion of the AEC initiative program. Indonesia is the largest economy in Southeast Asia (https://www.worldbank.org/en/country/indonesia/overview), meaning that it has significant effect on other equity markets in the region; however, many international portfolio managers are still not interested to invest in Indonesia as an emerging market.
It is expected that when the financial markets are more integrated, there will be less diversification benefit from cross-border investment. This study also employs dynamic approachto gain better insight regarding the issue studied. This study will benefit policy makers, since it will help measure the effectiveness of AEC, especially on financial market integration. It will also be helpful for international portfolio manager to strategize their portfolios and for scholars.
The result of this study will fill the gaps in the current literature in some ways. First, separating the AEC period was important since it helped to measure whether the AEC implementation, which is strongly supported by ASEAN-5 countries, was efficient. Second, this study employed DCC-GARCH and AG-DCC (Asymmetric Generalized-Dynamic Conditional Correlation) which was rarely used in previous studies on capital market integration in ASEAN (Arsyad, Citation2015; Batten et al., Citation2019; Gugler & Vanoli, Citation2017; Jarungkitkul & Sukcharoensin, Citation2016; Karim & Ning, Citation2013; Karim & Rahman, Citation2020; Majid et al., Citation2008; Suryanta, Citation2011; Thomas et al., Citation2017). The dynamic approach was applied since equity markets are always changing. Third, some previous studies, such as Robiyanto’s (Citation2018), used monthly data, while this study implemented weekly data. Fourth, this study also measured the volatility spillovers using other methods since DCC-GARCH and AG-DCC were not suitable for measuring spillovers. In other words, the modeling under a special variance structure wasn’t suited to gauge the extent of spillovers and the direction of spillovers (Kang et al., Citation2017). Therefore, to tackle the limitations of DCC-GARCH and AG-DCC, Diebold and Yilmaz (Citation2009) used a method based on forecast error variance decompositions in VAR to measure the extent of spillover transfer among capital markets.
2. Review of literature and hypothesis development
In general, the financial market is where the exchange of financial assets occurs and prices are set. In other words, the capital market is the place, either physical or virtual, where people are searching for additional funds or placing their excess wealth. Lizarzaburu Bolaños et al. (Citation2015) stated that the financial market is the location where company’s interests are exchanged in terms of debt and equity investment. The main functions of the financial market are: (1) to connect sellers and buyers; (2) as an appropriate mechanism of asset pricing; (3) to supply liquidity to assets, and (4) to lessen the cost of intermediation. An efficient market is when buyers and sellers understand every supply and demand, and pricing is determined based on supply and demand without any outside intervention. In the past, the transactions were conducted on trading floors. Today, many markets are run electronically.
Previous studies show that the level of capital market integration has increased (Buğan et al., Citation2022; Caporale et al., Citation2022; Jarungkitkul & Sukcharoensin, Citation2016; Karim & Ning, Citation2013; Thomas et al., Citation2017). There are some possible reasons for this: (1) many investors are searching for higher returns and risk diversification; (2) many emerging nations are encouraging more capital inflow, minimizing restrictions and controls in terms of foreign investment; (3) governments choose to relax state regulations; (4) many emerging markets increase the quality of their financial ecosystem.
In addition, this paper also studied the conditional asymmetries of the capital markets using AG-DCC, beside DCC-GARCH which was used by Buğan (Citation2021). There are two theories regarding the subject; the leverage effect and volatility feedback (Cappiello et al., Citation2006). The leverage effect shows that when the stock price drops, the debt-to-equity ratio improves. Hence, there is an improvement in the volatility of the unleveraged part of a company (equity). Meanwhile, the volatility feedback states that when investors hear that volatility in the future is rising, they will sell the stocks at that moment. Therefore, the required return is expected to be higher due to the increased risk. In other words,theimprovement in expected return generates higher volatility (volatility feedback).
Financial equity markets can be considered as integrated if all investors have the same relevant environment. For instance, all investors have the same set of rules when dealing with financial instruments. Also, there is equal treatment in the market, and investors have equal access to the financial market (Oprea & Stoica, Citation2018). However, Robiyanto (Citation2018) argued, with respect to stock market integration, that many other factors should be considered. For example, geographical conditions (Mehmood et al., Citation2019), technological advancement, proficient labors, and political risks. Hence, there’s no guarantee that financially co-movement markets are also empirically integrated with equity markets across nations.
Arsyad (Citation2015), who studied equity market co-movements between East and Southeast Asia, concluded that stock market integration was incomplete. According to his study, random shocks from Singapore have a stronger influence on ASEAN exchanges than other Southeast Asian nations. Similarly, Jarungkitkul and Sukcharoensin (Citation2016) revealed that the Singapore stock exchange is the most competitive equity exchange in ASEAN. Moreover, the finding shows that the competitiveness of ASEAN equity markets is still not balanced.
Further, Karim and Karim (Citation2012) showed that the integration of ASEAN exchanges has increased during the pre and post-crisis. The result implied that investors that choose to diversify their investment across ASEAN markets could only earn limited diversification benefits. In other words, investors who expand their investment across ASEAN, cannot obtain long-term diversification benefits. In addition, Robiyanto (Citation2017), who studied ASEAN equity market integration using OGARCH, revealed that ASEAN investors should not diversify their portfolio between equity markets in Indonesia, Malaysia, Singapore, and Thailand since all of them are relatively integrated with each other. However, diversification benefits will be gained when the Philippines’ equity market is included, since the Philippines’ equity market is rather segmented. The segmented market has relatively limited capital inflows, and the equity exchanges of segmented market do not have a significance correlation with other markets. Therefore, segmented market can offer more diversification benefits.
Moreover, Thomas et al. (Citation2017) suggested that investors could gain diversification benefits by investing in China, Thailand, and Sri Lanka since those markets were segmented. In addition, the majority of emerging markets share a bidirectional connection with Australia. Hence, the result suggested that investors should be prudent in selecting a portfolio composed of developed, emerging and frontier nations to increase risk-return relationship. Mehmood et al. (Citation2019) also support this finding by concluding geographic diversification can support portfolio performance. Meanwhile, Chunhachinda et al. (Citation2018) showed the importance of emerging markets for minimizing risk of international portfolio. They concluded that combining portfolios consisting of emerging markets’ shares and commodities could help reduce risk better than combining developed market’ equities and commodities. In addition, Rahman et al. (Citation2017); Robiyanto and Ernayani (Citation2018), who used VAR and VECM, showed that equity markets in ASEAN a were integrated during the crisis. Nevertheless, during the post-crisis period, the integration between equity markets were highert compared to pre-crisis. Similarly, Karim and Ning (Citation2013) revealed that ASEAN-5 equity markets were integrated. Therefore, there should be limited opportunities to earn diversification benefits from international investment diversification in ASEAN.
Compared to previous studies, this study employed DCC-GARCH and AG-DCC which was rarely used in the previous studies on ASEAN capital market integration. The reason for the application of the dynamic approach is the constant changes in equity markets, making dynamic approach more suitable. The study also measured volatility spillovers.
Previous studies on equity market integration revealed that the more integrated the markets, the fewer diversification benefits that can be gained. Hence, the hypothesis for this research is as follows:
H1 The implementation of ASEAN Economic Community has increased the ASEAN capital market integration, therefore reducing diversification benefits, particularly for Indonesian investors
3. Methodology
3.1. Datasets
This research utilized time-series input. The stock exchanges researched were Straits Times (STI) (Singapore), SET (Thailand), KLSE Composite index (Malaysia), Manila Composite index (PSEI) (thePhilippines) and Indonesia Stock Exchange (JKSE) (Indonesia). In addition, the study utilized weekly closing price data from January 2000 to June 2019. The period was chosen because during the time period, foreign ownership limitation in the Indonesian market was revoked, and ASEAN was integrated.
In previous studies on equity market integration, many data were missing due to different equity market holidays. Following Majid et al. (Citation2009), without sophisticated interpolation, previous closing price was used to fill in the gaps. Although it is very simplistic, the previous study showed that there’s no new information on holidays.
Furthermore, the observations were divided into four periods, pre-crisis (Jan 2000 to June 2007), crisis (July 2007 to Dec 2008), post-crisis (Jan 2009-Dec 2014) and ASEAN Economic Community (Jan 2015—June 2019). The extensive division was in line with Karim and Ning (Citation2013). It is important to separate the AEC time period, since it will help measure whether the AEC implementation, strongly supported by ASEAN-5 countries, is efficient. Moreover, this data was obtained from Bloomberg. To calculate the stock market return, the following formula was used
Where
= Weekly price of an index
= Weekly price of an index at week—1
3.2. DCC-GARCH
This study used Engle’s DCC method (2002). The method measures the co-movement of financial markets using dynamic covariance matrix. Therefore, DCC-GARCH can get time-varying correlations across different asset returns.(see Appendix 1 for more details on DCC. Further, the researchers calculated the hedging effectiveness (HE) using the following formula (Chunhachinda et al., Citation2018; Ku et al., Citation2007; Robiyanto et al., Citation2017):
Where was the variance of the Indonesian-ASEAN portfolio and
was the variance of the Indonesian stock market.
3.3. Efficient frontier (diversification ratio)
Moreover, this study also employed a mean-variance perspective on calculating diversification benefits. The benefit was obtained when the standard deviation was minimized. Furthermore, the researchers followed Bastin (Citation2018) and utilized the mean-variance model to find the optimum weight (Markowitz, Citation1952). Despite the criticism of the model, it can still predict a better return than the market (Ivanova & Dospatliev, Citation2018). The main objective of this portfolio was minimizing risk or standard deviation. In addition, the researchers also used the diversification ratio or DV (Bastin, Citation2018). The optimum weights that maximize the diversification ratio (DV portfolio) could be found using Microsoft Excel Solver. The formula was as follows:
Where ω was the weight, was the standard deviation,
was the standard deviation of an index,
was the covariance between assets a and b. Also, the weight of Indonesian investors is at least 30 percent of the total portfolio weight. It was expected that the ratio would be higher than one.
The main difference between diversification ratio and hedging effectiveness is that when an international portfolio(for instance, Indonesia-Malaysia), has higher hedging effectiveness than diversification ratio, it indicates that adding Malaysian stocks into the Indonesian portfolio can reduce risk better, though it will also reduce return significantly. Conversely, when an international portfolio, for instance, Indonesia-Thailand, has a higher diversification ratio than hedging effectiveness, it indicates that adding Thailand stocks into the Indonesian portfolio won’t be as effective in reducing risks, though its impact on return will be less significant.
3.4. AG-DCC
This research also analyzed the asymmetric feedback to volatility shocks using the asymmetric generalized dynamic conditional correlation (AG-DCC) model from Cappiello et al. (Citation2006). The model is well-suited to dive into the correlation dynamics among different assets and analyze the availability of asymmetric feedback in conditional variances and correlation to non-positive returns.
Where A, B and G were kxk parameter matrices, was a kx1 indicator function that the value is 1 if the argument is true and 0 otherwise. In addition, “
” represented the Hadamard transform.
3.5. Volatility spillovers
This paper utilized the volatility spillovers developed by Diebold and Yilmaz (Citation2009, Citation2012) to measure volatility spillovers according to the forecast error variance decomposition in a generalized vector autoregressive method. This approach is well-known for measuring volatility spillovers in numerous capital markets (Xu et al., Citation2019). The realized volatility detail calculation is available in Appendix 2.
This study used weekly data to calculate the volatility spillovers. Since full sample data cannot expose the dynamic nature of volatility spillovers, this research follows (Xu et al., Citation2019) that the calculation of volatility spillovers indices shall be done using a 200-week rolling window, a VAR lag length of 5 and 10-day-ahead forecast errors horizon (H=10).
4. Empirical results
4.1. Descriptive statistics
Table reveals the descriptive statistics. It shows that during the period studied highest weekly return went to the Philippines’ market during the study. In addition, the highest average return went to Indonesia, but the country also had the highest capital market risk while Malaysia had the lowest. However, Malaysia also had the lowest average return. These results support Muharam et al. (Citation2019). Table also shows that ASEAN market returns are not normally distributed.
Table 1. Descriptive statistics
Additionally, Table reveals the results of stationary test. It shows that all data utilized in this research were stationary. The ADF at level test shows the Significance was at 1%. Hence, the data can be further processed to obtain DCC-GARCH. In addition, Table reveals that all stock markets studied had a significant positive correlation, showing that shows that the studied markets tend to have medium constant positive correlation.
Table 2. Correlation analysis
4.2. DCC-GARCH statistics
Table shows the results of the DCC-GARCH. It shows that the correlation between JKSE with several equity markets was dynamically changing. This finding was similar to Robiyanto (Citation2018). The results suggest that equity market integration is not perfect. The results show that the value between Indonesia and other stock markets had increased from pre-crisis (0.3953), crisis period (0.5722) and post-crisis (0.4906), indicating that the integration between JKSE and other markets had increased from the pre-crisis period through the end of 2014, as shown in Table . This supports the result of Robiyanto (Citation2018), which concluded that there was an increased connection between stock markets in ASEAN through the end of 2014. This result also is also in line with Karim and Karim (Citation2012), who stated that the integration of ASEAN stock markets in post-crisis was higher than in pre-crisis. One possible reason was that the financial market harmonization among ASEAN countries had increased after the crisis period. Therefore, it was found to be successful empirically. Furthermore, the results were also consistent with Rahman et al. (Citation2017) who proved that equity markets in the ASEAN area were integrated during the crisis. Also, their research showed that during the post-crisis period, the integration of equity markets improved compared to pre-crisis.
Table 3. DCC-GARCH results
However, unlike previous studies, this research added another time period; AEC. The average value of DCC-GARCH in the AEC timeframe was 0.4380, indicating a drop in value compared to the post-crisis era. The result suggested that AEC’s goal to transform ASEAN into a free trading zone is still far from reality. Therefore, the ASEAN equity markets have not been fully integrated, making them it.very vulnerable to crises. In addition, with the increased value of DCC-GARCH, it is highly possible that the diversification benefits will be higher than during the post-crisis period. In addition, Table shows the results from AG-DCC, which is very similar to Table . Based on the DCC-GARCH and AG-DCC analysis, H1 cannot be accepted.
Table 4. AG-DCC results
4.3. Mean differences in DCC-GARCH
Table shows the mean differences between DCC-GARCH. In general, the table reveals differences in the mean. It indicates that the correlation between JKSE with other ASEAN markets had dynamically changed over time. However, there was one noticeable result. The dynamic correlation between Indonesia and Thailand’s stock markets did not have a statistically different mean during the crisis and post-crisis period. Therefore, the result suggested that the integration process in Southeast Asia was not perfect. These results indicated that Indonesia, Singapore, the Philippines, and Malaysia might react similarly to market shocks, while Thailand might respond differently. This result supports Arsyad (Citation2015), who found that Thailand and Vietnam had different responses to external shocks compared to other ASEAN countries. The co-movement of economic development and relatively closer distance may be why Indonesia, Singapore, the Philippines, and Malaysia have a similar reaction to policy shock. Moreover, the results in Table also imply that the capital markets in ASEAN 5 are not fully integrated. Therefore, it is highly possible that investors may gain diversification benefits there. Based on the mean differences, H1 cannot be accepted.
Table 5. Mean differences in DCC-GARCH
4.4. Granger causality
Table reveals the results of the Granger test. It shows that the Indonesian capital market had a bidirectional relationship with the Philippines, Thailand, and Singapore’s. However, the Indonesian capital market only had a unidirectional relationship with the Malaysian market (Significance: 5%) suggesting that Indonesian equity market Granger-cause Malaysia stock market, but not the other way around. Overall results indicated that the Singapore stock market movement Granger-causes all ASEAN 5 capital markets. This finding is consistent with Jarungkitkul and Sukcharoensin (Citation2016) results. They found that STI is the most competitive capital market in the region. Singapore is the center of the ASEAN financial industry. With Singapore’s stock market infrastructure, 80 percent of the traders are from outside the nation. This result is in line with Arsyad (Citation2015), who found thatSingapore’s market is the most influential stock market in ASEAN. It is suggested that shocks from Singapore’s market will have greater effects on its neighbor compared to shocks from other ASEAN nations.
Table 6. Granger causality test
The test suggests that some of the capital markets in Southeast Asia are not related with each other, either bidirectional or unidirectional. This result is in line with previous studies that stated that the Philippines’ markethad limited relationship Malaysia and Singapore’s, which can cause unequal feedback to region-wide initiatives. The results also suggest that the integration process of capital markets in Southeast Asia is not complete yet. The ASEAN governments may take further actions to curb barriers hampering cross-countries capital inflows and, therefore, increase financial integration. Hence, based on Table , it is highly likely that diversification benefits do exist in ASEAN stock markets, especially for Indonesian investors. Based on Granger causality results, H1 cannot be accepted.
4.5. Hedging effectiveness and diversification ratio
Table reveals the hedging effectiveness and diversification ratio of ASEAN 5 countries. As previously shown in Table , the average values of DCC-GARCH went up from pre (0.3953) to post-crisis (0.4906), indicating that the diversification benefit for Indonesian investors from international investing became smaller. Table confirms this finding. Table shows that the diversification ratio dropped from pre-crisis (1.2234) to post-crisis (1.1240), suggesting that Indonesian investors had smaller diversification benefits when ASEAN 5 capital markets became more integrated.
Table 7. Hedging effectiveness and diversification ratio
In addition, the descriptive statistics in Table showed that the Malaysian stock market had the lowest standard deviation compared to other ASEAN markets, suggesting that Indonesian and other ASEAN investors might experience lower risk when investing in the Malaysian market. Table shows that Indonesian investors would benefit from market turbulence when having Malaysian stocks in their portfolio, as reflected by the fact that the hedging effectiveness of Indonesia—Malaysia was the highest compared to other markets in all periods of observation.
However, as shown in Table , the integration of ASEAN capital markets during AEC period was lower than during the post-crisis period. Table confirms the finding. It shows that the average diversification ratio has increased from post-crisis (1.1240) to the AEC period (1.1570), suggesting that Indonesian investors might receive more diversification benefits when investing internationally in ASEAN equity markets.
Overall, Table reveals that Indonesian investors could have more diversification benefits when having stocks from Thailand’s equity market in their portfolio. In addition, the increase in f the diversification ratio from post-crisis (1.1240) to the AEC period (1.1570) has confirmed the findings in Table . It shows that the capital markets in ASEAN 5 were not fully integrated even, after the introduction of AEC initiatives. In other words, the main goal of AECto improve trade in ASEAN is still far from reality. The results support the findings from Thomas et al. (Citation2017). Using Hansen’s cointegration, they found that China and Thailand are adequately segmented. Therefore, these nations offer more diversification benefits to global investors. Furthermore, the results from AG-DCC are similar to DCC-GARCH. The average hedging effectiveness has marginally increased from post-crisis (0.3630) to the AEC period (0.3657), suggesting that Indonesian investors may receive diversification benefits when investing in ASEAN. Based on Table results, H1 cannot be accepted.
Figure shows the time-varying correlation of the DCC-GARCH results. Based on several observations, the variability of portfolio turnover was lower in Indonesia—Philippines and Indonesia—Thailand portfolios. One possible reason for this was that Indonesia and Philippines exchanges had faced low investors’ participation (Jarungkitkul & Sukcharoensin, Citation2016). Further, corporate governance disclosure is considered low for these two nations. Meanwhile, Thailand is relatively farther from Indonesia compared to other markets. Hence, these two markets were not as integrated as the other markets. In other words, these two markets can likely lead to better diversification benefits for Indonesian investors that plan to expand their portfolio regionally. Furthermore, Figure shows the time-varying correlation of the AG-DCC results, which is very similar to Figure .
Figure 1. Time-varying correlation of DCC-GARCH—all sample.
Figure 2. Time-varying correlation of AG-DCC—all sample.
4.6. Volatility spillovers
Figure shows the volatility spillover index. The index shows a spike in volatility during the crisis period (2007–2008), implying that the interdependence between ASEAN stock markets went up. Also, it should be noted that the spillover plots never declined to the pre-crisis value, showing that there was capital market integration at some level. Furthermore, the volatility spillover dropped during the post-crisis period and relatively stable during the AEC period. This implies that economic and political activities in the region have an impact on the ASEAN-5 capital markets. Moreover, Table shows that Indonesia and Thailand are the net contributors to volatility in ASEAN-5 capital markets. Meanwhile, Malaysia, Singapore and the Philippines are the net recipients. Indonesia is the largest contributor to volatility in regional markets, possibly because Indonesia is the most populous nation in the region with an enormous market share. This result is consistent with our previous calculation (Table ) that portfolios consisting of Indonesia and Thailand stocks have lower hedging effectiveness during the crisis since both nations are net contributors TO volatility in the region.
Figure 3. Volatility Spillovers.
Table 8. Spillover Connectedness
4.7. Robustness test (Efficient frontier)
Figure reveals the efficient frontiers of the international portfolio based on the weekly data from January 2000 to June 2019. Based on the values of DCC-GARCH and AG-DCC (Table ) and the diversification ratio (Table ), it is expected that Thailand stocks are likely to offer more diversification benefits compared to other ASEAN markets. Figure confirms the finding from the previous table. Figure is based on the Markowitz mean-variance process, with the proportion of Indonesian stocks being 70% of the total portfolio.
Figure 4. Efficient Frontier.
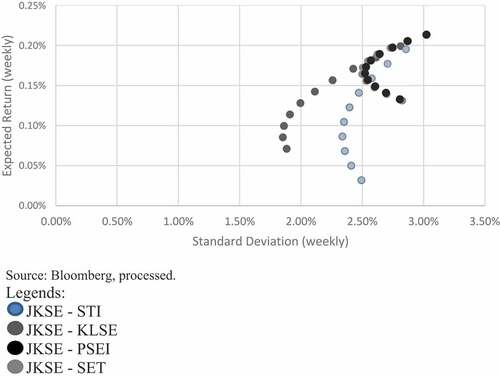
The figure shows that Thailand has a better risk-return relationship for Indonesian investors searching for international diversification. When having Thailand stocks in the portfolio, Indonesian investors are expected to have 0.189 percent of return and 2.62 percent of standard deviation weekly. Meanwhile, Indonesian investors are expected to have 0.189 percent of return and 2.64 percent of standard deviation weekly from the Philippines stocks. Overall, an international portfolio, for instance, Indonesia-Malaysia, has higher hedging effectiveness, indicating that adding Malaysian stocks into the Indonesian portfolio can help reduce risk better, though it may also reduce return significantly as shown in Figure . Conversely, when an international portfolio, for instance, Indonesia-Thailand, has a higher diversification ratio, indicating that adding Thailand stocks into the Indonesian portfolio won’t be as effective in reducing risks, though its impact on return will be less significant.
Figure shows that JKSE—STI portfolio tend to produce higher standard deviation (risk) and lower expected return compared to other portfolios. JKSE—KLSE portfolio could produce the lowest risk with a slightly similar expected return to JKSE—STI. JKSE—PSEI and JKSE—SET portfolios could produce higher expected returns compared to JKSE—STI and JKSE—KLSE portfolios, with higher risk. JKSE—SET produces the lowest risk compared to other portfolios with a slightly similar expected return to JKSE—PSEI portfolio.
5. Conclusion
The primary aim of this study was to study the integration of equity markets in the ASEAN-5 nations, particularly involving the Indonesian stock market and the inclusion of the AEC initiative program started in 2015. This study used some dynamic approaches such as DCC-GARCH, AG-DCC and volatility spillovers. This study found that the connection between the Indonesian stock market with its neighbors was always changing over time. It showed that the correlation tended to grow from the pre-crisis period and post-crisis period. In conjunction with previous research, this study found that the level of equity market integration in ASEAN went up after the sub-prime mortgage crisis in 2008. Therefore, with the increased level of stock market integration, the diversification benefit was also smaller during that period. Further, the spillover plots never decline to the pre-crisis value, indicating capital market integration at some level. In addition, the volatility spillover dropped quite sharply during the post-crisis period and was relatively stable during the AEC period. This result implies that economic and political activities have an impact on the ASEAN capital markets. Also, based on the spillover connectedness, Indonesia and Thailand are the net contributors of volatility spillovers, while Malaysia, Singapore, and the Philippines are the net-recipient.
In addition, the ASEAN Economic Community is formed to integrate ASEAN financial markets. It aims to improve capital flows and to reduce financial uncertainty through capital market integration. However, the results were somewhat disappointing. The empirical analysis showed that the overall quality of equity market integration dropped during the AEC period. The practical implication for Indonesian investors is that diversification benefits will be higher when investors invest in Thailand equities since both nations are the net contributors of volatility spillovers to other nations in ASEAN. Meanwhile, the practical implications for Malaysia, Singapore, and the Philippines investors is that they are encouraged to avoid investing heavily in Indonesia and Thailand equities during market turmoil since the nations are net contributors to volatility. Despite this, international portfolio managers may still gain some portfolio benefits by investing in ASEAN-5 countries.
For policymakers, policy harmonization among ASEAN 5 members is needed to increase the quality of financial integration and reduce the effects of financial instability. The law and rules should be integrated, and the mechanisms of cross-border listings should be relaxed. For example, the regulation on financial instruments taxes such as capital gain and dividends for ASEAN 5 members should be synchronized. Cross-border settlement mechanisms have to be integrated since the settlement is where assets are converted for cash. In addition, different mechanisms that could hinder integration should be eliminated, and each country’s authorities should collaborate to formulate general regulations imposed on the countries involved.
The research limitation is that this research was only focused on the main member of ASEAN and ASEAN Economic Community, with no detailed portfolio formulation. Further research is recommended to focus on ASEAN+3 financial integration, its effects on ASEAN 5 countries, and how to maximize the gain based on those findings. The calculation of portfolio weight in each country can also be formulated.
Availability of data and materials
The datasets used and/or analyzed during the current study are available from the corresponding author on reasonable request.
Authors’ contributions
All the authors have made an equal contribution to this study.
Acknowledgements
Not Applicable
Disclosure statement
No potential conflict of interest was reported by the authors.
Additional information
Funding
Notes on contributors

Robiyanto Robiyanto
Robiyanto Robiyanto is an Associate Professor from Satya Wacana Christian University, Salatiga, Indonesia. He is active as an academic researcher; his research interests are capital market, commodity market, market efficiency, corporate governance, and portfolio management.
Bayu Adi Nugroho
Bayu Adi Nugroho obtained his Master degree from University of New South Wales, Australia. He is active as an academic researcher. His research interests are the capital market and portfolio management.
Eka Handriani
Eka Handriani is an Associate Professor from Faculty of Economics and Business, Darul Ulum Islamic Centre Sudirman University GUPPI, Ungaran, Indonesia. Her research interests are capital market, corporate finance, and corporate governance.
Budi Frensidy
Budi Frensidy is a Full Professor in Capital Market from Universitas Indonesia, Depok, Indonesia.
References
- Andersen, T. G., Bollerslev, T., Diebold, F. X., & Vega, C. (2007). Real-time price discovery in global stock, bond and foreign exchange markets. Journal of International Economics, 73(2), 251–20. https://doi.org/10.1016/j.jinteco.2007.02.004
- Arsyad, N. (2015). Integration between East and Southeast Asian equity markets. Journal of Financial Economic Policy, 17(2), 104–121. https://doi.org/10.1108/JFEP-02-2014-0012
- Bastin, J. (2018). Risk-based investing in the German stock market. Prague Economic Papers, 27(1), 55–72. https://doi.org/10.18267/j.pep.643
- Batten, J. A., & Kearney, C. (2006). Interdependence and integration in emerging European Financial Markets. In Jonathan A. Batten & Colm K. (Eds.), Emerging European Financial Market (pp. 1-14). Independence and Integration Post-Enlargement: Elsevier Ltd.
- Batten, J. A., Kinateder, H., Szilagyi, P. G., & Wagner, N. F. (2019). Time-varying energy and stock market integration in Asia. Energy Economics, 80, 777–792. https://doi.org/10.1016/j.eneco.2019.01.008
- Buğan, M. F. (2021). Covid-19, investor sentiment and contagion across stock markets. International Journal of Economics and Innovation, 7(1), 169–182. https://doi.org/10.20979/ueyd.874254
- Buğan, M. F., Cevik, E. I., & Dibooglu, S. (2022). Emerging market portfolios and Islamic financial markets: Diversification benefits and safe havens. Borsa Istanbul Review, 22(1), 77–91. https://doi.org/10.1016/j.bir.2021.01.007
- Caporale, G. M., Gil-Alana, L. A., & You, K. (2022). Stock market linkages between the ASEAN Countries, China and the US: A fractional integration/cointegration Approach. Emerging Markets Finance and Trade, 58(5), 1502–1514. https://doi.org/10.1080/1540496X.2021.1898366
- Cappiello, L., Engle, R. F., & Sheppard, K. (2006). Asymmetric dynamics in the correlations of global equity and bond returns. Journal of Financial Econometrics, 4(4), 537–572. https://doi.org/10.1093/jjfinec/nbl005
- Cevik, E. I., Gunay, S., Zafar, M. W., Destek, M. A., Buğan, M. F., & Tuna, F. (2022). The impact of digital finance on the natural resource market: Evidence from DeFi, oil, and gold. Resources Policy, 79, 79, 103081. https://doi.org/10.1016/j.resourpol.2022.103081
- Chunhachinda, P., de Boyrie, M. E., & Pavlova, I. (2018). Measuring the hedging effectiveness of commodities. Finance Research Letters. https://doi.org/10.1016/j.frl.2018.09.012
- Diebold, F. X., & Yilmaz, K. (2009). Measuring financial asset return and volatility spillovers, with application to global equity markets. The Economic Journal, 119(534), 158–171. https://doi.org/10.1111/j.1468-0297.2008.02208.x
- Diebold, F. X., & Yilmaz, K. (2012). Better to give than to receive: Predictive directional measurement of volatility spillovers. International Journal of Forecasting, 28(1), 57–66. https://doi.org/10.1016/j.ijforecast.2011.02.006
- Engle, R. F. (2002). Dynamic Conditional Correlation: A simple class of multivariate generalized autoregressive conditional heteroskedasticity models. Journal of Business & Economic Statistics, 20(3), 339–350. https://doi.org/10.1198/073500102288618487
- Gugler, P., & Vanoli, L. (2017). Convergence or divergence of prosperity within the ASEAN community? A crucial issue for the success of the ASEAN economic community (AEC) process. International Journal of Emerging Markets, 12(3), 610–624. https://doi.org/10.1108/IJoEM-09-2016-0231
- Ivanova, M., & Dospatliev, L. (2018). Application of Markowitz Portfolio optimization on Bulgarian stock market from 2013 to 2016. International Journal of Pure and Applied Mathematics, 117(2), 291–307. https://doi.org/10.12732/ijpam.v117i2.5
- Jarungkitkul, W., & Sukcharoensin, S. (2016). Benchmarking the competitiveness of the ASEAN 5 equity markets. Benchmarking: An International Journal, 23(5), 1312–1340. https://doi.org/10.1108/bij-05-2014-0047
- Kang, S. H., McIver, R., & Yoon, S.-M. (2017). Dynamic spillover effects among crude oil, precious metal, and agricultural commodity futures markets. Energy Economics, 62, 19–32. https://doi.org/10.1016/j.eneco.2016.12.011
- Karim, B. A., & Karim, Z. A. (2012). Integration of ASEAN-5 stock markets: A revisit. Asian Academy of Management Journal of Accounting and Finance, 8(2), 21–41. https://ejournal.usm.my/aamjaf/article/view/aamjaf_vol8-no2-2012_2/pdf
- Karim, B. A., & Ning, H. X. (2013). Driving forces of the ASEAN-5 stock markets integration. Asia-Pacific Journal of Business Administration, 5(3), 186–191. https://dx.doi.org/10.1108/APJBA-07-2012-0053
- Karim, B. A., & Rahman, A. A. (2020). Market Integration in Asean-5: Evidence of Islamic and Conventional Stock Markets. Polish Journal of Management Studies, 21(1), 186–198. http://dx.doi.org/10.17512/pjms.2020.21.1.14
- Kearney, C., & Lucey, B. M. (2004). International equity market integration: Theory, evidence and implications. International Journal of Financial Analysis, 13(5), 571–583. https://doi.org/10.1016/j.irfa.2004.02.013
- Ku, Y.-H.-H., Chen, H.-C., & Chen, K.-H. (2007). On the application of the dynamic conditional correlation model in estimating optimal time-varying hedge ratios. Applied Economics Letters, 14(7), 503–509. https://doi.org/10.1080/13504850500447331
- Lizarzaburu Bolaños, E. R., Burneo, K., Galindo, H., & Berggrun, L. (2015). Emerging markets integration in Latin America (MILA) stock market indicators: Chile, Colombia, and Peru. Journal of Economics, Finance and Administrative Science, 20(39), 74–83. https://doi.org/10.1016/j.jefas.2015.08.002
- Macedo, J. B. D., Goldstein, J., & Meerschwan, D. (1984). Exchange rate theory and practice. In J. F. O. Bilson & R. C. Marston (Eds.), International Portfolio Diversification: Short Term Financial Assets and Gold (pp. 199–238). University of Chicago Press.
- Majid, M. S. A., Kassim, S. H., & McManus, J. (2009). Impact of the 2007 US financial crisis on the emerging equity markets. International Journal of Emerging Markets, 4(4), 341–357. https://doi.org/10.1108/17468800910991241
- Majid, M. S. A., Meera, A. K. M., & Omar, M. A. (2008). Interdependence of ASEAN-5 Stock Markets from the US and Japan. Global Economic Review, 37(2), 201–225. https://doi.org/10.1080/12265080802021201
- Mangram, M. E. (2013). A Simplified Perspective of the Markowitz Portfolio Theory. Global Journal of Business Research, 7(1), 59–70. https://papers.ssrn.com/sol3/Delivery.cfm/SSRN_ID2147880_code1332876.pdf?abstractid=2147880&mirid=1
- Markowitz, H. M. (1952). Portfolio Selection. Journal of Finance, 7(1), 77–91. http://dx.doi.org/10.1111/j.1540-6261.1952.tb01525.x
- Mehmood, R., Hunjra, A., & Chani, M. (2019). The impact of corporate diversification and financial structure on firm performance: Evidence from South Asian Countries. Journal of Risk and Financial Management, 12(1), 49. https://doi.org/10.3390/jrfm12010049
- Muharam, H., Mawardi, W., Arfinto, E. D., & Najmudin, N. (2019). Volatility spillovers under difference in the degree of market integration: Evidence from the selected Asian and Eastern European stock markets. Journal of International Studies, 12(1), 134–150. https://doi.org/10.14254/2071-8330.2019/12-1/9
- Nugroho, B. A., Juwono, E., & Wijayanti, I. (2018). Do leading macroeconomic factors impact on optimal portfolio return in Indonesia? Binus Business Review, 9(1), 19–27. https://doi.org/10.21512/bbr.v9i1.3960
- Oprea, O.-R., & Stoica, O. (2018). Capital markets integration and economic growth. Montenegrin Journal of Economics, 14(3), 23–35. https://doi.org/10.14254/1800-5845/2018.14-3.2
- Rahman, M. S., Othman, A. H. A., & Shahari, F. (2017). Testing the validation of the financial cooperation agreement among ASEAN+3 stock markets. International Journal of Emerging Markets, 12(3), 572–592. https://doi.org/10.1108/IJoEM-05-2016-0127
- Robiyanto, R. (2017). The Analysis of capital market integration in ASEAN region by using the OGARCH Approach. Jurnal Keuangan Dan Perbankan, 21(2), 169–175. https://doi.org/10.26905/jkdp.v21i2.1138
- Robiyanto, R. (2018). Indonesian stock market’s dynamic integration with Asian stock markets and World Stock Markets. Jurnal Pengurusan, 52, 181–192. https://doi.org/10.17576/pengurusan-2018-52-15
- Robiyanto, R., & Ernayani, R. (2018). Capital market integration in some ASEAN countries revisited. Jurnal Manajemen, 22(2), 205–222. https://doi.org/10.24912/jm.v22i2.359
- Robiyanto, R., Hersugondo, H., & Chotijah, G. S. (2016). ASEAN economic community (AEC) and economic stability: A review from Indonesia’s Side. International Journal of Economic Research, 13(2), 603–611. https://serialsjournals.com/abstract/43698_9.pdf
- Robiyanto, R., Nugroho, B. A., & Lako, A. (2020). Safe haven and performance of extension-Markowitz portfolio on Indonesian ethical investments. International Journal of Economic Policy in Emerging Economies, 13(3), 225–243. http://dx.doi.org/10.1504/IJEPEE.2020.109050
- Robiyanto, R., Wahyudi, S., & Pangestuti, I. R. D. (2017). The volatility–variability hypotheses testing and hedging effectiveness of precious metals for the Indonesian and Malaysian capital markets. Gadjah Mada International Journal of Business, 19(2), 167–192. https://doi.org/10.22146/gamaijb.26260
- Suryanta, B. (2011). Capital market Integration in ASEAN Countries: Special investigation of Indonesian Towards the Big Four. Asian Journal of Technology Management, 4(2), 109–114. https://www.sbm.itb.ac.id/wp-content/uploads/2011/12/4-Barli.pdf
- Thomas, N. M., Kashiramka, S., & Yadav, S. S. (2017). Dynamic linkages among developed, emerging and frontier capital markets of Asia-Pacific region. Journal of Advances in Management Research, 14(3), 332–351. https://doi.org/10.1108/jamr-10-2016-0088
- Xu, W., Ma, F., Chen, W., & Zhang, B. (2019). Asymmetric volatility spillovers between oil and stock markets: Evidence from China and the United States. Energy Economics, 80, 310–320. https://www.worldbank.org/en/country/indonesia/overview
APPENDIX 1
This study used Engle’s (Citation2002). In the bivariate model, the process has the following mean and variance:
was a vector representing JKSE returns and other emerging equities in Southeast Asia.
was the conditional mean vector of
.
was the conditional variance. a and b were the ARCH/GARCH effects. Hence, DCC (1,1) can be depicted in the following equation:
was the dynamic unconditional correlation matrix of
while
and
represented the effects of lagged shocks and lagged DCCs, in addition, the DCC between assets x and y is given by:
APPENDIX 2
The realized volatility is calculated as the sum of intraday squared returns such as (Andersen et al., Citation2007):
Δ and illustrates the sampling interval and the intraday return during day t, respectively
Regarding the covariance stationary of realized variance, in N different capital markets, with a lag length P-th, such that VAR(P) can be quantified by:
Where is a vector disturbance and
is for i = 1, …,p
Utilizing the volatility contributions from the variance decomposition, the total volatility spillover index can be created as follows (Diebold & Yilmaz, Citation2012)