
 ?Mathematical formulae have been encoded as MathML and are displayed in this HTML version using MathJax in order to improve their display. Uncheck the box to turn MathJax off. This feature requires Javascript. Click on a formula to zoom.
Abstract
This study examines the day-of-the-week and January effects on the top performing cryptocurrencies with the highest capitalization during the sample period. The study uses the daily closing returns of selected currencies for 7 August 2015 to 20 August 2020. The day-of-the-week results indicate that the Monday effect in the daily analysis generated a positive and significant coefficient for all five currencies and this anomaly is present in the cryptocurrency market. However, for all currencies, the December returns showed a significantly higher pattern as compared to January. This tendency indicates some prospects of lucrative trading. However, the evidence of negative Monday returns in this period is somewhat consistent with the relevant empirical literature. The study has some implications for investors, in that they can formulate strategies to produce abnormal returns. Investors and market analysts can form diverse portfolios by combining various cryptocurrencies using the intraday price statistics, and can devise strategies based on the intraday patterns using a similar analysis as that in this study.
1. Introduction
Technological advancement led to radical changes in financial markets. It not only made the system much more efficient, but also led to considerable innovations that changed finance radically. One of the most important innovations in the financial world came in in the form of cryptocurrencies. Bitcoin, introduced in 2009, was the first cryptocurrency. The US congressional discussion to regulate the Bitcoin market functions (Bains et al., Citation2022; Nicks, Citation2013) and recent restrictions imposed by the Chinese government on Bitcoin trading (Hill, Citation2014; Riley, Citation2021) did not decrease investor interest worldwide. Further, the value of Bitcoin is now approaching the price of valuable assets such as gold (Giudici & Abu-Hashish, Citation2019).
However, the cryptocurrencies are evolving and gaining the interests of the analysts and investors with the growing advancement that enables the investors to invest without the assistance of the financial institutions and gain profit (Kyriazis et al., Citation2019). Researches have analyzed the bitcoin price distribution may vary across the weekdays. Moreover, the increasing debate of the cryptocurrencies especially bitcoin enables researchers to investigate whether the calendar anomalies exists in the transaction process (Aharon & Qadan, Citation2019). These studies find that the Monday effect exists in the Bitcoin market, though unlike other financial markets, the Bitcoin market tends to operate without any breaks due to its constant online availability. Theoretically, investors cannot technically “beat the market;” that is, they cannot predict asset prices and thus cannot make an extra profit. This unpredictability in asset prices is often referred to as a random walk. However, various studies challenge the efficient market hypothesis (EMH), and in reality, it is very rare that any financial market could be as efficient as it implies (Aharon & Qadan, Citation2019). Market anomalies are windows of opportunity that often open for a short period, and an investor who picks up the trend can beat the market and earn a considerable profit. Bariviera (Citation2017) determined the persistence and volatility in Bitcoin prices, though concluded that while the volatility of Bitcoin does not follow a specific trend, volatility clustering is a prominent feature of the Bitcoin market.
Cryptocurrencies have gained momentum in their trading over the past years which opened the new avenues for the investors to understand the patterns of the market for their investments (Susana et al., Citation2020). This enables to explore the adaptive and dynamic patterns of cryptocurrencies which are being analyzed using the calendar effects existed in the market of cryptocurrency (Cimen, Citation2019; Khuntia & Pattanayak, Citation2021). Therefore, this study tries to determine the value mechanism of cryptocurrencies (of which Bitcoin is one) and their volatility based on calendar anomalies and the EMH. The table in appendix provides the abbreviations complete form that are used in the paper.
This study is unique in that it aims to examine the January effect and day-of-the-week effect in the cryptocurrency market. The cryptocurrencies in this study include Bitcoin, Dash, Etherum, Litecoin, and Ripple. The daily prices of the selected currencies are collected from 7 August 2015 to 20 August 2020. Extensive research on anomalies in the financial markets included cryptocurrencies, but primarily focused on Bitcoin. However, this study not only includes a group of cryptocurrencies, but also applies an advanced statistical method to determine the market anomalies.
This research provides the extant to the literature as the calendar anomalies and market volatilities for the cryptocurrencies have not been discussed in detail that provides the daily and monthly volatilities analysis. The study is unique in terms that the daily and monthly calendar effect has not been investigated much in literature. The nexus between the calendar anomalies and market volatilities transmission for the cryptocurrencies is analyzed in detail for the market analysts. This research provides evidences for vulnerability of the digital currencies and provide attention to the financial markets. This further provides the diversification to the investors about the different investment ways. Moreover, the benefit can be analyzed by the market analysts.
2. Cryptocurrency literature
The cryptocurrency price mechanism and its volatility have become a topic of interest among financial market researchers recently. Prior studies examined several aspects of the emergence of cryptocurrency. Gandal and Halaburda (Citation2016) found network effects in the cryptocurrency market. The results suggest that improved networking between investors tends to increase the value of the financial asset. Moreover, Fry and Cheah (Citation2016) applied an econo-physics model to study cryptocurrency and concluded that cryptocurrency is a highly volatile market, and to some extent, it is possible to predict negative bubbles in the relevant market.
2.1. Day of week effect
Cryptocurrency is an emerging area in the academic literature. Few studies investigate calendar anomalies and the EMH for cryptocurrency. Apart from the cryptocurrency market, many other studies analyze the existence of anomalies in financial markets. Zhang et al. (Citation2016) studied the day-of-the-week effect in 28 prominent stock exchanges of 25 countries and found that this effect exists for all of the stock exchanges, except that the day differs from market to market. A study based on the EMH by (Latif et al., Citation2011) investigated market efficiency and market anomalies. The study highlighted various types of anomalies in various international stock markets, including calendar anomalies, fundamental anomalies, and technical anomalies. Poshakwale (Citation1996) found that the day-of-the-week effect exists in the Indian Stock Market, thus negating the EMH and random walk. Ajayi et al. (Citation2004) studied the day-of-the-week effect in Eastern European Emerging Markets. Kiymaz and Berument (Citation2003) explored the relationship between day-of-the-week effect and the volatility in key global stock markets. The findings are quite logical high volatility comes with significant unpredictability for investors, thus making them apprehensive about trading in the market. The study found that Germany and Japan tend to have the highest volatility on Mondays, the United Kingdom experiences high volatility on Thursdays, and the US and Canada tend to have high volatility on Fridays. The study concluded that these days in their respective countries were symbolized by low trading volume.
Aharon and Qadan (Citation2019) investigated cryptocurrencies especially the bitcoin with the day of the week effect. The results indicates the presences of the DOW effect in the bitcoin both in returns and volatilities which may limits the forecasting the price of Bitcoin. Moreover, Kyriazis et al. (Citation2019) studies bearish market of cryptocurrencies using GARCH family models which results that Bitcoin, Ethereum and Ripple have no hedging abilities among main digital currencies.
Nazir et al. (Citation2020) conducted an interesting study of the impact of temperature anomalies on stock returns and found a significant negative relationship between temperature and stock market returns. They concluded that in the case of high-temperatures, apathy tends to overcome aggression, and therefore that high temperatures lead to low stock returns. To validate the results, the study considered a wide range of stock markets worldwide. (Salisu & Ogbonna, Citation2022) analyzed an interesting factor of news which affects the predictability of the returns and its volatilities for the virtual and digital currencies. The results employ that the COVID-19 pandemic news induced fear in the investors which triggered the investment abilities and return volatilities with the news effect.
2.2. January effect
The January effect in financial markets has always been of great interest, and it is undoubtedly an important market anomaly (Kinateder & Papavassiliou, Citation2021). Existence of calendar anomalies in cryptocurrencies may affect the investment horizons however comovements among the virtual currencies and the dynamics of the investment opportunities that might be influenced by idiosyncratic shocks (Agyei et al., Citation2022). Several studies tested test this important market anomaly in stock markets. Chowdhury et al. (Citation2022) studied the January effect in the US equity market. Girardin and Namin (Citation2019) studied the January effect on stock returns using a Markov switching model under high and low volatility regimes and found some meaningful results. First, the January effect exists regardless of the volatility regime. Secondly, the January effect persists regardless of portfolio size. Gharaibeh (Citation2017) examined the January effect in Arabic markets and Malini and Jais (Citation2014) investigated the January effect in Indonesian and Malaysian stock markets, specifically in Shariah-compliant companies. The results of these studies give mixed trends.
Several studies examined the January effect in a single market. However, Bohl and Salm (Citation2010) studied the January effect at the international level by using a sample of 19 countries and found that only two of the 19 countries showed the existence of the January effect. The study concluded that the forecasting power of January is not unique, as almost all of the other months showed the same forecasting power. Perez (Citation2018) conducted a study of a similar nature, focusing on the January effect at the international level by studying 86 countries, including both developed and emerging economies. The study also found that although the January effect tends to exist in some regions, globally, the trend seemed to be declining. The study also quoted the diminishing trend of the January effect in the US stock market, similar to (Patel, Citation2016). Gandal and Halaburda (Citation2016) study reaffirmed the existence of the January effect in the stock market. The effect is most heavily evident in small-cap companies. Klock (Citation2014) reaffirmed the existence of the January effect and thus proved that the market is not weak form efficient. Likewise, Sahin et al. (Citation2017) studied the January effect in the stock exchanges of Bursa Istanbul and the Bucharest Stock Exchange.
The January effect was also examined in other markets, such as by Coutts and Sheikh (Citation2002), who investigated the existence of a variety of calendar anomalies in the All Gold Index of the Johannesburg Stock Exchange. The study concluded that none of the calendar anomalies they considered exists in this exchange. Another study questioning the existence of the January effect in the futures market by Rendon and Ziemba (Citation2007) investigated whether the January effect exists in the futures market. Others examined the bond market to determine the existence of the January effect. Hassan et al. (Citation2019) conducted a study to analyze whether the January effect exists in the high yield bond market and reaffirmed previous findings that the January effect did exist in the high yield bond market. The competition in cryptocurrency is not as stringent as that of the stock market. Therefore, there is a significant debate on whether cryptocurrency provides an avenue for speculation or whether it acts as a viable investment opportunity. Baek and Elbeck (Citation2015) attempted to investigate this question by comparing the volatility of Bitcoin and the S&P 500 Index, and concluded that external economic factors play a minor role in the volatility of Bitcoin. Instead, internal factors of the Bitcoin market generate this volatility. Akyildirim et al. (Citation2020) conducted a study on Bitcoin to examine the EMH in the cryptocurrency market and concluded that Bitcoin follows the EMH and the impact of speculative activities on the price of Bitcoin is negligible. The study also concluded that the Bitcoin market strictly worked on the principle of matching demand and supply for price determination.
The lack of investigation and mixed results on calendar anomalies in cryptocurrency markets provide an opportunity to conduct an in-depth analysis in this area. This study examines the effect of calendar anomalies on cryptocurrency prices and its volatility, and is not restricted to Bitcoin only. Further, more advanced statistical techniques will address the methodological concerns.
3. Data source
This study examines the top five traded cryptocurrencies for the existence of the day-of-the-week effect or conditional week effect and the January effect. All the data are downloaded from coinmarketcap.com. This study focuses on the cryptocurrency market, and the sample consists of the top traded currencies. The sample period starts on 7 August 2015 so that the effective dates cannot impact the return valuation.
3.1. Analysis of calendar anomalies
Some calendar anomalies are tested in global markets, but this study tests the day-of-the-week effect and the January effect using an MGARCH analysis with dummy variables for the days and months. The returns calculations are based on the log difference of the consecutive daily closing prices of the selected cryptocurrencies (Akyildirim et al., Citation2021). The log differencing accounts for the continuous compounded rate of return, represented in the equation:
A single period rate of return can be calculated as an average over several periods. Representing , as the cryptocurrency value on day t, the arithmetic return of single period,
, for day t is
1
Eq. 1 can be changed to Eq. 2, while the rate of the recurrence of the measured currency’s price is high
2
In the bounds of infinite asset price frequency, and hence the time between and
decreasing to 0, this estimate becomes precise and is continuous compounding. Symmetry is the key benefit of continuous compounded returns, though the arithmetic returns are not: the positive and negative percent arithmetic returns are not equal. This formula simplifies the return series calculation as the adjusted price series, as the previous ones enclose all distributions and Eq. 1 or 2 can be directly applied to yield precise return series. The theoretical and empirical justification to choose logarithm returns in place of general return are that ideally, logarithmic returns are systematically more controllable while combining sub-period returns to form returns over extended periods. Empirically, the logarithmic returns fulfil the prior condition of a standard statistical technique because they are more likely to be normally distributed (Strong, Citation1992).
4. Methodology
It is also important to determine whether risk also fluctuates steadily over time besides evaluating returns through different periods, which is possible by analyzing the nature of volatility of the principal index. Although there are numerous other approaches, generalized autoregressive conditional heteroscedasticity (GARCH) based models are the most established method. Engle (Citation1982) first proposed the autoregressive conditional heteroscedasticity (ARCH) model, which was later generalized by (Bollerslev, Citation1986) as the GARCH model. The general form of the GARCH model is with the help of mean and the variance equations. The ARCH model is used to correct the variability in the variance. These models also account for volatility clustering, as (Mandelbrot, Citation1963) first illustrated that “large changes tend to be followed by large changes, of either sign, and small changes tend to be followed by small changes,” which is another standard feature of financial data. In other words, for the duration of the nearest preceding periods, the present level of volatility inclines toward a positive correlation.
Determining the time-varying variances of financial time series using the ARCH and GARCH models with univariate data motivated many researchers to extend its dimension to a multivariate form (Tse & Tsui, Citation2001). Multivariate GARCH models postulate that the variances and covariance movement over time. Since of the likelihood of high dimensions of the problem and the limitation that a covariance matrix must be positive definite, modelling a covariance matrix is hard (Au-Yeung & Gannon, Citation2005). The critical phase in MGARCH modelling is to deliver an accurate but parsimonious measurement of the variance matrix that confirms its positivity (Silvennoinen & Teräsvirta, Citation2009). Multivariate Generalized Autoregressive Conditional Heteroskedasticity (MGARCH) is used in analyzing calendar anomalies in cryptocurrencies because it can effectively model the volatility of the data. Cryptocurrency prices are known to be highly volatile, and MGARCH can capture this volatility by modeling the conditional variance of the data. This is important for identifying calendar anomalies because the volatility of the data can affect the results of the analysis.
MGARCH models can handle multiple variables and are able to capture the interactions between them. This is particularly useful when analyzing calendar anomalies in cryptocurrencies because prices are affected by multiple factors such as socio-economic trends, political moves, news and hype, and by using MGARCH models, it can account for the interactions between these factors (Rakshit & Neog, Citation2021). MGARCH models are also flexible and can be easily extended to include different forms of volatility (e.g., asymmetric volatility) which is important when it comes to the crypto market. They can also include exogenous variables to capture the impact of external factors such as news, hype and rumors. In summary, MGARCH models are well suited for analyzing calendar anomalies in cryptocurrencies because they can effectively model the volatility of the data, handle multiple variables, and can be extended to include different forms of volatility and exogenous variables (Özdemir, Citation2022).
The generalization of the univariate GARCH models to the multivariate case is straightforward. It is assumed that the conditional mean is zero and the conditional covariance matrix is given by the positive definite matrix
, for the error term
of a
dimensional time series model that is,
With independent and identically distributed (i.i.d.) innovation vector , whose covariance matrix equals the identity matrix
with a mean of zero. In the univariate case,
rests on the lagged error terms
and on the lagged conditional covariance matrices
. The generalization with an arbitrary reliance can lead to very composite configurations that may be too challenging to deal with in practice. Thus, researchers often aim to reduce the dimension of the parameter space.
4.1. The VEC Specification
Let vech(.) denote the operator that stacks the lower triangular part of a symmetric
matrix into a
dimensional vector. Furthermore, we use the notation
vech
and
vech
. The VEC specification of a multivariate GARCH(
) model is then
where and
are parameter matrices with each one containing
parameters. The vector
represents the constant components of the covariance and contains the
parameters. The selected variables of this research description have been attached in appendix Table .
5. Results and discussion
Table provides a summary of the statistics of the mean returns for all selected currencies. The descriptive statistics run for the same period for all currencies (7 August 2015) because they all have different release dates, up to 20 August 2020.
Table 1. Descriptive Statistics of Cryptocurrencies Returns
The skewness and kurtosis of the empirical distributions for all currencies depart from theoretical normal distribution bounds, which have kurtosis equal to 3 and skewness equal to 0. The skewness shows the asymmetry of the returns distribution around its mean, and kurtosis is a degree of the peakedness of the distribution. For the data in this study, the skewness is negative, which shows that the distribution is left-skewed and that the distribution is more extended towards negative values, except for Ripple. Regarding the financial returns data, there is a substantial chance of minor gains and a slight possibility of considerable losses in terms of attaining substantial negative returns. In addition, the kurtosis is significantly different from 3. Positive excess kurtosis describes a fat-tailed, peaked distribution relative to the normal distribution. The results of skewness and kurtosis are in consistent with the researches of (Giudici & Abu-Hashish, Citation2019; Kaya Soylu et al., Citation2020).
Additionally, the results of the Jarque-Bera normality tests suggest that the null hypothesis of the normality of returns should be rejected at the 5% significance level which far from the normality assumption as consistent with the researches of (Agyei et al., Citation2022; Shanaev & Ghimire, Citation2022). Co-efficient of variation (C.V) represent the consistency among returns of different cryptocurrencies, smallest C.V of Ethereum Return shows that the returns of Ethereum currency are most consistent. Considering the risk-return phenomenon, the most volatile currency is observed to be Ripple whereas the highest returns belong to Ethereum currency. The results are consistent with the study of (Kaya Soylu et al., Citation2020).
In Figure , the bitcoin among all the currencies have the highest closing price as it can be seen from the graph that at secondary axis the bitcoin values are around 10,000 and it increased from 2015 to 2020. The major increase happened during 2017–2018 when the bitcoin showed highest trend but it gradually decreased in 2019. However, it again showed fluctuating but upwards trend afterwards. On the contrary, the ripple has the lowest prices between the timeline of august 2015 to august 2020 in comparison with the other currencies and showed a little upwards trend in end of 2017 and start of 2018 but then after a minor fluctuation can be seen. Ethereum comes at the second position with major fluctuations and high value after bitcoin in context with other currencies. It can be seen from the graph that all currencies movement increased at the end of 2017 and start of 2018. The reason for increase in the prices of bitcoin due to the coordinated price manipulation by other cryptocurrencies which created the bubbles in the cryptocurrencies market which crashed in 2018. This crash is known as the great cryptocurrencies crash (Corbet et al., Citation2019; Poyser, Citation2018).
Figure 1. Digital Currencies Performance.
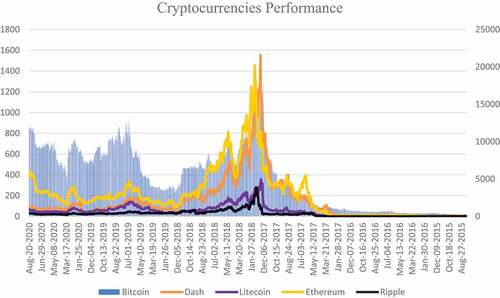
Table presents the descriptive statistics for the returns for all five selected currencies for each day of the week. For Bitcoin currency, Minimum returns are observed to be on Saturday and maximum returns are on Saturday whereas maximum returns are observed on Monday & Thursday with least risk as compared to rest of the working days. The variation in returns are found to be more consistent on Saturday. The variation in the results are consistent with the research of (Ma & Tanizaki, Citation2019).
Table 2. Descriptive Statistics of Cryptocurrencies on Daily Basis
For Dash returns, negative returns are observed on Monday and Saturday with highest risk as compared to other working days and the volatility in returns are found to be more consistent as compared to other week days. The observed volatility in returns of Dash currency can also be seen in the research of (Ma & Tanizaki, Citation2019). For Litecoin return, negative returns are observed to be on Saturday with maximum risk while maximum returns are observed on Friday as compared to rest of the week days. The fluctuation in returns are found to be more consistent on Saturday as compared to week days. For Ethereum return, minimum returns observed to be on Friday while maximum returns occur on Sunday with least risk as compared to week days. Consistent fluctuations in returns are observed on Sunday. For returns of Ripple currency, negative returns are observed to be on Saturday with risk on higher side while maximum returns are observed to be on Thursday. Consistent fluctuations in returns are observed in Saturday as compared to remaining week days. (Hinny & Szabó, Citation2022) analyzed the same analysis for the ripple currency.
The most imperative outcome from this panel is the negative return on Saturday for four currencies, which have very high kurtosis and negative skewness, whereas Ethereum shows positive but low returns with negative skewness and high kurtosis. Another important aspect of these results is the negative skewness for Ethereum and Ripple on Friday, with negative returns on these days, while Ripple and Dash are the only currencies with negative returns on Monday. The value greater than 3 indicates that the returns series is leptokurtic (Brooks, Citation2014). There is no constant rise or fall in daily returns in any of the five currencies. The return series are negatively skewed and fat-tailed in some cases, whereas the kurtosis is all positive.
Table shows that all of the mean monthly returns are negative in September, except for Bitcoin, but even if it is positive, it showed little return. The results indicate negative returns for Bitcoin, Litecoin, and Ripple in January, and for Bitcoin, Litecoin, and Dash for May. Similarly, the highest return on Dash and Ethereum occurred in February, and Ripple showed the highest return in December. Bitcoin showed the lowest return in December, followed by a negative return in January. Additionally, the results indicate a high variation in May. The high levels of kurtosis show that the unconditional distribution tends to have a higher peak and fatter tails than the normal distribution does, in line with the existence of conditional heteroscedasticity for all of the returns series. Consequently, all of the currencies return series are non-normally distributed (Kuang, Citation2021).
Table 3. Descriptive Statistics of Cryptocurrencies on Monthly Basis
For returns of Bitcoin currency, the returns are found to be negative and found to be consistent on month May with highest risk. In months, April and October the risk in returns are observed to be least. For Dash currency returns, concerning average return and risk, the highest average and risk is found to be on the months February and May respectively. For Litecoin currency returns, related return and risk, the highest average and risk is found to be on the months April and May respectively. For Litecoin currency returns, related return and risk, the highest average and risk is found to be on the months February and May respectively. For Litecoin currency returns, related return and risk, the highest average and risk is found to be on the months April and May respectively. (Koutmos, Citation2020) investigated the risk associated with the returns of the digital currencies where the results reveals that high and low bitcoin volatility in prices due to the heterogeneity of the returns and market risk factors because the bitcoin returns are difficult to explain with the ranging volatilities. This factor affects the economic fundamentals of the country.
Table reports the MGARCH results for the day-of-the-week effect. Panel A shows that the Monday effect in the daily analysis generates a positive and significant coefficient for all five currencies. The Dash return generates an insignificant negative coefficient, signifying a weakening of the effect for the last three days of the week (i.e., Friday, Saturday, and Sunday), while Monday produces a positive coefficient, signifying a comprehensive reversal in the Monday effect, hence supporting the Adaptive Market Hypothesis. The coefficients of the mean equation reveal that Ripple returns were higher on Sunday, Monday, Wednesday, and Thursday compared to the other currencies, and they were significant at the 5% and 1% levels, respectively. The returns on this currency showed correct anomalies after accounting for the time-varying volatility. Under the variance equations, all of the coefficients were significant, possibly due to the time-varying market volatility. Therefore, investors may invest on these days to earn higher returns without high risk. The coefficient of the MGARCH parameters were close to one for Bitcoin and Litecoin returns, indicating highly persistent shocks to the conditional variance. (Canh et al., Citation2019) results are consistent with the findings of this research.
Table 4. Results of MGARCH regression on the sample data of cryptocurrencies to test day of the week effects
Table illustrates that the January effect was not significant in any of the selected cryptocurrencies. Thus, the null hypothesis is accepted, and there were no significant differences in mean returns between January and Non-January months. Thus, these currencies did not exhibit a January effect. Panel B presents the January effect results and shows that only Ethereum has a positive significant returns coefficient. However, the coefficient signs vary by month, with some periods producing positive coefficients and some periods producing negative coefficients. Concerning the January effect, the probability values for January were negatively significant at the 10% level, whereas in May, it is significant at the 1% level. Thus, the January effect did not exist for Bitcoin. (Baur et al., Citation2019) research investigations provides the same analysis as the research of this paper provides.
Table 5. Results of MGARCH regression on the sample data of cryptocurrencies to test Month of the week effects
This research reports mixed results with 5 different coins on the day of the week and month of the year analysis. There are several reasons for mixed results in calendar anomalies in cryptocurrencies. One reason is that the market for cryptocurrencies is relatively new and less mature compared to traditional financial markets, which may lead to more volatility and inconsistent results (Celeste et al., Citation2020). Additionally, there is a lack of consensus among researchers on the appropriate methods for analyzing calendar anomalies in cryptocurrencies, which can also lead to mixed results (Bariviera & Merediz‐Solà, Citation2021). The crypto market is highly speculative and may be influenced by factors such as news, hype, and rumors, which can make it difficult to identify consistent patterns or anomalies (Koutmos, Citation2020). Finally, the crypto market is highly decentralized and global, which can make it more difficult to identify and measure market-wide effects.
In order to identify the calendar anomalies in cryptocurrency investigations, the studies need to have a larger sample size, longer time period, robust methods, wider scope, more market coverage, and consideration of hype and rumors (Gandal and Halaburda, Citation2016). Additionally, the studies should be based on a large amount of data and use various methods to increase the robustness of the results (Akyildirim et al., Citation2020). The price of cryptocurrencies can be influenced by a variety of factors, including socio-economic trends and political moves. For example, positive developments in the mainstream adoption of cryptocurrencies can lead to increased demand and a higher price, while negative regulatory decisions or economic downturns can lead to decreased demand and a lower price. Additionally, the market for cryptocurrencies is highly speculative and can be influenced by rumors, news, and investor sentiment. Thus, it is hard to predict the exact price.
There are several reasons for the rise and fall in prices of cryptocurrency. One of the main factors is market sentiment, which refers to the overall attitude of investors towards a particular asset or market (Naeem et al., Citation2021). When sentiment is positive, prices tend to rise, and when sentiment is negative, prices tend to fall. Another important factor is regulatory changes, as government actions can have a significant impact on the price of a cryptocurrency. Additionally, the adoption and acceptance of a cryptocurrency by businesses and merchants can also affect its price. Finally, supply and demand also play a role in determining the price of a cryptocurrency. If there is a high demand for a particular coin and a limited supply, the price will tend to rise, and vice versa (Corbet et al., Citation2019; Poyser, Citation2018).
6. Conclusion
Cryptocurrency is an emerging market that has gained significant attention in the financial world. Specifically, after the financial crisis of 2007–08, the importance of cryptocurrency increased tremendously. Not only does this market leave regulators perplexed about its regulation but it also presented an interesting avenue of research to the academic world. Due to its lack of regulation, it not only attracted massive investments, but is also often criticized for its use as a vehicle for speculation and money laundering. This study explored the existence of the EMH in the cryptocurrency market by determining whether calendar anomalies exist in it or not. For this purpose, two major calendar anomalies are selected namely: the January effect and the Monday effect. This study used a MGARCH model to analyze five major cryptocurrencies (Bitcoin, Dash, Litecoin, Ripple, and Etherum) to examine the existence of calendar anomalies. The results indicated that the Monday effect tends to exist in all cryptocurrencies, thus negating the existence of the EMH. The anomaly of the January effect did not appear, as returns for all cryptocurrencies were higher in December compared to January. The results support trading activities of investor’s hypothesis which suggests that market sentiment and market liquidity also play a role in determining prices. A bullish market sentiment and high market liquidity will lead to upward pressure on prices, while a bearish market sentiment and low market liquidity will lead to downward pressure on prices (Diaconaşu et al., Citation2022).
This study is of significant importance for regulators, policymakers as it will aid them in formulating regulations by considering the calendar anomalies that exist in the market. Furthermore, the get the idea that how they can mitigate risk of abnormal profits and increase in the prices of the digital currencies that might affect the interest of investors for the cryptocurrencies. Moreover, investors will gain tremendously from the study as they could identify patterns of returns and risks in the market and can design a portfolio for optimum gain. The market analysts can get the detail analysis for the investment opportunities in the cryptocurrencies and help in evaluating their investments. This enables in making the future forecasts as help in filling the gap in making decisions related to the trading in digital currencies in the distressed times.
The main limitation of the present study is the magnitude and form of the data utilized. This study examined only the five currencies with the highest market capitalization during the sample period. Further research should use multiple cryptocurrencies. Similarly, future studies could examine the intraday price movements to recognize any possible variation in returns over different trading time spans within a day. Moreover, the future research can be on the substitutability between the virtual currencies that are cryptocurrencies in order to investigate the tradeoff between the risk and return for the portfolios of digital currencies.
Highlights
• This study aims to analyse calendar anomalies and market volatility in these five major cryptocurrencies (Bitcoin, Dash, Ethereum, Ripple, and Litecoin) using the MGARCH model.
• The study found that there are calendar anomalies in the returns of the cryptocurrencies, with the most significant day of the week was being Monday and significant month was December.
• Additionally, the study found that the volatility of the cryptocurrencies is clustered and that there is a significant positive relationship between volatility and returns.
• The MGARCH model was able to capture the volatility clustering and heteroscedasticity present in the data, which is important for analysing calendar anomalies and market volatility in the cryptocurrencies.
Correction
This article has been corrected with minor changes. These changes do not impact the academic content of the article.
Disclosure statement
No potential conflict of interest was reported by the author(s).
Data availability statement
In review Generated Statement: Publicly available datasets were analyzed in this study. This data can be found here: Data is collected from the website of https://coinmarketcap.com/
Additional information
Funding
References
- Agyei, S. K., Adam, A. M., Bossman, A., Asiamah, O., Owusu Junior, P., Asafo-Adjei, R., & Asafo-Adjei, E. (2022). Does volatility in cryptocurrencies drive the interconnectedness between the cryptocurrencies market? Insights from wavelets. Cogent Economics and Finance, 10(1), 2061682. https://doi.org/10.1080/23322039.2022.2061682
- Aharon, D. Y., & Qadan, M. (2019). Bitcoin and the day-of-the-week effect. In Finance Research Letters (pp. 31). https://doi.org/10.1016/j.frl.2018.12.004
- Ajayi, R. A., Mehdian, S., & Perry, M. J. (2004). The Day-of-the-week effect in stock returns: further evidence from eastern european emerging markets. In Emerging Markets Finance and Trade (pp. 53–25). https://doi.org/10.1080/1540496X.2004.11052582.
- Akyildirim, E., Corbet, S., Lucey, B., Sensoy, A., & Yarovaya, L. (2020). The relationship between implied volatility and cryptocurrency returns. Finance Research Letters, 33, 101212. https://doi.org/10.1016/j.frl.2019.06.010
- Akyildirim, E., Goncu, A., & Sensoy, A. (2021). Prediction of cryptocurrency returns using machine learning. Annals of Operations Research, 297(1–2), 3–36. https://doi.org/10.1007/s10479-020-03575-y
- Au-Yeung, S. P., & Gannon, G. (2005). Regulatory change and structural effects in HSIF and HSI volatility. Review of Futures Markets, 14, 283–308. https://citeseerx.ist.psu.edu/document?repid=rep1&type=pdf&doi=41e26e44de812a9f5ffceec0072000fab2932ed3
- Baek, C., & Elbeck, M. (2015). Bitcoins as an investment or speculative vehicle? A first look. In Applied Economics Letters (pp. 30–34). https://doi.org/10.1080/13504851.2014.916379
- Bains, P., Ismail, A., Melo, F., & Sugimoto, N. (2022). Regulating the crypto ecosystem: the case of stablecoins and arrangements. FinTech Notes, 2022, 8. https://doi.org/10.5089/9798400221675.063
- Bariviera, A. F. (2017). The inefficiency of Bitcoin revisited: A dynamic approach. In Economics Letters (pp. 1–4). https://doi.org/10.1016/j.econlet.2017.09.013
- Bariviera, A. F., & Merediz‐Solà, I. (2021). Where do we stand in cryptocurrencies economic research? A survey based on hybrid analysis. Journal of Economic Surveys, 35(2), 377–407. https://doi.org/10.1111/joes.12412
- Baur, D. G., Cahill, D., Godfrey, K., & Liu, Z. F. (2019). Bitcoin time-of-day, day-of-week and month-of-year effects in returns and trading volume. Finance Research Letters, 31, 78–92. https://doi.org/10.1016/j.frl.2019.04.023
- Bohl, M. T., & Salm, C. A. (2010). The Other January Effect: International evidence. The European Journal of Finance, 16(2), 173–182. https://doi.org/10.1080/13518470903037953
- Bollerslev, T. (1986). Generalized autoregressive conditional heteroskedasticity. Journal of Econometrics, 31(3), 307–327. https://doi.org/10.1016/0304-4076(86)90063-1
- Brooks, C. (2014). Introductory econometrics for finance. Cambridge university press.
- Canh, N. P., Wongchoti, U., Thanh, S. D., & Thong, N. T. (2019). Systematic risk in cryptocurrency market: Evidence from DCC-MGARCH model. Finance Research Letters, 29, 90–100. https://doi.org/10.1016/j.frl.2019.03.011
- Celeste, V., Corbet, S., & Gurdgiev, C. (2020). Fractal dynamics and wavelet analysis: Deep volatility and return properties of Bitcoin, Ethereum and Ripple. The Quarterly Review of Economics and Finance, 76, 310–324. https://doi.org/10.1016/j.qref.2019.09.011
- Chowdhury, E. K., Dhar, B. K., & Stasi, A. (2022). Volatility of the US stock market and business strategy during COVID‐19. In Business Strategy and Development. https://doi.org/10.1002/bsd2.203
- Cimen, A. (2019). Calendar anomalies in cryptocurrencies. Turkish Studies—Social Sciences, 14(5), 2097–2116. https://doi.org/10.29228/TurkishStudies.30274
- Corbet, S., Lucey, B., Urquhart, A., & Yarovaya, L. (2019). Cryptocurrencies as a financial asset: A systematic analysis. International Review of Financial Analysis, 62, 182–199. https://doi.org/10.1016/j.irfa.2018.09.003
- Coutts, J. A., & Sheikh, M. A. (2002). The anomalies that aren’t there: The weekend, January and pre-holiday effects on the all gold index on the Johannesburg Stock Exchange 1987-1997. Applied Financial Economics, 12(12), 863–871. https://doi.org/10.1080/09603100110052172
- Diaconaşu, D.-E., Mehdian, S., Stoica, O., & Trinidad Segovia, J. E. (2022). An analysis of investors’ behavior in Bitcoin market. PloS one, 17(3), e0264522. https://doi.org/10.1371/journal.pone.0264522
- Engle, R. F. (1982). Autoregressive conditional heteroscedasticity with estimates of the variance of United Kingdom inflation. Econometrica: Journal of the Econometric Society, 50(4), 987–1007. https://doi.org/10.2307/1912773
- Fry, J., & Cheah, E.-T. (2016). Negative bubbles and shocks in cryptocurrency markets. In International Review of Financial Analysis (pp. 343–352). https://doi.org/10.1016/j.irfa.2016.02.008
- Gandal, N., & Halaburda, H. (2016). Can We Predict the Winner in a Market with Network Effects? Competition in Cryptocurrency Market. In MDPI-games (pp. 7–16). https://doi.org/10.3390/g7030016
- Gharaibeh, O. (2017). The January Effect: Evidence from Four Arabic Market Indices. International Journal of Academic Research in Accounting, Finance and Management Sciences, 144–150. http://dx.doi.org/10.6007/IJARAFMS/v7-i1/2590
- Girardin, E., & Namin, F. S. (2019). The January effect in the foreign exchange market: Evidence for seasonal equity carry trades. Economic Modelling, 81, 422–439. https://doi.org/10.1016/j.econmod.2019.07.021
- Giudici, P., & Abu-Hashish, I. (2019). What determines bitcoin exchange prices? A network VAR approach. Finance Research Letters, 28, 309–318. https://doi.org/10.1016/j.frl.2018.05.013
- Hassan, M. K., Aliyu, S., Paltrinieri, A., & Khan, A. (2019). A review of Islamic investment literature. Economic Papers: A Journal of Applied Economics and Policy, 38(4), 345–380. https://doi.org/10.1111/1759-3441.12230
- Hill, K. (2014). China bites into Bitcoin. Forbes, 193(1), 43–44.
- Hinny, R., & Szabó, D. K. (2022). Cryptocurrency Market Anomalies: The Day-of-the-week Effect: A study on the existence of the Day-of-the-week effect in cryptocurrencies and crypto portfolios. https://www.diva-portal.org/smash/record.jsf?pid=diva2%3A1668865&dswid=-404
- Kaya Soylu, P., Okur, M., Çatıkkaş, Ö., & Altintig, Z. A. (2020). Long memory in the volatility of selected cryptocurrencies: Bitcoin, Ethereum and Ripple. Journal of Risk and Financial Management, 13(6), 107. https://doi.org/10.3390/jrfm13060107
- Khuntia, S., & Pattanayak, J. (2021). Adaptive calendar effects and volume of extra returns in the cryptocurrency market. International Journal of Emerging Markets. https://doi.org/10.1108/IJOEM-06-2020-0682
- Kinateder, H., & Papavassiliou, V. G. (2021). Calendar effects in bitcoin returns and volatility. Finance Research Letters, 38, 101420. https://doi.org/10.1016/j.frl.2019.101420
- Kiymaz, H., & Berument, H. (2003). The day of the week effect on stock market volatility and volume: International evidence. In Review of Financial Economics (pp. 363–380). https://doi.org/10.1016/S1058-3300(03)00038-7
- Klock, S. (2014). The January Effect: A Test of Market Effeciency. In Theses, Dissertations and Honors Papers (pp. 133). https://digitalcommons.longwood.edu/etd/133
- Koutmos, D. (2020). Market risk and Bitcoin returns. Annals of Operations Research, 294(1–2), 453–477. https://doi.org/10.1007/s10479-019-03255-6
- Kuang, W. (2021). Dynamic VaR forecasts using conditional Pearson type IV distribution. Journal of Forecasting, 40(3), 500–511. https://doi.org/10.1002/for.2726
- Kyriazis, Ν. A., Daskalou, K., Arampatzis, M., Prassa, P., & Papaioannou, E. (2019). Estimating the volatility of cryptocurrencies during bearish markets by employing GARCH models. Heliyon, 5(8), e02239. https://doi.org/10.1016/j.heliyon.2019.e02239
- Latif, M., Arshad, S., Fatima, M., & Farooq, S. (2011). Market efficiency, market anomalies, causes, evidences, and some behavioral aspects of market anomalies. Research Journal of Finance and Accounting, 222–255. https://d1wqtxts1xzle7.cloudfront.net/31809675/11-marketefficiencymarketanomaliescausesevidencesandsomebehavioralaspectsofmarketanomalies-120513003557-phpapp01-libre.pdf?1392451813=&response-content-disposition=inline%3B+filename%3DMarket_Efficiency_Market_Anomalies_Cause.pdf&Expires=1675513175&Signature=aaHEmMjCaxD7Jl6X1aLt0~scWwJ~7JEYx9PITaWZZQOZdu3hDLllmQlMNy-7uwK769TJtiUynpHaF1cw1iPMV5RYAAeL4S0fsQyg2UHhrfhW9U09u9Py4ilCX6FoZi5UFwzt~~ltyHfkCiOeMypkGAwEIQBXjYiwn9qUNs89ngIkgwAzKFriT4In2AsRgTnogAA3Fa5Zyh2zVxB~FcUcb8edYdxgY9ihbbmay~Q7A4rUHI24yoXa7cX2Qx27jdOO7hodppqHSNhK8A-cN7lqfZTPQcEfzXZaMlYD6Ft9gLe6Nm9mAZZh1YwCKkcWX6PTuHXwNiqwB9kht0dJkXZT0A__&Key-Pair-Id=APKAJLOHF5GGSLRBV4ZA
- Malini, H., & Jais, M. (2014). Testing the Existence of January Effect in Indonesia and Kuala Lumpur Shari’ah Compliance. In Jurnal Manajemen Bisnis Indonesia (pp. 187–196). https://doi.org/10.31843/jmbi.v1i2.17
- Mandelbrot, B. B. (1963). The variation of certain speculative prices. Journal of Business, 36, 392–417. http://dx.doi.org/10.1086/294632
- Ma, D., & Tanizaki, H. (2019). The day-of-the-week effect on Bitcoin return and volatility. Research in International Business and Finance, 49, 127–136. https://doi.org/10.1016/j.ribaf.2019.02.003
- Naeem, M. A., Mbarki, I., & Shahzad, S. J. H. (2021). Predictive role of online investor sentiment for cryptocurrency market: Evidence from happiness and fears. International Review of Economics and Finance, 73, 496–514. https://doi.org/10.1016/j.iref.2021.01.008
- Nazir, M. S., Mirza, H. H., Shaukat, A., & Liaqat, A. (2020). Testing for temperature anomaly in capital markets of Pakistan and India. Middle East J. of Management, 7(1), 1–16. https://doi.org/10.1504/MEJM.2020.105223
- Nicks, D. (2013). Bitcoin price SOARS as the senate mulls regulating the cryptocurrency. In Times.
- Özdemir, O. (2022). Cue the volatility spillover in the cryptocurrency markets during the COVID-19 pandemic: Evidence from DCC-GARCH and wavelet analysis. Financial Innovation, 8(1), 1–38. https://doi.org/10.1186/s40854-021-00319-0
- Patel, J. B. (2016). The January Effect Anomaly. The Journal of Applied Business Research, 317–324. https://doi.org/10.19030/jabr.v32i1.9540
- Perez, G. A. (2018). Does the january effect still exists? International Journal of Financial Research, 50–73. https://doi.org/10.5430/ijfr.v9n1p50
- Poshakwale, S. (1996). Evidence on weak form efficiency. In FINANCE INDIA (pp. 605–616). https://d1wqtxts1xzle7.cloudfront.net/6364178/fi103art3-libre.pdf?1390845834=&response-content-disposition=inline%3B+filename%3DEvidence_on_weak_form_efficiency_and_day.pdf&Expires=1675513413&Signature=EvebQgCwOjpyuoNBZEUhUC1qSguofgTdYkbk587rlVRsVM5cEznOPNcRmKX3b7L7rX9MxnaGaL3mdVqOXJtdTOxcE1BJp~kNjlFEPpD7vTlMDTWIggP2k29qAHyOFlRvuNLWNRWRgsNr672aWIIrc-jS6fTM007Y7AbuVRMk~3LJ-Rfgl1vX1CzKztI6OAeu0twOnKawUkgzHZ~sFgJCznulgAakl4wgVXowkQiv8K8f8xCWNh3O9h~aaGOFc2HVExE-rwEpRwrn3ONQu95qgaY8aT4zonqEwgOZMwWooAC2ArEZ49LXB0Sn7x-Wpy-WXkr9I2aTv3TARQZDf6m2og__&Key-Pair-Id=APKAJLOHF5GGSLRBV4ZA
- Poyser, O. (2018). Herding behavior in cryptocurrency markets. In Statistical Finance. https://doi.org/10.48550/arXiv.1806.11348
- Rakshit, B., & Neog, Y. (2021). Effects of the COVID-19 pandemic on stock market returns and volatilities: Evidence from selected emerging economies. In Studies in Economics and Finance. https://doi.org/10.1108/SEF-09-2020-0389
- Rendon, J., & Ziemba, W. T. (2007). Is the January effect still alive in the futures markets? In Financial Markets Portfolio Management (pp. 281–396). https://doi.org/10.1007/s11408-007-0049-3
- Riley, J. (2021). The current status of cryptocurrency regulation in China and its effect around the world. China and WTO Review, 7(1), 135–152. https://doi.org/10.14330/cwr.2021.7.1.06
- Sahin, S., Topaloglu, E. E., & Ege, I. (2017). January effect revisited: Evidence from borsa istanbul and bucharest stock exchange. International Journal of Economics and Finance, 10(1), 159–166. https://doi.org/10.5539/ijef.v10n1p159
- Salisu, A. A., & Ogbonna, A. E. (2022). The return volatility of cryptocurrencies during the COVID-19 pandemic: Assessing the news effect. Global Finance Journal, 54, 100641. https://doi.org/10.1016/j.gfj.2021.100641
- Shanaev, S., & Ghimire, B. (2022). A generalised seasonality test and applications for cryptocurrency and stock market seasonality. The Quarterly Review of Economics and Finance, 86, 172–185. https://doi.org/10.1016/j.qref.2022.07.002
- Silvennoinen, A., & Teräsvirta, T. (2009). Multivariate GARCH models. In Handbook of financial time series (pp. 201–229). Springer.
- Strong, N. (1992). Modelling abnormal returns: A review article. Journal of Business Finance & Accounting, 19(4), 533–553. https://doi.org/10.1111/j.1468-5957.1992.tb00643.x
- Susana, D., Sreejith, S., & Kavisanmathi, J. (2020). A study on calendar anomalies in the cryptocurrency market. International Working Conference on Transfer and Diffusion of IT.
- Tse, Y. K., & Tsui, A. K. (2001). A multivariate GARCH model with time-varying correlations. In Econometrics. University Library of Munich, Germany. https://papers.ssrn.com/sol3/papers.cfm?abstract_id=3162726
- Zhang, J., Lai, Y., & Lin, J. (2016). The day-of-the-Week effects of stock markets in different countries. In Finance Research Letters (pp. 47–62). https://doi.org/10.1016/j.frl.2016.09.006
Appendix
Table A1. Variables Description
Table A2. List of Abbreviations