
Abstract
This study examines the factors affecting Ethiopia’s private bank performance. The study followed a causational research design employing data from 2010–to 2021. The study unit of analysis is Eleven private banks in Ethiopia. The study also uses PLS-SEM with Gaussian copula (GC) estimation because of its advantage in resolving econometric concerns of endogeneity. According to the study’s findings, industry-specific factors and macroeconomic variables have a negative statistically significant effect on bank performance. On the other hand, bank-specific factors have statistically positively affected both bank performance and the banking industry. Besides, industry-specific positively mediates the relationship between bank-specific factors and bank performance. The macroeconomic variables do not affect bank and industry-specific variables. Since Bank-specific factors enhance profit and industry (market share), continuous supervision and assistance from stakeholders can prevent banks from failing, improve their financial performance, and neutralize the industry’s adverse effect on the bank performance. Also, its mediating role through increasing the private banks’ market share may be due to the leading government-owned bank’s monopoly over the banking industry. The failure of banks could lead to the collapse of the entire economy. The current study fills a vacuum in the body of literature because it considers previously overlooked factors that affect bank performance, i.e., industry-specific variables and their mediating role on the effect of bank-specific factors on bank performance.
1. Introduction
For emerging nations to experience sustained growth, financial development is essential. However, before the financial sector develops, the banking sector needs proper regulation and supervision (Syed et al., Citation2022). Strong bank performance rewards the shareholders with an acceptable return on their investment in addition to resource allocation. Investments happen when there is a return, leading to economic expansion. On the other side, poor banking performance has a detrimental impact on the expansion and advancement of the economy; failures and crises can result from poor performance.
According to Aburime (Citation2008), both the micro and macro levels of the economy assess the significance of bank profitability. At the macro level, a healthy and prosperous banking industry can better resist adverse shocks and support the financial system’s stability. Profit is the lowest source of capital and a necessary condition for a competitive banking organization at the micro level. Therefore, as a fundamental prerequisite for conducting business, the primary goal of any bank management is to maximize profit.
The Ethiopian government’s development objective of eradicating poverty and fostering the expansion of the private sector depends on the financial industry (Abdu, Citation2022). The banking industry is one of the vital financial pillars in the financial institution that provides the required financial inputs to generate goods and services, which in turn helps to improve the people’s standard of living and general well-being in Ethiopia (Abdu, Citation2022). Given the government’s intention to update the framework for financing the deficit, monetary policy, and exchange rate determination, Ethiopia’s financial sector is experiencing significant policy changes. Private banks in Ethiopia have continuously increased their market shares in the Ethiopian banking sector (Ijara & Sharma, Citation2020). Nevertheless, the leading banks are owned by the government, which also dominates lending and manages interest rates; therefore, they hold a small market share.
The elements that determine financial performance are dynamic from time to time and vary depending on the style of operation of the firm from location to location, which makes the financial performance determinants argument intriguing (Flamini et al., Citation2009). As a result, measuring banks’ profitability has received the proper attention in the corporate finance literature. Previous studies on the factors influencing bank performance have produced inconsistent and sometimes contradictory findings. Moreover, they underrepresented the industry-specific variables (e.g., Almansour et al., Citation2021; Hasanov et al., Citation2018; Isayas, Citation2022; Mbabazize et al., Citation2020; Patwary & Tasneem, Citation2019; Topak & Talu, Citation2017). It is a crucial factor and has a significant impact on bank performance.
Additionally, the studies ignored the mediating role of industry-specific variables in the relationship between bank-specific factors and bank performance. Therefore, the current study fills this knowledge gap in the literature. Finally, since it extends the existing knowledge and applies novel methodological techniques, the study has a theoretical and methodological contribution to the subject matter.
The following sections make up the remainder of the paper. Section 2 presents the literature and conceptual model; Section 3 describes the empirical analysis techniques; Section 4 offers the results, and Section 5 discusses the findings. The final part presents the conclusion, recommendations, limitations and future research directions.
2. Literature review
2.1. Banking industry in Ethiopia
When Emperor Menelik II formally opened the first Bank of Abyssinia on 15 February 1906, banking in Ethiopia officially got underway. The stock of this private bank was traded in Addis Ababa, New York, Paris, London, and Vienna. The banking system underwent changes in 1931 under Emperor Haile Selassie. After the Bank of Abyssinia’s liquidation, its management, personnel, and assets were taken over by the newly founded Bank of Ethiopia, which the government owns. The Bank of Ethiopia offered the nation’s commercial and central banks services.
The banking industry grew throughout the five years of Italian occupation (1936–41). Banks from Italy were very active. The majority of the banks were active at the time. Britain played a crucial part in achieving Ethiopia’s independence from Italy’s brief occupation because of its strategic planning during World War II. Barclays Bank was created and operated there between 1941 and 1943 (Geda, Citation2008). The State Bank of Ethiopia (NBE), founded in 1942, was divided into three entities in 1963: the National Bank of Ethiopia, the Central Bank, and the Commercial Bank of Ethiopia (CBE).
The Ethiopian government followed a gradualism strategy, opening up private banks and insurance businesses alongside public ones (Geda, Citation2008). Liberalizing the foreign currency market and boosting local competitive ability before full liberalization (Geda, Citation2008). Limiting the industry to local investors, enhancing the NBE’s capabilities for regulation and oversight, granting banks autonomy, and expanding the interbank money market; Geda, Citation2008). Since 1992, numerous declarations and laws have been passed that follow this pattern (Geda, Citation2008).
Ethiopia now has 25 private commercial banks, one government-owned bank, and one development bank. The NBE Directive number. SBB/78/2021 increased banks’ minimum paid-up capital requirement from the previous ETB500 million to ETB5 billion. Existing banks have five years to satisfy the new standard; new banks have seven years to do so.
According to NBE (2022) report, there are now 83.3 billion birrs in deposit accounts, up from 40.04 billion. As a result, during the past four years, the total deposits have climbed from 899 billion in 2019 to 1.7 trillion in 2022. The bank’s overall capital increased from 98.9 billion birrs in 2019 to 199.1 billion birrs in 2022. The growth is recorded at an average annual growth rate of 27%. Additionally, banks’ overall assets increased by 92%, from 1.3 trillion to 2.4 trillion Birr. Additionally, as previously mentioned, banks’ net income climbed from 22.4 billion Birr in 2019 to 49.9 billion Birr in 2022, representing a 122% growth.
2.2. Theoretical reviews of bank performance
2.2.1. Structure-conduct-performance model
Markets’ interdependence is the focus of the Structure-Conduct-Performance model (SCPM). According to the three-pronged theory of firm profits (structure, company behavior, and firm performance), the higher the cost of entry, the simpler it is for existing businesses to sustain monopolistic profits. According to SCPM, market structure influences banks’ decisions, affecting their performance (Berger et al., Citation2004; Bikker & Spierdijk, Citation2017). Banks with more extensive market shares may have more market power and can take advantage of this. A limited number of banks also increases the likelihood of collaboration.
However, due to competition from new competitors, those gains will decline. Market concentration lowers corporate collaboration’s cost, leading to extraordinary profits for already-existing enterprises. According to some recent studies, empirical data does not support the relationship between market power and concentration (Chortareas et al., Citation2011; Mahathanaseth & Tauer, Citation2012; Van Leuvensteijn et al., Citation2011).
2.2.2. Market power theory
Market power, or “MP,” is the extent to which a business can determine the price of an item or service because it influences the demand or supply on the market. According to Berger et al. (Citation2004) and Van Leuvensteijn et al. (Citation2011), exceptionally high profits may signify a lack of competition. MP may also be related to profit in this way. Perfect competition is a theoretical economic model in which all enterprises in a market have the same amount of influence over consumers. As a result, businesses have little choice but to accept the prevailing market pricing. According to the MP hypothesis, improved financial operations and profits result from growth in external market pressures. Furthermore, the hypothesis states that only businesses with a high market share and a diverse product range can defeat their rivals and turn a monopolistic profit.
2.2.3. Efficiency structure theory
According to the Efficiency Structure (ES) hypothesis, more concentration and profits result from greater management scale efficiency. It testifies vital financial health to commercial banks (and other companies). According to the ES theory, more efficient businesses would expand in size and market share because they may charge less than rivals while remaining profitable. Higher profitability typically resulted in more intense market competition (Choi & Weiss, Citation2005). The efficiency structure theory also demonstrated a positive correlation between earnings and concentration. (Goldberg & Rai, Citation1996, pp. 2005, Choi, Weiss, 2017, Bikker, Spierdijk, 1991). Obamuyi (Citation2013), who promoted the balanced portfolio theory, claimed that bank performance analysis was given new information.
A bank’s management and policy decisions are assumed to impact its earnings, shareholder returns, and portfolio composition. Thus, the ideas provide credence to the assumption that internal and external factors affect bank performance. Therefore, according to ES theory, improved management and increased scale efficiency result in more concentration and profitability.
2.3. Bank performance
Commercial banks should aim for the best financial results possible. In the literature on bank performance, profitability measures have been closely correlated with bank performance. There needs to be a thorough and widely used performance indicator for financial institutions like banks in the literature. Instead, several scholars have tried to determine empirical parameters using financial data that affect the performance of banks.
Studies used return on assets, return on equity, and net interest margin to gauge bank performance (Munyambonera, Citation2013).
2.3.1. Return on asset
The bank’s ability to transform its assets into profits is reflected in its Return on Asset (ROA), which is the amount of money it makes for every Birr it has in assets. Off-balance-sheet operations may skew this number. This ratio represents the returns earned from a bank’s assets and is the most important single metric for measuring banks’ efficacy and operating performance (Tan & Floros, Citation2012). Empirical studies employed ROA to measure the performance of banks (e.g., (Tan & Floros, Citation2012; Munyambonera, Citation2013; ; Isayas, Citation2022).
2.3.2. Return on equity
As the name implies, return on equity (ROE) measures the profit made by an organization relative to the amount of equity invested by its owners (Tan & Floros, Citation2012). However, ROE does not account for the additional danger of using more leverage. While academic research often utilizes ROE, it only sometimes indicates true profitability (Ghazouani & Moussa, Citation2013). The empirical study utilized ROE while measuring bank profitability (e.g., (Tan & Floros, Citation2012; Munyambonera, Citation2013; Singh & Sharma, Citation2016; Rahman et al., Citation2015).
2.3.3. Net interest margin
Net Interest Margin (NIM) indicates efficiency and effectiveness of a bank are reflected (Okoth & Gemechu, Citation2013). When a bank’s NIM is large, it is profitable and secure. The NIM variable emphasizes the revenue generated by interest-related activities. Concerning the value of their (interest-earning) assets, it calculates the difference between the interest income generated by banks and the amount of interest paid on borrowed money (Tan & Floros, Citation2012). NIM, then, gauges the difference between the interest income the bank obtains on loans and securities and the interest cost of its borrowed funds with the typical amount of the assets on which earned income is generated over that period. The higher the net interest margin, the higher the bank’s profit and the more stable the bank is. However, a higher net interest margin could reflect riskier lending practices associated with substantial loan loss provisions. Some scholars also used NIM while measuring commercial banks’ performance (Tan & Floros, Citation2012; Munyambonera, Citation2013).
2.4. Determinants of bank performance
In addition to bank-specific factors, banks’ performance is affected by industry-specific factors and macroeconomic variables beyond management’s direct sphere of influence (Athanasoglou et al., Citation2008). The market share of assets, deposits, loan advances, and market concentration are industry-specific factors. Moreover, inflation, exchange rate, GDP, and others like unemployment and population growth are all examples of macroeconomic variables (factors).
2.5. Bank-specific factors
2.5.1. Liquidity
Liquidity measure’s ability to cover current obligations using current assets; a rate of return increases as the liquidity ratio rises. For a bank to be considered liquid, it must have sufficient resources to pay its bills and keep its depositors happy. The National Bank of Ethiopia (NBE) Directives No. SBB/9/95 mandated that all banks keep at least 5% of their reserves in primary assets.
Viewing the empirical results, liquidity significantly negatively affects the bank’s performance (Chandani et al., Citation2014; Jha & Hui, Citation2012; Venkatesh & Suresh, Citation2014). Hence, the proposed hypothesis is that liquidity negatively influences banks’ performance. According to studies on the negative effect of liquidity on bank profitability, banks with low liquidity ratios will have trouble making timely payments, may be forced to take out loans at exorbitant interest rates, and eventually threaten their profitability. However, a study by Isayas (Citation2022) found a positive effect of liquidity on bank profitability.
2.5.2. Bank size
The size of a bank can be thought of in terms of its total deposits (Dietrich & Wanzenried, 2010) or its total assets (Smirlock, Citation1985). According to the MP hypothesis, a company’s market power and profitability will rise as its relative size grows. Numerous studies discovered an adverse effect of bank size on bank profitability (Mazviona et al., Citation2017; Mwangi, Citation2015). Whereas, Alomari and Azzam (Citation2017), Dey et al. (Citation2015), (and Isayas (Citation2022) claimed the exact opposite. The positive link between bank size and profitability indicates that bigger banks typically make more money than smaller ones and vice versa. Therefore, economies of scale benefit larger banks.
2.5.3. Operating efficiency
Operational efficiency (OE) measures how well expenses are controlled by management. Previous research exhibited a negative and statistically significant effect of OE on profitability (Zafar et al., ; Trujillo-Ponce, 2012; Alexiou & Sofoklis, Citation2009; Athanasoglou et al., Citation2008). A higher cost-to-income ratio is related to a smaller net profit in a typical scenario because it signals less efficient operations, according to studies on the positive impact of operating efficiency on bank profit. Therefore, commercial banks with better expense control reported more earnings than those with less effective operational management.
2.5.4. Asset quality
Commercial banks generate income primarily via loans. The health of a bank’s loan portfolio directly impacts bank performance, and non-performing loans pose the greatest threat to financial institutions (Patwary & Tasneem, Citation2019). The likelihood of default is decreased since a rising economy produces enough resources for income production and development (Syed, Citation2020; Syed & Aidyngul, Citation2020). The empirical evidence for a link between AQ and banks’ profit is inconclusive.
Some studies revealed that AQ has a detrimental impact on the bank performance (Balango & Rao, Citation2017; Dang, Citation2011; Kingu et al., Citation2018; Olweny & Shipho, Citation2011; Patwary & Tasneem, Citation2019; Rozzani & Rahman, Citation2013). By contrast, Flamini et al. (Citation2009) found no statistically significant effect when investigating factors influencing bank profitability in sub-Saharan Africa.
2.5.5. Capital adequacy
A bank’s capital adequacy refers to the level of capital it has available to withstand the credit, market, and operational risks to which it is exposed, to absorb any potential losses, and to safeguard the bank’s creditors (Athanasoglou, Sophocles, & Matthaios, Citation2008). Thus, it indicates a bank’s internal strength, which bodes well for it in times of crisis. According to the NBE, a bank’s minimum allowable capital ratio is 8% of its risk-weighted assets. Empirical studies by Kaur (Citation2010), Sangmi and Nazir (Citation2010), Soni (Citation2012), and Rozzani and Rahman (Citation2013), and Rahman et al. (Citation2015) found that capital adequacy positively affected the bank’s performance. If capital adequacy and profitability are positively associated, banks with more significant capital take on riskier loans to increase profits. Instead, banks with relatively low capitalization levels were cautious about making loans, which harmed their profitability.
Based on the theoretical and empirical arguments put forth thus far, and as a result, it suggested the following hypothesis.
Hypothesis 1: Bank-specific factors has a statistically significant effect on Bank performance.
2.6. Industry-specific factors
A bank’s potential earnings are also heavily influenced by the structure of the banking industry. Several analyses have found that concentration ratios and market share, two measures of industry structure, are positively linked with firm profitability (Berger, Citation1995; Dietrich & Wanzenried, Citation2011; Dietrich & Wanzenried, Citation2014). On the other hand, Staikouras and Wood (Citation2003) found a statistically insignificant effect.
According to the available study, two distinct theoretical frameworks attempt to account for this connection (Goldberg & Rai, Citation1996; Yildirim & Mohanty, Citation2010; Yildirim & Philippatos, Citation2007). The first point of view, known as the SCP hypothesis, holds that banks participating in highly concentrated markets can impose pricing and levies less advantageous to customers due to the lack of competition. Banks can make monopoly profits through a wide spread between lending and deposit rates in a highly concentrated banking industry (Athanasoglou et al., Citation2008; Mizrahi et al., Citation2013). Therefore, the SCP hypothesis predicts that banks operating in highly concentrated markets will have better profits than those in less concentrated markets.
The second perspective is the ES hypothesis, which states that successful banks expand their operations and gain market share (Staikouras & Wood, Citation2003; Athanasoglou et al., Citation2008). There are many applications for the market share variable, but one of the most common is measuring the impact of market structure on banks’ profitability. In two studies, Karizmadeh et al. (Citation2013) and Growe et al. (Citation2014) found that a bank’s asset market share was positively related to its profitability. Growe et al. (Citation2014) counter that a large proportion of the deposit market suggests a bank uses more expensive capital sources, reducing profitability. According to the research of Belkhaoui et al. (Citation2014), deposits’ market share negatively affects bank performance, as evidenced by the fact that monopoly profits are more common in markets with high market concentration. The increases in market share achieved by more efficient banks were linked to a positive association between company earnings and market structures. Otherwise, it may affect the inefficient banks negatively. It also mediates the relationship between the bank’s activities and its profit. The study put out the following hypotheses in light of the justifications above.
Hypothesis 2: Bank-specific factors has a statistically significant effect on Industry specific factors.
Hypothesis 3: Industry-specific factors have a statistically significant effect on Bank performance.
Moreover, since the banking industry treats individual banks depending on their efficiency and activities, it mediates the link between the bank-specific factors and its profit. Therefore, the study proposed the following hypotheses.
Hypothesis 4: Industry-specific factors have a statistically significant mediating role in the relation between bank-specific factors and bank performance.
2.7. Macroeconomic variables
Macroeconomic factors that impact the operation and performance of banks are beyond management’s control.
2.7.1. Inflation
Increases in the pricing of goods and services over time are reflected in inflation. In addition, it shows how much a country’s currency is worth in the marketplace (Singh & Sharma, Citation2016). Whether or not inflation adversely affects a bank’s performance relies on whether or not the bank accurately predicts the rate of inflation. However, the results on how inflation affects bank profits are contradictory. Several researchers claimed a negative effect of inflation on bank performance (Boyd & Champ, Citation2006; Cetin, Citation2019; Mbabazize et al., Citation2020). In contrast, Guru et al. (Citation2002), Fadzlan (Citation2009), Miguel et al. (Citation2018), and Gilbert and Jaya (Citation2019), and Almansour et al. (Citation2021) posited the exact opposite result. The inverse relationship between inflation and bank profitability highlighted that unexpectedly high inflation rates deter saving and investment, which could negatively impact bank profits.
2.7.2. Exchange rate
When a bank has assets or liabilities denominated in a currency other than its base currency, it is exposed to foreign exchange risk, which can affect its profits and equity if the underlying currency value fluctuates. When this fluctuation occurs unexpectedly and unfavorably, it can harm a bank’s profits and resources. Empirical studies showed conflicting findings. For example, some studies claimed exchange rate has a detrimental effect on bank profits (Hasanov et al., Citation2018; Osuagwu, Citation2014; Topak & Talu, Citation2017). In contrast, a study by Laryea et al. (Citation2016) and Ozgur and Gorus (Citation2016) claim exchange rate has an insignificant effect on bank performance. In contrast to the previous two claims, Ghurtskaia (Citation2018) argue that the exchange rate positively impacts bank performance.
The positive impact of exchange rates on profitability suggests that banks with assets or liabilities heavily based on the base currency may have large profit margins. Inflation and exchange rate may have a favorable or unfavorable influence on individual bank-specific activities. Besides, it may affect the baking industry since it affects the industry in terms of asset share of the industry. Therefore, since it invades or enhances bank-specific factors such as liquidity, cost efficiency, asset quality, and industry-specific factors, the study proposes the following three hypotheses:
Hypothesis 5: Macroeconomic variables have a statistically significant effect on Bank performance.
Hypothesis 6: Macroeconomic variables have a statistically significant effect on Bank-specific factors.
Hypothesis 7: Macroeconomic variables have a statistically significant effect on Industry-specific factors.
2.8. Summary
Financial performance is crucial for all businesses, especially those in the banking sector because it directly affects the stability of commercial banks, which in turn has a significant impact on the overall health of the nation’s economy. The general theories in bank profitability have yet to demonstrate how to connect framework theories to the factors that affect bank profitability. Understanding the variables affecting the bank’s profitability is made more accessible by applying the market structure and banking efficiency theoretical perspective. Given these theoretical viewpoints, numerous empirical studies have tried to determine how internal (bank-specific) and external (industry- and macroeconomic-specific) factors affect banks’ performance.
2.9. Gap in literature
The bank-specific factors of banking profitability have been widely addressed in previous studies. However, they were unable to come to any firm conclusions. Furthermore, market structure, which aids in the analysis of market concentration (industry-specific determinants) as well as understanding its impact on bank profitability, was not taken into consideration by many studies. Additionally, the researcher discovered that earlier literature neglected the significance of the mediating role of industry-specific factors on the relationship between the bank-specific variable and bank performance. It is because the factors that determine banks’ performance are interconnected. This study extends the body of knowledge by including the mediating influence of this variable in empirical analysis.
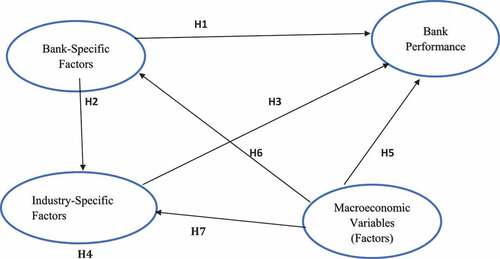
2.10. Conceptual model
The PLS-SEM analysis’s proposed hypotheses and variable correlations are depicted in a path model diagram. The model analysis was done in steps, as follows: (1) determining whether the model is reflective or formative; (2) using the measurement model (outer model), which highlights the connections between latent indicators and their variables; (3) using the structural (inner) model, which includes evaluating the connections between the latent variables; and (4) using PLS predict to assess the model’s predictive ability.
The conceptual framework enumerates the research hypotheses that this study set out to test (See, Figure ).
Figure 1. Conceptual model.
3. Methods
PLS-SEM is a second-generation data analysis method in structural equation modeling. The study followed an explanatory (causational) research design to explain the causal relationships between the variables. The two SEM subtypes are PLS-SEM and Covariance-Based (CB.) SEM (Hair et al. (Citation2017) PLS-SEM, a prediction-oriented method to SEM typically used for exploratory research but is also appropriate for confirmatory research, differs from the CB-SEM groups in that it is prediction-oriented (Henseler et al., Citation2014; Hair et al., Citation2017). On the other hand, PLS-SEM explains variance like ordinary least squares regression, but CB-SEM is a covariance-based method for hypothesis testing (Garson, Citation2016; Hair et al., Citation2017; Nitze, Citation2016).
Henseler et al. (Citation2014) claim that in the following circumstances, PLS-SEM excels as a substitute for CB-SEM: Small sample size; limited theory available for applications; emphasis on predictive accuracy; inability to guarantee correct model parameters. Furthermore, PLS-SEM is a soft modeling approach to SEM that makes no assumptions about the data distribution (Hair et al., Citation2017). In PLS-SEM, the indicators are often measured using the reflective and formative outer models. Secondary data sources are often not generated and maintained over time for confirmatory studies, in contrast to survey measures frequently built to support a well-developed theory (Sarstedt & Mooi, Citation2019). Therefore, when using CB-SEM, it is doubtful that a model fit using secondary data measures will be established in most study scenarios.
Researchers in marketing and other fields increasingly use the Gaussian copula technique without instrumental variables (IV; Becker et al., Citation2021). When estimating regression models with non-experimental data, studies used this technique to spot and correct endogeneity (Becker et al., Citation2021). The recently releasedSmartpls version 4 software in 2021 permits the use of the Gaussian copula technique; it provides PLS-SEM with the capabilities that can help researchers address endogeneity concerns. As a result, the study used PLS-SEM with the software SmartPLS 4.0.8.3 for empirical analysis.
3.1. Data and sample
The use of secondary data to study actual events is growing. The researchers gathered pertinent secondary data from the annual reports of every private commercial bank and the NBE. The unit of analysis for the present study is eleven private commercial banks from 2010–to 2021. The study sample size is 132 since it utilized data (11 private banks x 12 years = 132 observations) which is above the required sample size.
3.2. Research variables
Several important factors need to be considered in specifying an empirical model.
3.2.1. Dependent variable
In line with earlier studies, the study used ROA, ROE, and NIM to gauge bank performance (See ).
Table 1. Research variables and indicators
3.2.2. Independent variables
Explanatory variables were chosen for this study depending on how theoretically they related to the dependent variable. According to the research theory, firm size, liquidity, AQ, CA, and OE are used as bank-specific variables to determine bank performance in Ethiopia. In addition, the market share of assets, deposits, and loan advances are used as industry-specific variables, and exchange rate and inflation are used as macroeconomic variables (See ).
4. Results and discussion
The study’s objective is to analyze the determinants of commercial bank performance.
4.1. Measurement model evaluation
The evaluation aims to determine whether the manifest variables are reliable and consistent. Individual manifest and construct reliability tests are used to assess consistency, while convergent and discriminant validity tests assess the variables’ reliability (Hulland, Citation1999; Hair et al., Citation2017).
4.1.1. Indicators reliability
The percentage of indicator variance that the latent variable accounts for when determining indicator reliability range from 0 to 1 (Latan & Ghozali, Citation2013). The study employed a reflective construct for industry-specific factors and bank performance, whereas bank-specific factors and macroeconomic variables are formative constructs. Outer loading assessment is applicable only for reflective construct.
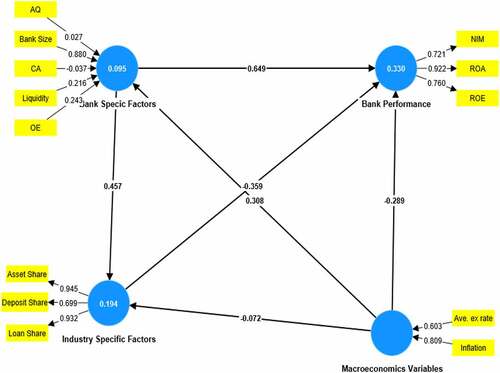
Keeps indicators with loadings between 0.40 and 0.7 if they help to boost composite reliability and average variance extracted (AVE), even though the outer loading value should be higher than 0.70 (Hulland, Citation1999; Hair et al., Citation2017). As seen in Figure , except for deposit share, all reflective construct is above 0.7.
Figure 2. PLS-SEM outer model.
4.1.2. Construct-level reliability
Cronbach alpha and composite reliability, which gauge reliability based on the interrelationship of the observed item variables, are the most used methods for determining internal consistence (Henseler et al., Citation2014; Garson, Citation2016). Composite reliability values between 0.60 and 0.70 are appropriate for exploratory research, but for further advanced stages, the value must be more than 0.70(Hair et al., Citation2017). The construct’s composite and Cronbach’s alpha values are above 0.7 (see, Table ), as Hair et al. (Citation2017) suggested, proving the model exhibits internal consistency.
Table 2. Assessment of loading and multicollinearity
Table 3. Construct reliability and validity
Table is not presented computed composite reliability and Cronbach alpha for bank-specific and macro variables. Because the positive and negative correlation among indicators and a high correlation are not allowed, the formative measurement model assessment procedure does not compute composite reliability and Cronbach alpha to measure internal consistency (Hair et al., Citation2014; Hair et al., Citation2017). To check the robustness of the indicator, it uses the correlation between one indicator and the other indicators in the same construct; If the measure has collinearity issues (VIF>5), it indicates a problem (Hair et al., Citation2014). As Table showed, the formative construct indicator VIF is less than 5; therefore, the indicators are robust.
4.1.3. Discriminant validity
Using the Fornell-Larcker criterion, discriminant validity is evaluated (Hair et al., Citation2017). Discriminant validity at the item level describes how much a particular construct stands out from other constructs in the model. At most, the average variance extracted (AVE) square root should be the inter-construct correlation values (Garson, Citation2016).
The study’s findings met the criteria for discriminant validity, as shown in Table , because all values below the diagonal cells are lower than those of the diagonal cells’ square roots. The Heterotrait-Monotrait ratio (HTMT) is another method for evaluating discriminant validity; the HTMT value should be at most 0.90. (Hair et al., Citation2014). The HTMT result, shown in Table , also demonstrated that the model fulfilled discriminant validity criteria.
Table 4. Discriminant validity of constructs
4.1.4. Convergent validity
The positive correlation between a measure and other measurements of the same variable is known as convergent validity (Hair et al., Citation2014). PLS-SEM analysis using smaller sample sizes has problems when convergent problems occur (Hair et al., Citation2017). AVE aimed to evaluate the convergent validity of the reflected measurement; the AVE values of the constructs should be more than 0.50 (Henseler et al., Citation2014). Therefore, as shown in Table , the model met the convergent validity criterion. Moreover, in a reflective construct, convergent validity is measured through AVE; however, in the case of a formative construct, it is measured using the correlation between one construct and another construct in the paths (inner-VIF) (Hair et al., Citation2014). As presented in Table , inner-VIF is less than 5, and the formative construct established convergent validity.
Table 5. PLS predict relevance
4.2. PLS-SEM structural model evaluation
Potential collinearity, coefficient of determination, effect size, and the significance of the path coefficients are evaluated, accordingly, during the structural model assessment in PLS-SEM (Lowry & Gaskin, Citation2014; Nitze, Citation2016).
4.2.1. Multi-collinearity
For the model to obtain convergent validity for formative construct in the paths and structural model robustness, the collinearity problem must be eliminated. The Variance Inflation Factor (VIF) should be lower than 5 (Kock & Lynn, Citation2012). The model has no collinearity problems (see outer VIF in Table & inner VIF in Table ).
Table 6. Path coefficients assessment
4.2.2. Coefficient of determination
A model with a coefficient of determination (R2) of 0.67, 0.3, or 0.19 is classified as strong, moderate, or weak, depending on how much variance in the endogenous constructs is explained by all of the exogenous constructs connected to it (Henseler et al., Citation2014; Hair et al., Citation2014). In light of this, Table shows that the R2 of the anticipated independent variables on the dependent variable is 0.33. As a result, the study model is above average, showing a good prediction accuracy level.
4.2.3. Effect size
According to the formula for the f2: = (R2 included—R2 excluded)/ (1- R2 included), the values of 0.02, 0.15, and 0.35 represent small, medium, and significant impacts, respectively (Henseler et al., Citation2014). Table demonstrates, except for the effect of industry-specific factors on bank performance, that every path has f2 values higher than a given minimum (0.02). All other f2 values are higher than 0.15; As a result, nearly every path has effect sizes larger than medium.
4.2.4. PLS predict
The PLS prediction technique aids in evaluating how predictively relevant the model is (Shmueli et al., Citation2015, Citation2019). Researchers can get summary data like the root mean squared error and k-fold cross-validated prediction errors using the SmartPLS PLS prediction algorithm (RMSE).
The prediction effectiveness of their PLS path models for the manifest variables (indicators) is measured by the mean absolute error (MAE) and the mean absolute percentage error (MAPE; Shmueli et al., Citation2015, Citation2019). The RMSE and MAE values of the PLS-SEM predictions are lower than those of the linear model (LM) benchmark values of indicators, and the Q2 prediction values are above zero (See, Table ). Since all Q2 values in this investigation are more significant than zero, the model has established predictive relevance.
4.2.5. Diagnosis of path coefficients
For a unit change in the exogenous construct, the path coefficients show the estimated change in the endogenous construct. In the structural model, PLS-SEM seeks to discover significant path coefficients and appropriate directions of effects (Garson, Citation2016). The process generates several predetermined bootstrap samples; a 5,000 resample is advised. The bootstrap sample allows for checking the significance of paths (Hair et al., Citation2017).
Before checking the significance of paths, the study checked whether there was an endogeneity problem in the model. When estimating models, the studies can use the Gaussian copula (GC) technique to detect and correct endogeneity issues (Becker et al., Citation2021). Since smartpls version 4 allows the use of the GC technique, the study checked the presence of endogeneity. Table in the appendix shows that all the paths GC test is not statistically significant. Therefore, all paths in the model are free from the endogeneity problem.
Table shows that macroeconomics variables (P = 0.024; β = −0.164) and industry-specific factors (P = 0.000; β = −0.359) have a statistically significant negative effect on Bank performance. On the other hand, bank-specific factors have a statistically significant positive effect on bank performance (P = 0.002; β = 0.649). Additionally, the bank-specific factor has a statistically significant positive effect on the industry-specific factor (P = 0.002; β = 0.461). However, macroeconomic variables have no statistically significant effect on the bank and industry-specific factors.
The effect of independent variables on dependent variables through a third variable called mediation, this variable named mediating variable (Preacher & Hayes, Citation2008). Table further demonstrated that industry-specific variables have a solid and unfavorable function in mediating the indirect effect of bank-specific factors on bank performance. (P = 0.024; β = −0.164).
5. Discussion
A thorough investigation of the effect of bank, industry, and macro-specific variables on bank performance is an important research topic in the growing literature on bank performance. As a result, this study explores the causal link between bank industry-, bank-, and macro-specific variables and bank performance.
5.1. Bank-specific factors and bank performance
According to the study, bank-specific factors have a statistically significant positive effect on bank performance. The result shows that an increase in bank-specific factors (liquidity, bank size, OE, AQ, and CA) leads to an increase in bank performance. The positive effect of liquidity indicates that the higher share of deposit to total asset ratio, the higher the bank’s profit. This finding corroborates the findings of Isayas (Citation2022), who found a positive liquidity effect on bank performance. Nevertheless, in contrast, studies found a negative effect of liquidity on bank performance (Chandani et al., Citation2014; Jha & Hui, Citation2012; Venkatesh & Suresh, Citation2014).
Besides, the study finding revealed a positive effect of bank size on bank profit; it indicates that an increase in the size of an asset increases the bank profit. It contradicts studies that found bank size’s negative effect on bank profitability (Mazviona et al., Citation2017; Mwangi, Citation2015). In contrast, it supports Alomari and Azzam (Citation2017), Dey et al. (Citation2015), and Isayas (Citation2022), who found a positive effect of bank size on bank performance. Moreover, the study proved that operational efficiency (OE) positively affects bank profit, which indicates that the management is good at reducing the operating cost-to-income ratio, which fosters the bank’s performance.
The study finding is inconsistent with studies that found a negative effect of OE on the bank performance (Alexiou & Sofoklis, Citation2009; Athanasoglou et al., Citation2008). The positive effect of AQ on the banks’ profitability shows that the banks are working well in reducing the share of non-performing loans, leading to a higher bank profit. Banks with better management practices have fewer non-performing loans than inefficient banks, which supports the wrong management hypothesis (Syed, Citation2020; Syed & Aidyngul, Citation2020). Moreover, The study finding is not corroborated studies that found a detrimental effect of AQ on the bank performance (Balango & Rao, Citation2017; Dang, Citation2011; Kingu et al., Citation2018; Olweny & Shipho, Citation2011; Patwary & Tasneem, Citation2019; Rozzani & Rahman, Citation2013). It is also odd that Flamini et al. (Citation2009) found no statistically significant effect. On the other hand, the study’s findings showed that CA positively affects the bank’s profitability, which means an increase in the share of capital to asset ratio increases the bank’s profit. This finding support studies that found that CA positively affects bank performance Kaur (Citation2010); Sangmi and Nazir (Citation2010); Soni (Citation2012); Rozzani and Rahman (Citation2013); Rahman et al. (Citation2015).
5.2. Industry-specific factors and bank performance
According to the study, industry-specific factors have a statistically significant detrimental impact on bank performance. The result shows that an increase in industry-specific factors (market share of an asset, deposit, and loan advances) leads to a decrease in bank performance. Banks have wildly different capital and market share levels, leading to imperfect competition because it allows a small number of banks to dominate the sector.
The finding on the negative effect of deposit or asset market share on banks’ profits reveals that there is no market monopoly in the private banks in Ethiopia. Though Ethiopia has one government-owned commercial bank, this study finding may differ if the study includes the government-owned bank named Commercial bank of Ethiopia (CBE). The big Ethiopian banking giant CBE enjoys an almost 62% market share in assets and deposits.
The study finding is consistent with Growe et al. (Citation2014), who found that deposit market share has a detrimental effect on bank performance. It also validated studies that found market concentration harms bank profit (Chortareas et al., Citation2011; Mahathanaseth & Tauer, Citation2012; Van Leuvensteijn et al., Citation2011). However, it is inconsistent with studies that found that concentration ratios and market share are positively linked with firm profitability (Berger, Citation1995; Dietrich & Wanzenried, Citation2011, Citation2014). Furthermore, Staikouras and Wood (Citation2003) found a statistically insignificant effect. In addition, it is inconsistent with a study by Karizmadeh et al. (Citation2013) and Growe et al. (Citation2014), who found that a bank’s asset market share positively affects bank performance. It is also odd with Belkhaoui et al. (Citation2014), who found that deposit market share positively affects bank performance.
On the other hand, the study found that bank-specific factors positively affect the banking industry. Since banks in Ethiopia are few relative to the country’s demand for this sector and the absence of foreign banks, individual banks’ endeavors can enhance the banking sector. Finally, the banking industry has a negative mediation role in the indirect effect of bank-specific factors on bank performance. This negative mediation may be due to the huge CBE holding more than half of the market share and the private bank competing with the remnant market.
5.3. Macroeconomic variables and bank performance
The study revealed macro-specific factors’ statistically significant detrimental effects on bank performance. The result shows that an increase in macro-specific factors (exchange rate and inflation) leads to decreased bank performance. Likely, fluctuations in foreign exchange rates (such as those affecting the value of the Ethiopian Birr relative to the US dollar) could negatively affect bank performance. Additionally, the increasing inflation rate in Ethiopia could hinder bank profitability.
The study supports studies that found that the exchange rate negatively affects bank performance (Hasanov et al., Citation2018; Osuagwu, Citation2014; Topak & Talu, Citation2017). It contradicts Ghurtskaia (Citation2018), who argue that the exchange rate positively impacts bank performance. It is also odd to a study by Laryea et al. (Citation2016) and Ozgur and Gorus (Citation2016), who found that the exchange rate has an insignificant effect on bank performance. On the other hand, the study finding is consistent with studies that found inflation’s negative effect on the bank performance (Boyd & Champ, Citation2006; Cetin, Citation2019; Mbabazize et al., Citation2020). However, it contradicts Guru et al. (Citation2002), Fadzlan (Citation2009), Miguel et al. (Citation2018), Gilbert and Jaya (Citation2019), and Almansour et al. (Citation2021), who found a positive effect of inflation on bank performance.
6. Conclusion
The study rationale of the study is to examine the determinants of private bank performance in Ethiopia using panel data from 11 private banks from 2010–2021. For analysis, the study used PLS-SEM with SmartPLS 4.0.8.3 software. The study developed seven hypotheses based on the extant literature review. Out of seven proposed hypotheses, the study confirmed that all are statistically significant except for hypotheses 6 & 7.
The study finding indicated that industry-specific factors have a negative statistically significant effect on bank performance. Besides, the macroeconomic variables have a negative statistically significant effect on bank performance. It is because changes and fluctuations in foreign currency exchange rates may have an unfavorable effect on bank performance. Additionally, Ethiopia’s rising inflation rate is worsening the bank’s performance. One of the leading causes of the shockingly high inflation rates might be the ongoing devaluation of the local currency. Contrarily, bank-specific factors have a positive statistical effect on bank performance and the banking industry, respectively, because of banks’ efforts to improve both their performance and the performance of the banking sector as a whole. However, it does not have a significant effect on a macroeconomic variable. Industry-specific factors have no statistically significant effect on macro-specific factors.
Ethiopian private commercial banks’ profitability is significantly influenced by liquidity and managerial effectiveness. The managers and analysts should work to control the operating expense and liquidity levels correctly. The size of the banks can also be increased to increase profitability. Thus, there is a chance that economies of scale will benefit banks. Moreover, the capital structure also offers profit. Therefore, investors and bank management should develop a high capital-to-asset ratio. The study urges, to avert the adverse effect emanating from the industry, the civic society and regulatory body (NBE) to pressure the government to dismantle CBE in many different banks since it makes the market unfair by holding more than half of the banking industry. Besides, the government, NBE, and the policy maker should promote private banks to increase their market share. Additionally, they need a mechanism to encourage the entry of foreign banks because they might bring in cutting-edge business techniques and procedures and boost the competitive environment in the country’s banking industry.
The study’s use of PLS-SEM techniques, which make it possible to measure indirect effects, and the IV GC procedure to avoid endogeneity problems are some of its strengths. The study, however, has a flaw because it only examined private commercial banks from 2010 to 2021. Additionally, the study employed only two macroeconomic indicators: inflation and the average exchange rate. Future studies on this subject should harness a mixed-methods strategy that uses quantitative and qualitative research studies, as qualitative data helps triangulate the quantitative findings.
Disclosure statement
No potential conflict of interest was reported by the author(s).
Additional information
Funding
Notes on contributors
Million Adafre Bushashe
Million Adafre Bushashe is a Lecturer at the Department of Management, Mizan-Tepi University, Ethiopia. He has BA in Management and a Master’s degree in Business Administration, and a PhD. Candidate in Public Policy and Management at Addis Ababa University. His research interest is in a broad area of finance, economic stability and business management.
References
- Abdu, E. (2022). Financial distress situation of financial sectors in Ethiopia: A review paper. Cogent Economics & Finance, 10(1), 1. https://doi.org/10.1080/23322039.2021.1996020
- Aburime, T. U. (2008). Determinants of bank profitability: Company-level evidence from Nigeria. SSRN Electronic Journal. https://doi.org/10.2139/ssrn.1106825
- Alexiou, C., & Sofoklis, V. (2009). Determinants of bank profitability: Evidence from the Greek banking sector. Economic Annals, 54(182), 93–22. https://doi.org/10.2298/EKA0982093A
- Almansour, A. Y., Alzoubi, H. M., Almansour, B. Y., & Almansour, Y. M. (2021). The effect of inflation on performance: An empirical investigation on the banking sector in Jordan. Journal of Asian Finance, Economics, and Business, 8(6), 0097–0102. https://doi.org/10.13106/jafeb.2021.vol8.no6.0097
- Alomari, M., & Azzam, I. (2017). Effect of the micro and macro factors on the performance of the listed Jordanian insurance companies. International Journal of Business and Social Science, 8(2), 66–73.
- Athanasoglou, P., Brissimis, S., & Delis, M. (2008). Bank-specific, industry-specific and macroeconomic determinants of bank profitability. Journal of International Financial Markets, Institutions, and Money, 18(2), 121–136. https://doi.org/10.1016/j.intfin.2006.07.001
- Balango, T., & Rao, K. (2017). The effect of NPL on banks’ profitability with reference to Ethiopia’s commercial bank. Business and Management Research Journal, 7(5), 45–50.
- Becker, J., Proksch, D., & Ringle, C. M. (2021). Revisiting Gaussian copulas to handle endogenous regressors. Journal of the Academy of Marketing Science, 50(1), 46–66. https://doi.org/10.1007/s11747-021-00805-y
- Belkhaoui, S., Lakhal, L., Lakhal, F., & Hellara, S. (2014). Market structure, strategic choices and bank performance: A path model. Managerial Finance, 40(6), 538–564. https://doi.org/10.1108/MF-07-2013-0183
- Berger, A. (1995). The profit structure relationship in banking: Tests of market power and efficient structure hypotheses. Journal of Money, Credit, and Banking, 27(2), 404–431. https://doi.org/10.2307/2077876
- Berger, A. N., Demirguc-Kunt, A., Levine, R., & Haubrich, J. G. (2004). Bank concentration and competition: An evolution in the making. Journal of Money, Credit, and Banking, 36(3b), 433–451. https://doi.org/10.1353/mcb.2004.0040
- Bikker, J., & Spierdijk, L. (2017). Handbook of competition in banking and finance. https://doi.org/10.4337/9781785363306
- Boyd, J. H., & Champ, B. (2006). Inflation and financial market performance: What have we learned in the last ten years? Working paper (Federal Reserve Bank of Cleveland). https://doi.org/10.26509/frbc-wp-200317
- Cetin, H. (2019). Inflation and bank profitability: G20 countries banks panel data analysis. In Phuket, Thailand: 2019 international conference on management science and industrial engineering (pp. 168–172). Association for Computing Machinery.
- Chandani, A., Mehta, M., & Chandrasekaran, K. B. (2014). A working paper on the impact of gender of leader on the bank’s financial performance: A case of ICICI bank. Procedia Economics and Finance, 11, 459–471. https://doi.org/10.1016/S2212-5671(14)00212-3
- Choi, B. P., & Weiss, M. A. (2005). An empirical investigation of market structure, efficiency, and performance in property-liability insurance. Journal of Risk and Insurance, 72(4), 635–673. https://doi.org/10.1111/j.1539-6975.2005.00142.x
- Chortareas, G. E., Garza-Garcia, J. G., & Girardone, C. (2011). Banking sector performance in Latin America: Market power versus efficiency. Review of Development Economics, 15(2), 307–325. https://doi.org/10.1111/j.1467-9361.2011.00610.x
- Dang, U. (2011). The CAMEL rating system in banking supervision: A case study of Arcada. University of Applied Sciences, International Business.
- Dey, N., Adhikari, K., & Bardhan, R. (2015). Factors determining the financial performance of life insurance companies of India: An empirical study. EPRA International Journal of Economic and Business Review, 3(8), 42–48.
- Dietrich, A., & Wanzenried, G. (2011). Determinants of bank profitability before and during the crisis: Evidence from Switzerland. Journal of International Financial Markets, Institutions & Money, 21(3), 307–327. https://doi.org/10.1016/j.intfin.2010.11.002
- Dietrich, A., & Wanzenried, G. (2014). The determinants of commercial banking profitability in low-, middle-, and high-income countries. The Quarterly Review of Economics and Finance, 54(3), 337–354. https://doi.org/10.1016/j.qref.2014.03.001
- Fadzlan, S. (2009). Determinants of bank profitability in a developing economy: Empirical evidence from the China banking sector. Journal of Asia-Pacific Business, 10(4), 201–307. https://doi.org/10.1080/10599230903340205
- Flamini, V., McDonald, C. A., & Schumacher, L. (2009). The determinants of commercial bank profitability in sub-Saharan Africa. SSRN Electronic Journal, 09(15), 1. https://doi.org/10.5089/9781451871623.001
- Garson, G. (2016). Partial least squares regression and structural equation models. Statistical Associates.
- Geda, A. (2008). The structure and performance of Ethiopia’s financial sector in the pre-and post-reform periods, with a special focus on banking. Domestic Resource Mobilization and Financial Development, 163–202. https://doi.org/10.1057/9780230594012_8
- Ghazouani, I., & Moussa, S. 2013 Explanatory factors of bank performance: Evidence from Tunisia. International Journal of Economics, Finance, and Management, 12(l).
- Ghurtskaia, K. (2018). Macroeconomic determinants of bank profitability: Evidence from Georgia. Ecoforum Journal, 7, 3.
- Gilbert, B., & Jaya, S. (2019). Inflation and profitability of commercial banks in Rwanda: A case study of bank of Kigali. International Journal of Business and Management, 14(10), 35–43. https://doi.org/10.5539/ijbm.v14n10p35
- Goldberg, L. G., & Rai, A. (1996). The structure-performance relationship for European banking. Journal of Banking & Finance, 20(4), 745–771. https://doi.org/10.1016/0378-4266(95
- Growe, G., DeBruine, M., Lee, J. Y., & Tudón Maldonado, J. F. (2014). The profitability and performance measurement of US regional banks using the predictive focus of the “Fundamental analysis research.” advances in Management Accounting, 24,189-237. https://doi.org/10.1108/s1474-787120140000024006
- Guru, B., Staunton, J., & Balasingham, B. (2002). Determinant of commercial bank profitability in Malaysia. Sydney: 12th Annual Australian Finance and Banking Conference.
- Hair, J. F., Hult, G. T. M., Ringle, C. M., & Sarstedt, M. (2017). A primer on partial least squares structural equation modeling (PLS-SEM). Sage.
- Hair, J. F., Sarstedt, M., Hopkins, L., & Kuppelwieser, G. (2014). Partial least squares structural equation modeling (PLS-SEM). European Business Review, 26(2), 106–121. https://doi.org/10.1108/ebr-10-2013-0128
- Hasanov, F., Bayramli, N., & Al-Musehel, N. (2018). Bank-specific and macroeconomic determinants of bank profitability: Evidence from an oil-dependent economy. International Journal of Financial Studies, 6(3), 78. https://doi.org/10.3390/ijfs6030078
- Henseler, J., Ringle, C. M., & Sarstedt, M. (2014). A new criterion for assessing discriminant validity in variance-based structural equation modeling. Journal of the Academy of Marketing Science, 43(1), 115–135.
- Hulland, J. (1999). Use of partial least squares (PLS) in strategic management research: A review of four recent studies. Strategic Management Journal, 20(2), 195–204. https://doi.org/10.1002/(SICI)1097-0266(199902)20:2<195::AID-SMJ13>3.0.CO;2-7
- Ijara, T. M., & Sharma, D. (2020). The efficiency of Ethiopian commercial banks: Using data envelopment analysis. American J. of Finance and Accounting, 6(2), 171. https://doi.org/10.1504/ajfa.2020.110326
- Isayas, Y. N. (2022). Determinants of banks’ profitability: Empirical evidence from banks in Ethiopia. Cogent Economics & Finance, 10((1)). https://doi.org/10.1080/23322039.2022.2031433
- Jha, S., & Hui, X. (2012). A comparison of financial performance of commercial banks: A case study of Nepal. African Journal of Business Management, 6(25), 7601–7611. https://doi.org/10.5897/AJBM11
- Karizmadeh, M., Akhtar, J., & Karizmadeh, B. (2013). Determinants of profitability of banking sector in India. Transition Studies Review, 20(2), 211–219. https://doi.org/10.1007/s11300-013-0284-4
- Kaur, H. V. (2010). Analysis of banks in India - A CAMEL approach. Global Business Review, 11(2), 257–280. https://doi.org/10.1177/097215091001100209
- Kingu, P., Macha, D., & Gwahula, D. (2018). Impact of non-performing loans on bank’s profitability: Empirical evidence from commercial banks in Tanzania. International Journal of Scientific Research and Management, 6(1), 71–79. https://doi.org/10.18535/ijsrm/v6i1.em11
- Kock, N., & Lynn, G. (2012). Lateral collinearity and misleading results in variance-based SEM: An illustration and recommendations. Journal of the Association for Information Systems, 13(7), 546–580. https://doi.org/10.17705/1jais.00302
- Laryea, E., Now-Gyamfi, M., & Alu, A. A. (2016). Non-performing loans and bank profitability: Evidence from an emerging market. African Journal of Economic and Management Studies, 7(4), 462–481. https://doi.org/10.1108/AJEMS-07-2015-0088
- Latan, H., & Ghozali, I. (2013). Partial least squares: Concept and application path modelling using program XLSTAT-PLS. Badan Penerbit Universitas Diponegoro.
- Lowry, P. B., & Gaskin, J. (2014). Partial least squares (PLS) structural equation modeling (SEM) for building and testing causal behavioral theory: When to choose it and how to use it. IEEE Transactions on Professional Communication, 57(2), 123–146. https://doi.org/10.1109/tpc.2014.2312452
- Mahathanaseth, I., & Tauer, L. W. (2012). Market-power versus cost-efficiency in Thailand’s banking sector post-crisis period (1998–2011). Journal of Asian Economics, 23(5), 499–506. https://doi.org/10.1016/j.asieco.2012.06.002
- Mazviona, B. W., Dube, M., & Sakahuhwa, T. (2017). An analysis of factors affecting the performance of insurance companies in Zimbabwe. Journal of Finance and Investment Analysis, 6(1), 1–21.
- Mbabazize, R. N., Turyareeba, D., Ainomugisha, P., & Rumanzi, P. (2020). Monetary policy and profitability of commercial banks in Uganda. Open Journal of Applied Sciences, 10(10), 625–653. https://doi.org/10.4236/ojapps.2020.1010044
- Miguel, Á. T.-Z., Martínez, F. V., & Preciado, V. H. T. (2018). Effects of inflation on financial sector performance: New evidence from panel quantile regressions. Investigación Económica, LXXVII(303), 94–129. https://doi.org/10.22201/fe.01851667p.2018.303.64156
- Mizrahi, A., Moore, T., & Liu, G. (2013). Does market structure matter on banks’ profitability and stability? Emerging vs advanced economies. Journal of Banking and Finance, 37(29), 20–37.
- Munyambonera, E. F. (2013). Determinants of commercial bank profitability in sub-Saharan Africa. International Journal of Economics and Finance, 5((9).). https://doi.org/10.5539/ijef.v5n9p134
- Mwangi, M. (2015). The determinants of financial performance in general insurance companies in Kenya. 11(1), 288–297.
- Nitze, C. (2016). The use of partial least squares structural equation modeling (PLS-SEM) in management accounting research: Directions for future theory development. Journal of Accounting Literature, Pp, 37(1), 19–35. https://doi.org/10.1016/j.acclit.2016.09.003
- Obamuyi, T. M. (2013). Determinants of banks’ profitability in a developing economy: Evidence from Nigeria. Organizations and Markets in Emerging Economies, 4(2), 97–111. https://doi.org/10.15388/omee.2013.4.2.14251
- Okoth, V., & Gemechu, B. (2013). Determinants of financial performance of commercial banks in Kenya. International Journal of Economics and Financial, 3(1).
- Olweny, T., & Shipho, T. M. (2011). Effects of banking sectoral factors on the profitability of commercial banks in Kenya. Economics and Finance Review, 1(5), 1–30.
- Osuagwu, E. (2014). Determinants of bank profitability in Nigeria. International Journal of Economics and Finance, 6(12), 12. https://doi.org/10.5539/ijef.v6n12p46
- Ozgur, O., & Gorus, M. S. (2016). Determinants of deposit bank profitability: Evidence from Turkey. Journal of Applied Economics and Business Research, 6(3), 218–231.
- Patwary & Tasneem. (2019). Impact of non-performing loan on the profitability of banks in Bangladesh: A study from 1997 to 2017. Global Journal of Management and Business Research: C Finance, 19(1), 13–27.
- Preacher, K. J., & Hayes, A. F. (2008). Asymptotic and resampling strategies for assessing and comparing indirect effects in multiple mediator models. Behavior Research Methods, 40(3), 879–891. https://doi.org/10.3758/brm.40.3.879
- Rahman, M. M., Hamid, M. K., & Khan, M. A. M. (2015). Determinants of bank profitability: Empirical evidence from Bangladesh. International Journal of Business and Management, 10(8), 135–149. https://doi.org/10.5539/ijbm.v10n8p135
- Rozzani, N., & Rahman, R. A. (2013). Camels and performance evaluation of banks in Malaysia: Conventional versus Islamic. Journal of Islamic Finance and Business Research, 2(1), 36–45.
- Sangmi, M., & Nazir, T. (2010). Analyzing financial performance of commercial banks in India: Application of CAMEL model. Pakistan Journal Commercial Social Sciences, 1(2010), 1–10.
- Sarstedt, M., & Mooi, E. A. (2019). A concise guide to market research: The process, data, and methods using IBM SPSS statistics. Springer.
- Shmueli, G., Ray, S., Velasquez Estrada, J. M., & Chatla, S. (2015). The elephant in the room: Evaluating the predictive performance of partial least squares (PLS) path models. SSRN Electronic Journal. https://doi.org/10.2139/ssrn.2659233
- Shmueli, G., Sarstedt, M., Hair, J. F., Cheah, J., Ting, H., Vaithilingam, S., & Ringle, C. M. (2019). Predictive model assessment in PLS-SEM: Guidelines for using PLSpredict. European Journal of Marketing, 53(11), 2322–2347. https://doi.org/10.1108/ejm-02-2019-0189
- Singh, A., & Sharma, A. K. (2016). An empirical analysis of macroeconomic and bank-specific factors affecting the liquidity of Indian banks. Future Business Journal, 2(1), 40–53. https://doi.org/10.1016/j.fbj.2016.01.001
- Smirlock, M. (1985). Seasonality and bond market returns. The Journal of Portfolio Management, 11(3), 42–44. https://doi.org/10.3905/jpm.1985.409009
- Soni, R. (2012). Applicability of CAMELS rating for supervisory regulation of the Indian banking system. Vishwakarma Business Review, 2(2), 14–20.
- Staikouras, C., & Wood, G. (2003). The determinants of European bank profitability. International Business and Economics Research Journal, 3(6), 57–68.
- Syed, A. A. (2020). Does banking efficiency, regulation, and operations affect banking performance in South Asia: Dynamic correlated model approach. Frontiers in Applied Mathematics and Statistics, P. 6, 6. https://doi.org/10.3389/fams.2020.00038
- Syed, A. A., & Aidyngul, Y. (2020). Macroeconomic and bank‐specific vulnerabilities of non-performing loans: A comparative analysis of developed and developing countries. Journal of Public Affairs. https://doi.org/10.1002/pa.2414
- Syed, A. A., Kamal, M. A., Grima, S., & Ullah, A. (2022). The impact of financial development and macroeconomic fundamentals on Non-performing loans among emerging countries: An assessment using the NARDL approach. Computation, 10(10), 182. https://doi.org/10.3390/computation10100182
- Tan, Y., & Floros, C. (2012). Bank profitability and inflation: The case of China. Journal of Economic Studies, 39(6), 675–696. https://doi.org/10.1108/01443581211274610
- Topak, M. S., & Talu, N. H. (2017). Bank specific and macroeconomic determinants of bank profitability: Evidence from Turkey. International Journal of Economics and Financial Issues, 7(2), 574–584.
- Van Leuvensteijn, M., Bikker, J. A., Van Rixtel, A. A., & Sørensen, C. K. (2011). A new approach to measuring competition in the loan markets of the euro area. Applied Economics, 43(23), 3155–3167. https://doi.org/10.1080/00036840903493234
- Venkatesh, J., & Suresh, C. (2014). Comparative performance evaluation of selected commercial banks in the kingdom of Bahrain using the CAMELS method. SSRN Electronic Journal, 1–32. https://doi.org/10.2139/ssrn.2418144
- Yildirim, H., & Mohanty, S. (2010). Geographical deregulation and competition in the US banking industry. Financial Markets, Institutions, and Instruments, 9(2), 63–94. https://doi.org/10.1111/j.1468-0416.2010.00155.x
- Yildirim, H., & Philippatos, G. (2007). Competition and contestability in Central and Eastern European banking markets. Managerial Finance, 33(3), 195–209. https://doi.org/10.1108/03074350710718275
Appendix
Table A1. Gaussian Copula (GC) Test