
Abstract
Worldwide governments are launching e-government (E-Gov) systems to ensure the superior delivery of services to their citizens. Ensuring the success of government-to-citizen (G2C), E-Gov systems is still challenging for various developing countries. To overcome this challenge, investigating the success of G2C E-Gov systems is important. This paper assesses the success of E-Gov systems from the perspective of a developing country. For this purpose, this research incorporates perceived-usefulness and perceived-trust variables into DeLone and McLean’s IS success model. A survey-based method was employed to collect data from Pakistani citizens. The PLS-SEM method was used for the validation of the conceptual model. Using the non-probability sampling technique, a sample of 264 usable cases was collected and used to analyze our model. It is evident from the outcomes of the study that information-quality has significant effects on the use of E-Gov and user-satisfaction, while service-quality, system-quality, and perceived-trust have significant effects on the use of E-Gov, user-satisfaction and perceived-usefulness. Further, the use of E-Gov, perceived-usefulness, and user-satisfaction have direct, significant impacts on the perceived-net-benefits. The practitioners are recommended to concentrate on the three quality dimensions i.e. information quality, system quality, and service quality while preparing E-Gov applications. The role of governments is also important to launch awareness campaigns and motivate their citizens to use E-Gov services.
1. Introductions
With the current advancements in Information and Communication Technology (ICT), a trend of governments offering online amenities to citizens has emerged (Lallmahomed et al., Citation2017). The use of modern internet and communication technologies by governments to dispense services and information to citizens and stakeholders is known as E-Gov. E-Gov is one of the critical features of modern governments; it enhances transparency and good governance (M. Rehman et al., Citation2016). E-governance enhances the efficiency of the government by providing better accessibility and connectivity (Lallmahomed et al., Citation2017; Sun et al., Citation2015). The use of E-Gov (UEG) plays a vital role in streamlining the interactions between citizens and governments. It provides easy access to information, nurtures transparency, and improves citizens’ participation in government services (Alcaide–Muñoz et al., Citation2017). Despite heavy investments in E-Gov projects, developing countries are facing challenges in the espousal of E-Gov services. E-Gov projects will only be successful if the citizens are willing to use E-Gov services (Shareef et al., Citation2011). Moreover, with new developments in technology, sustainable development is a global issue. The role of E-Gov in attaining sustainable development is important (Zahid & Din, Citation2019). Researchers in the research and development departments of various firms are working to enhance ICT use to achieve a sustainable competitive advantage (Dale Stoel & Muhanna, Citation2009).
Previous research has studied E-Gov adoption, however, only a few studies have addressed the success of E-Gov (Al-Rahmi et al., Citation2022). There is a need for further research to propose and validate a precise model to describe the success of E-Gov (Dwivedi et al., Citation2011). Similarly, Rasool et al., (Citation2020) admits that further research is needed on E-Gov generally and specifically about the information quality of E-Gov services. likewise, very little attention has been paid to the trust element as an antecedent that impacts the usefulness, satisfaction, and use of E-Gov (Hooda et al., Citation2022). In the same way (Shareef et al., Citation2011; Weerakkody et al., Citation2016; Zahid & Din, Citation2019) have mentioned the lack of interest of citizens in E-Gov services which needs to be addressed to raise the awareness level and for the success of the E-Gov system.
The study also addressed the contextual perspective, because, in several countries, stakeholders are unaware of E-Gov services, and as a result, they cannot support the adoption of these services (Shareef et al., Citation2011). So, there is considerable room for further research on E-Gov espousal (Clemes et al., Citation2014; Lallmahomed et al., Citation2017). Additionally, a literature review concerning the E-Gov espousal of developing countries leads us to the fact that the appraisal of the moderating role of citizens’ awareness on the relationship between the use of E-Gov services and the perceived-net-benefits is also a somewhat neglected area (Lallmahomed et al., Citation2017; Malik et al., Citation2016; Rasool et al., Citation2020; Stefanovic et al., Citation2016; Zahid & Din, Citation2019). To address the aforementioned issues, it is necessary to propose a wide-ranging E-Gov-success model that can be used to evaluate the awareness level of citizens.
To fill this research gap, a validated model is presented by this study by employing structural equation modeling (SEM) to appraise the success of E-Gov in the context of a developing country. Using this framework, an assessment of the success of E-Gov services in Pakistan is conducted. Furthermore, this study examines the moderating role of perceived awareness (PA) on E-Gov services and the perceived net benefits relationship.
This study extends the E-Gov literature by offering an extended framework that better explains the success of G2C E-Gov systems. (Venkatesh et al., Citation2011) considers such an integration of various factors into such a framework, critical for the evolution of science. It opens up opportunities for upcoming research to consider other determinants in the proposed model of this study, allowing the inspection of the accomplishment of information systems in the perspectives of E-Gov and other contexts.
The remaining paper is structured as follows. First, we review some background information concerning E-Gov and the development of the framework. Based on prior research, a proposed framework is presented, and the corresponding hypotheses are proposed. Second, the methods, measurement items, and results of data analysis are presented. Third, discussions and conclusions based on the findings of the research, the theoretical and practical implications, limitations, and forthcoming work are discussed.
2. Background and development of framework
2.1. E-gov services in Pakistan
The role of technology in public sector development is important; it may aid or obstruct sustainability (Larsson & Grönlund, Citation2014). In developing countries, establishing an E-Gov is complicated and difficult (Deng et al., Citation2018). The reasons for this difficulty are poor ICT infrastructure, low standards of living, and large rural populations (AlKalbani, Deng & Kam, Citation2015; NITB, Pakistan, Citationxxxx).
To automate government functions and promote an e-governance culture in the country, the Pakistani government established the National Information Technology Board (NITB) in August 2014 by amalgamating the Pakistan Computer Bureau (PCB) and the Electronic Government Directorate (EGD) (“NITB, Pakistan”). According to the latest study by the UN, the E-Gov index for Pakistan is 0.36; it has the lowest E-Gov index in the south Asian region (U. Nations, Citation2018). In terms of E-Gov implementation, Pakistan is facing two types of challenges, namely policy-level challenges (e.g., institutional, financial, and regulatory policies) and challenges related to a lack of infrastructure (e.g., inadequate information and telecommunication infrastructure; Rasool et al., Citation2020). Only 35% of the population in Pakistan has internet access; indicating that 65% of the people are unaware of digital government services (Stats, Citation2020). According to (Shareef et al., Citation2011), citizens’ intentions of E-Gov acceptance are based on their awareness of these services. Pakistan is facing the challenges of low internet penetration and a low literacy-rate due to which the acceptance of E-Gov services is lower (Rasool et al., Citation2020). Keeping these facts in mind, researchers need to study the determinants that play a vital role in the success of E-Gov and to research the moderating impact of citizens’ awareness on their espousal of E-Gov amenities.
2.2. DeLone and McLean’s is success model (D&M model)
To explore the essential factors of E-Gov success, researchers have employed several models. Prior research has widely used the D&M model to assess the success of E-Gov and suggested further investigation of the information systems (ISs) success using the D&M model (Al-Rahmi et al., Citation2022; Rana et al., Citation2014; M. Rehman et al., Citation2016; Stefanovic et al., Citation2016; Teo et al., Citation2008; Veeramootoo et al., Citation2018; Wang & Liao, Citation2008). The D&M model was first presented in 1992. It contained six independent variables: system quality (SYSQ), information quality (INFQ), user satisfaction (USAT), use, organizational impact, and individual impact (DeLone & McLean, Citation1992). The creators of the D&M model presented a revised model with an additional variable, the service quality (SERQ), and merged the organizational impact and individual-impact variables into one variable called net benefits. The updated model includes six variables, namely SYSQ, INFQ, SERQ, intention to use/use, USAT, and net benefits. Researchers have employed the updated D&M model broadly for the assessment of IS’ effectiveness (Hassanzadeh et al., Citation2012). The model provides insights into E-Gov success and the net benefits of E-Gov (Stefanovic et al., Citation2016). The creators of the above-mentioned model have also suggested further assessments of their updated success model from an IS success perspective. Thus, this study employs the D&M model to examine the success of E-Gov systems in developing countries.
2.3. Technology acceptance model
The technology acceptance model (TAM) presented by Davis (Citation1989) attracted the attention of researchers interested in exploring the adoption of information technology (Xie et al., Citation2017). TAM posits that perceived ease of use and perceived usefulness (PU) are the two most important elements of one’s attitude towards system use; in turn, they affect one’s intention to use a system. Researchers have tested TAM extensively to examine the key factors influencing the intention of users to use a given technology system (Al-Fraihat et al., Citation2020; Liu et al., Citation2014; Rana et al., Citation2014; M. Rehman et al., Citation2016; Shareef et al., Citation2009). Researchers have also combined TAM and the D&M model to gauge the success of E-Gov, and their discoveries exhibited that such combinations have produced more insights into E-Gov success (Al-Rahmi et al., Citation2022; Rana et al., Citation2014; M. Rehman et al., Citation2016). Our proposed model does not contain the “ease of use” variable as it is a characteristic of SYSQ. Regarding the two variables “intention to use” and “actual system use,” the “intention to use” variable is suitable for mandatory usage contexts, while the “actual system use” is more appropriate for voluntary usage contexts (Al-Fraihat et al., Citation2020). Moreover, DeLone & McLean (Citation2003) has contended that the “intention to use” and “actual system use” variables are alternatives to each other. As the UEG is voluntary, this study utilizes the “Use” variable. The “attitude towards use” variable is not taken because this research tries to study the key elements affecting the success of the E-Gov system; the actual-use measures the system’s success more appropriately. Hence, this research integrates the PU variable from TAM into the D&M model to formulate the conceptual model.
2.4. Perceived trust
The substantial impact of trust on users’ intentions to use E-Gov services has been endorsed by many researchers (Al-Rahmi et al., Citation2022; Shareef et al., Citation2011; Zahid & Din, Citation2019). Citizens hesitate to accept E-Gov services if they do not trust E-Gov amenities (Teo et al., Citation2008). People often prefer conventional methods over the use of E-Gov facilities due to the trust deficit in online services (Lallmahomed et al., Citation2017). Citizens who trust that E-Gov can safeguard them against risks are more likely to accept and use E-Gov services (Zahid & Din, Citation2019). Keeping these facts in mind, this study incorporates the trust factor as an independent variable in the proposed model.
2.5. Perceived awareness
Various studies have mentioned that awareness is an essential antecedent of E-Gov espousal (M. Rehman et al., Citation2016; Shareef et al., Citation2011; R. Sharma & Mishra, Citation2017). Citizens will accept E-Gov services if they are aware of these services (Shareef et al., Citation2011). The citizens who do not use E-Gov services if they are unaware of these services (Joshi & Islam, Citation2018; Petter et al., Citation2013). Citizens’ awareness of the advantages of E-Gov services plays a vital role in the adoption of E-Gov (Joshi & Islam, Citation2018). The factors influencing the success of E-Gov were studied by (Lallmahomed et al., Citation2017), and their results did not confirm the significant impacts of PA on behavioral intentions. Due to the difference in researchers’ opinions about the implication of PA, further investigation of the awareness variable in the study of E-Gov success is needed. Thus, this study investigates the moderating impact of PA on the UEG.
Keeping in mind the concerns and context of the study, both the theories TAM and D&M Model promote and support technology adoption. The D&M Model further extends its scope to evaluate the success of the IS. The TAM model posits that the users will perceive the technology as more useful if they will find it easier to use that in turn leads to the actual system use. The D&M model postulates that the superior quality dimensions lead to higher satisfaction and adoption of the system which in turn enhances the net benefits. Additionally, the feedback links from net benefits to both intended use/use and satisfaction also proclaim the adoption of technology for reaping its benefits and satisfaction. For further exploration, the study incorporated the perceived usefulness construct from TAM. The incorporation of the Perceived Usefulness variable into the D&M model makes it more appropriate for the evaluation of e-government success as the perceptions of users about the net benefits are dependent on their perceptions and their satisfaction levels. In TAM, the intention to use is dependent on perceived usefulness. In other theories like Expectation Confirmation Model (ECM), the perceived usefulness influences both satisfaction and continuance intention. Therefore, in the context of this study, the study expects that the three quality dimensions of the D&M model influence positively satisfaction, perceived usefulness, and use of e-government which in turn leads to higher perceived net benefits. Further, the perceived trust and perceived awareness constructs also play a critical role in the success of e-government. If the system is trustworthy, the users will embrace its use. Similarly, without awareness of the e-government services, the users are reluctant to adopt and as a result, the e-government systems cannot succeed despite heavy investments. The three quality dimensions (information quality, systems quality, and service quality) in the proposed model are reflecting the qualities of the e-government service which affect the users’ satisfaction and their perceptions about the usefulness of the system.
2.6. Conceptual framework and hypotheses
2.6.1. Perceived net benefits and intention to use/use of e-gov
The creators of the D&M model grouped all impact-related measures (inter-organizational and industry impacts, consumer impacts, and societal impacts) into a single category and called them “net benefits” (DeLone & McLean, Citation2003). Net benefits were defined as the degree to which an E-Gov system pays to an individual’s success and the users perceive gains in a specific G2C system (Petter et al., Citation2013; Wang & Liao, Citation2008).
In the D&M model, the “intention to use” and “use” variables are alternatives, and the “intention to use” variable is more applicable in mandatory usage contexts (DeLone & McLean, Citation2003). E-Gov is used by citizens voluntarily, and “use” is an actual behavior that is more related to the E-Gov’s success (Petter et al., Citation2013). Hence, this study utilizes the “UEG” variable as an alternative to “intention to use” to quantify the success of E-Gov. After utilizing E-Gov amenities and experiencing their features, the users become more aware of the importance of the E-Gov system. This argument is supported by prior research (Al-Fraihat et al., Citation2020; Stefanovic et al., Citation2016; Wang & Liao, Citation2008). We expect that the UEG by citizens will have a positive impact on their perceived net benefits (PNB). Thus, this study proposes the following hypothesis:
H1: The UEG positively influences PNB.
2.6.2. Perceived usefulness (PU)
The PU construct is an important component of an individual’s conduct in the use of a technology system. The users’ perceptions concerning the usefulness of a technology system are critical for the user’s acceptance of that system. According to Davis (Citation1989), the level of a user’s belief that using a technology system will boost his/her job accomplishment is referred to as PU. Vast research has widely used PU in assessing the success of ISs (Al-Rahmi et al., Citation2022; Hidayat-ur-Rehman, Ahmad et al., Citation2022; Hidayat-ur-Rehman et al., Citation2020; Ibrahim & Hidayat-ur-rehman, Citation2021; Rana et al., Citation2014; M. Rehman et al., Citation2016; Seo & Bernsen, Citation2016; R. Sharma & Mishra, Citation2017; Warkentin et al., Citation2002). From an E-Gov success perspective, we assume that if citizens have positive perceptions of E-Gov’s usefulness, this will positively influence the following three variables: the UEG, USAT, and PNB. The literature on IS success supports these hypothesized relations. M. Rehman et al. (Citation2016) have validated the positive significant impacts of PU on the intention to espouse E-Gov amenities. The significant positive effects of PU on satisfaction and the intention to use were also established by other studies (I. H. Rehman et al., Citation2021; Rana et al., Citation2014). Hence, we formed the following hypothesis:
H2: PU positively influences the (a) UEG, (b) USAT, and (c) PNB.
2.6.3. User satisfaction
Prior research has established that “USAT” is a reasonable measure of information systems’ success (Al-Fraihat et al., Citation2020; Hidayat-Ur-Rehman et al., Citation2021). We have proposed in our model that if users have positive perceptions about usefulness, this leads them towards enhanced satisfaction, which in turn is a determining factor of PNB. Prior research has provided practical evidence of the positive impacts of USAT on PNB (Al-Fraihat et al., Citation2020; Stefanovic et al., Citation2016). Through improved user satisfaction and enhanced system use, several net benefits can be achieved (Wang & Liao, Citation2008). The authors of DeLone & McLean (Citation2003) proposed that clear profits, from the stakeholders’ perspective, can positively or negatively influence the “USE” and “USAT” variables. To decrease the complexity of the model and follow the practices used by other researchers (Al-Fraihat et al., Citation2020; Wang & Liao, Citation2008), we exclude the feedback paths from “PNB” to the variables “UEG” and “USAT”. Thus, we form the following hypothesis:
H3: USAT positively influences PNB.
2.6.4. Information quality, system quality, and service quality
The E-Gov system is a kind of IS; therefore, its adoption and success can be assessed using the D&M model (Al-Rahmi et al., Citation2022). We adopt the concepts for the relationships of INFQ, SYSQ, and SERQ with the UEG and USAT from prior research (Al-Fraihat et al., Citation2020; DeLone & McLean, Citation2003; S. K. Sharma & Sharma, Citation2019; Stefanovic et al., Citation2016; Teo et al., Citation2008; Wang & Liao, Citation2008). Using the results of the aforesaid prior studies, we assume that the three independent variables, namely INFQ, SYSQ, and SERQ, will have direct, positive effects on both the UEG and USAT.
According to Seddon (Citation1997), the users’ beliefs about INFQ influence PU significantly. Other researchers have also confirmed the findings of Seddon (Citation1997) by confirming the positive effects of INFQ on PU (Chen, Citation2010; I. H. Rehman et al., Citation2021; Lwoga, Citation2014). The success of E-Gov was examined by Rana et al. (Citation2014), and their findings confirmed the significant effects of INFQ on PU. Hence, we expect that INFQ positively influences PU in the context of this study.
SYSQ depends on the users’ needs regarding the removal of technology-based barriers (Rana et al., Citation2014). Higher levels of SYSQ provide users with more convenient, easier, and secure access to the system (Ahn et al., Citation2007). Enhancing SYSQ increases the usefulness of the system (Seddon, Citation1997). Similar results were produced by other researchers (Al-Fraihat et al., Citation2020; Liaw & Huang, Citation2013; Su-Houn Liu et al., Citation2005). Given these findings, we presume that SYSQ has significant impacts on PU from an E-Gov adoption perspective. Citizens receiving E-Gov services with a high SYSQ will perceive these services as useful.
DeLone & McLean (Citation2003) defined SERQ as the overall support rendered to the user by IS division. Several researchers have stated that this factor is important for IS success (Al-Fraihat et al., Citation2020; Dwivedi et al., Citation2010; Rana et al., Citation2014). When using E-Gov services, the users’ perceptions about the usefulness of the system are improved positively if the service provider delivers better SERQ. Prior research demonstrates that SERQ has a strong impact on PU (Al-Rahmi et al., Citation2022; Lwoga, Citation2014). Therefore, we assume that SERQ has significant positive effects on PU in the framework of this study. Therefore, our proposed hypotheses are the following:
H4: INFQ positively influences the (a) UEG, (b) PU, and (c) USAT.
H5: SYSQ positively influences the (a) UEG, (b) PU, and (c) USAT.
H6: SERQ positively influences the (a) UEG, (b) PU, and (c) USAT.
2.6.5. Perceived trust
Trust in E-Gov refers to the degree of citizens’ belief that E-Gov transactions are reliable and trustworthy (Deng et al., Citation2018). It includes the perceptions of individuals concerning the capability and reliability of the service provider (Bélanger & Carter, Citation2008). The users’ trust in E-Gov depends on the users’ beliefs that government authorities are capable of implementing the necessary infrastructure and that they can secure such systems (Lallmahomed et al., Citation2017). The trust of users is a critical element in the long-term connectivity of users in business-related transactions (Hidayat-Ur-Rehman et al., Citation2021; Hidayat-ur-Rehman, Alzahrani et al., Citation2022). Perceived trust (PT) builds confidence in E-Gov’s performance and ensures the use of E-Gov services (Zahid & Din, Citation2019). Prior research has provided evidence that PT has positive influences on users’ intentions to use E-Gov services (Shareef et al., Citation2011; Zahid & Din, Citation2019). Following these arguments, we believe that PT has positive impacts on the UEG.
Weerakkody et al. (Citation2016) studied the elements influencing citizens’ satisfaction with E-Gov services in United Kingdom. They confirmed that a higher level of trust enhances citizens’ satisfaction levels. The same results about the positive impact of trust on satisfaction have also been presented by S. K. Sharma & Sharma (Citation2019) in a mobile banking context. Similar results have been given by other researchers who examined IS adoption (Mokhtar & Katan, Citation2017; Susanto et al., Citation2016). However, the significant effects of trust on satisfaction were not confirmed by Malik et al. (Citation2016), who also examined satisfaction with E-Gov services. Thus, we further investigate the effects of trust on satisfaction, and we presume that PT will positively influence user satisfaction.
Research in other IS contexts has confirmed the significant impacts of PT on PU (Gefen et al., Citation2003; Wen et al., Citation2011). It has been argued by Wu et al. (Citation2011) that trust positively influences PU. E-Gov adoption was studied by (Belanche et al., Citation2012); they validated the positive significant effects of trust on PU. Given these facts, we suppose that PT has a positive influence on PU in E-Gov adoption. Hence, we form the following hypothesis:
H7: PT positively influences the (a) UEG, (b) PU, and (c) USAT.
2.6.6. Moderating effects of perceived awareness
Creating awareness among citizens is critical for citizens’ espousal of E-Gov (Shareef et al., Citation2011). Awareness of the system is needed at the time when the beliefs are being developed and the awareness of the stakeholders of all the characteristics of E-Gov will help them to develop an attitude in favor of adopting E-Gov (Limayem et al., Citation2007; Shareef et al., Citation2011). Researchers have studied the PA versus the espousal of/the intention to use the E-Gov relationship and have found that awareness has a positive impact on the adoption of E-Gov (M. Rehman et al., Citation2016; Shareef et al., Citation2011). However, the findings of some researchers contradict these results (Lallmahomed et al., Citation2017; R. Sharma & Mishra, Citation2017). Therefore, it is required to further examine the function of PA in nations’ acceptance of E-Gov. Hence, this study examines the moderating function of PA in the “UEG” and “PNB” relationship. We expect that citizens with more awareness will have more propensity to use E-Gov services and will perceive more benefits of using the E-Gov system. Hence, we form the following hypothesis:
H8: PA moderates the “UEG” and “PNB” relationship: the relationship is strong for citizens with more PA and weak for citizens with less PA.
Figure below depicts conceptual model of the study.
Figure 1. Proposed model.
3. Methodology
3.1. Survey development
This study used a survey method for the collection of data from the citizens of Pakistan. The survey items were acquired from the prior literature in the fields of E-Gov and ISs, and these were modified slightly according to the context of the study. The questionnaire contained two sections. Section 1 contained questions used to gather demographic information, while section 2 contained measurement items to collect data and validate our model. Following the well-established quantitative analysis practices used in the frameworks of E-Gov systems and information systems, this research used 33 closed-ended questions (Deng et al., Citation2018; R. Sharma & Mishra, Citation2017; Weerakkody et al., Citation2016; Zahid & Din, Citation2019). Measurement items for USAT, SYSQ, INFQ, SERQ, and PNB were adapted from (Stefanovic et al., Citation2016). Items for PT and PA were taken from (Shareef et al., Citation2011). Items for the UEG and PU were adapted from (Wang & Liao, Citation2008) and (Belanche et al., Citation2012), respectively. Likert scales (1–5) ranging from “strongly disagree” to “strongly agree” were used for all items.
3.2. Data collection and sample
The online survey was used to gather data from various geographical regions of Pakistan; respondents’ participation was voluntary. The questionnaires were distributed among about 1300 participants from public universities, government offices, private companies, and social media websites like Facebook, WhatsApp, LinkedIn, and Twitter. A screening question was included in the survey to ask the respondents about the use of E-Gov. The objective was to invite those respondents who had used E-Gov services to fill out the survey. In designing a survey, determining the appropriate sample size is critical (Bartlett et al., Citation2001).
The study did not contain survey data relevant to diagnostic accuracy, observational, microarray experiments, or other types of health-related research. Moreover, the study did not collect and use any personal information of the respondents. The study collected and used responses about their experiences of using E-Gov services. Their participation was voluntary and prior consent was not needed. Due to these facts, approval from the ethics committee/institutional review board was not needed.
Roscoe (Citation1975) suggested that the effective sample size may be between 30 to 500 and that results for a very large sample size are not accurate. Stevens (Citation2002) recommended 15 cases per predictor in the analysis of least squares multiple regression. Since SEM resembles multiple regression in many ways, 15 cases per construct is an appropriate sample size. We received a total of 287 completed questionnaires. After screening the data, 23 cases were discarded due to missing data and outliers. The remaining 264 cases were analyzed for model testing. Table depicts the demographic information of the respondents.
Table 1. Demographic Characteristics of Respondents
3.3. Data analysis and results
Before proceeding to the model assessment, we performed a one-sample Kolmogorov-Smirnov test to examine the data distribution. The outcomes of this test showed that the data distribution is non-normal. Hew et al. (Citation2017) have stated that the PLS-SEM is a suitable method if the data distribution is non-normal. Hence, this study used the partial least squares-structural equation modeling (PLS-SEM) method to assess the proposed model. Urbach & Ahlemann (Citation2010) have posited that PLS-SEM is better than covariance-based SEM at handling complex models comprised of many variables. This is a popular method for theory assessment that gauges the psychometric properties of the measures and determines whether the proposed relationships exist (Ringle et al., Citation2015). SmartPLS 3.2 and SPSS 23 were used as tools to analyze our data. First, the reliability of the measurement model was tested followed by tests to assess the convergent and discriminant validity of the measurement model. Then, the structural model was analysed.
3.3.1. Measurement model analysis
The measurement model was measured for reliability and validity using the tests recommended by (Hair Jr et al., Citation2017). The reliability tests include internal consistency reliability, composite reliability, and indicator reliability, while the validity tests include convergent validity and discriminant validity. Results of Cronbach’s alpha (>0.6), composite reliability (>0.7), and indicator reliability (>0.7) tests are listed in Table . Both Cronbach’s alpha and composite reliability values are above the minimum required levels. For indicator reliability, the outer loadings were examined. The outer loadings of the items INFQ5 (0.403), PT4 (0.644), PT5 (0.614), SERQ2 (0.610), and SERQ5 (0.633) were found to be below the threshold value (0.7); as a result, these items were removed from the model before further analyses were carried out. To gauge the convergent validity, we evaluated the average variance extracted (AVE). The AVE values listed in the last column of Table are above 0.5, which indicates the existence of convergent validity.
Table 2. Reliability Tests Summary
We tested the discriminant validity by using Fornell-Lacker’s criterion. Table depicts the values of Fornell-Lacker’s criterion.
Table 3. Discriminant Validity
The diagonal elements represent the square roots of the AVE. Each variable’s correlations with other variables are less than the corresponding diagonal element of that variable. This indicates discriminant validity. Further, the Heterotrait-Monotrait ratio (HTMT) was also estimated to check the discriminant validity. According to Henseler et al. (Citation2015), the HTMT values between any two variables should be less than 0.9. The HTMT values are listed above the diagonal elements in Table . All these values are less than 0.9. It endorses the presence of discriminant validity of the model.
3.3.2. Common method bias
The bias arising from using the same source (e.g., a survey) to collect data for both dependent and independent variables is referred to as common method bias (CMB). Among the variables, if most of the variance is explained by a single factor, then CMB exists (Philip et al., Citation2003). We carried out Harman’s single-factor test to assess the CMB; it revealed that a single factor explained 37.8% of the total variance, which is far below 50%. This indicates that CMB does not exist in our data. Further, a full collinearity test was also carried out, and all variance inflation factor (VIF) values are less than 3.3. Kock (Citation2015) suggested that VIF values less than 3.3 are an indication of the non-existence of CMB.
3.3.3. Multicollinearity
To determine the multicollinearity issues in the data, we examined the VIF and tolerance values. The VIF values ranged from 1.198 to 3.201; which are less than the threshold value of 10. Similarly, the tolerances were within the range of 0.273 to 0.835; all of these values are larger than 0.10, indicating that multicollinearity issues do not exist in our data (Leong et al., Citation2020).
3.3.4. Structural model analysis
To evaluate the coefficient of determination (R2), the PLS algorithm was run with standard settings. The R2 value for the UEG is 0.59; it is 0.56 for PU, 0.42 for USAT, and 0.53 for PNB. These findings indicate that the conceptual model has a reasonable descriptive capacity to explain the success of an E-Gov system.
To test the hypotheses, the bootstrapping procedure was run with 5000 subsamples and with the settings “No Sign Change,” “Bias Corrected & Accelerated Bootstrap,” and “Two-Tailed Test Type.” To evaluate our results, we assessed path coefficients with relevant p and t values. Figure exhibits the standardized path coefficients with the corresponding p-values of each direct and interaction effect. Table lists the outcomes of the structural model analysis. The results show that all the hypothesized relationships except INFQ → PU (H4b) are supported with a significance level of at least p < 0.1.
Figure 2. SEM Analysis of Structural Model.
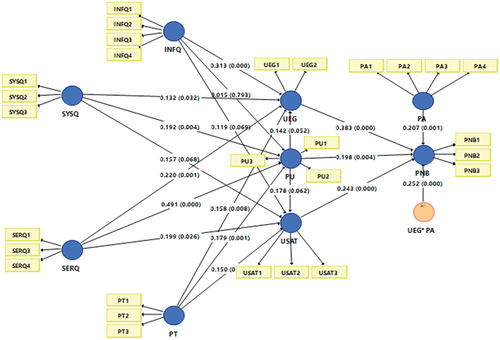
Table 4. Summary of Structural Model Path Coefficients
The impact of the UEG on PNB (β: 0.383, p < 0.01) is significant; this confirms hypothesis H1. PU has significant relationships with the UEG (β: 0.182, p < 0.01), USAT (β: 0.178, p < 0.1), and PNB (β: 0.198, p < 0.01), which supports hypotheses H2a, H2b, and H2c. Hypothesis H3 assumes significant relationships between USAT and PNB; this hypothesis is also confirmed by our results (β: 0.243, p < 0.01). INFQ has significant effects on both the UEG (β: 0.340, p < 0.01) and USAT (β: 0.120, p < 0.1), but its relationship with PU (β: 0.015, p < 0.01) is not significant. These findings support hypotheses H4a and H4c, while hypothesis H4b is not supported. The significant impact of SYSQ on the UEG (β: 0.168, p < 0.01), PU (β: 0.192, p < 0.01), and USAT (β: 0.157, p < 0.1) has been confirmed, which supports hypotheses H5a, H5b, and H5c. Similarly, the significant effect of SERQ on the UEG (β: 0.266, p < 0.01), PU (β: 0.491, p < 0.01), and USAT (β: 0.199, p < 0.05) has also been confirmed, which supports hypotheses H6a, H6b, and H6c.
This study confirms the insignificant impacts of INFQ on PU. Moreover, the significant effects of SYSQ and SERQ on PU were also confirmed. The last independent variable is PT, and it was hypothesized that PT influences the UEG, PU, and USAT significantly. Our findings supported this idea: hypotheses H7a (β: 0.192, p < 0.01), H7b (β: 0.179, p < 0.01), and H7c (β: 0.151, p < 0.05) have been confirmed. In short, the empirical results provided support to 16 hypothesized relationships, while one relationship, INFQ → PU, was not supported.
3.3.5. Moderating effects
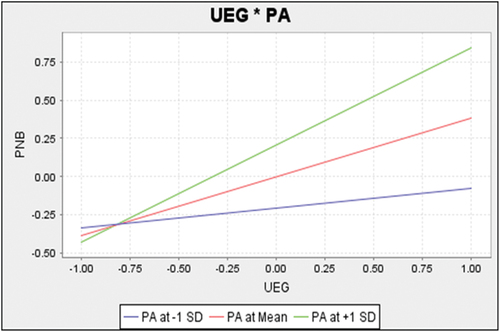
Hypothesis H8 assumed that PA has a moderating effect on UEG → PNB relationship. Our results show the significant effect of PA on PNB (β: 0.208, p < 0.001). The influence of the interaction of the UEG and PA on PNB is significant (β: 0.252, p < 0.000), which demonstrates that UEG → PNB relationship is contingent upon PA. The simple effect of the UEG on PNB is β = 0.383. These outcomes imply that the strength of the UEG → PNB relationship is 0.383 for an average level of PA. For higher levels of PA (e.g., when PA is amplified by one standard deviation unit), the correlation between the UEG and PNB is increased by the worth of the communication term (i.e., 0.383 + 0.252 = 0.635). Higher levels of PA cause a stronger relationship between the UEG and PNB, while lower levels of PA result in a weaker relationship between the UEG and PNB. The slope given in Figure indicates that the upper line, which represents the higher level of PA, has a steeper slope, while the lower line, which shows the lower level of PA, has a flatter slope. This makes sense, as the interaction term is positive. Hence, the UEG→PNB relationship has more strength for enhanced levels of PA and vice versa. This supports hypothesis H8 and provides evidence of the moderating effect of PA.
Figure 3. Moderating Effect of PA on the relationship between USAT and PNB.
4. Discussion and conclusions
This study has explored the key elements of the success of E-Gov amenities and investigated the PA variable for its moderating role in nations’ espousal of E-Gov amenities. The PU and PT constructs were integrated into the D&M success model, and we presented an empirically validated model. The validated model can reasonably explain the success of E-Gov services. This study also assessed the PA variable’s moderating effects on UEG→PNB relationship; this is a valuable contribution to the literature. This study advances the E-Gov literature by providing information that is relevant to academia and practical applications.
This study has established the significant effects of INFQ, SYSQ, and SERQ on the UEG and USAT, which in turn affect the PNB. These outcomes support the findings of prior studies (Al-Fraihat et al., Citation2020; DeLone & McLean, Citation2003; S. K. Sharma & Sharma, Citation2019; Stefanovic et al., Citation2016; Teo et al., Citation2008; Wang & Liao, Citation2008). These results show that for users’ satisfaction and acceptance of E-Gov services, information quality, system quality, and quality of service have prime importance. The governments should focus on ensuring the high quality of these three areas if they want to ensure the success of E-Gov services.
Data analysis results have also established the significant effects of PT on the constructs UEG, PU, and USAT. These results endorsed the findings given by (Lallmahomed et al., Citation2017; M. Rehman et al., Citation2016; Shareef et al., Citation2011; Susanto et al., Citation2016; Wen et al., Citation2011; Zahid & Din, Citation2019) research findings. They suggest that PT is a central factor of E-Gov success and that citizens will use E-Gov services if these services are trustworthy. Therefore, government officials should make every effort to ensure trustworthy and reliable E-Gov services.
Our findings have confirmed the insignificant relationship between INFQ and PU. PU is not reliant on INFQ; rather, it is reliant on the remaining two dimensions of quality (SERQ and SYSQ) and the PT. This result contradicts previous research (Al-Fraihat et al., Citation2020; Chen, Citation2010; Lwoga, Citation2014). The significant impacts of SYSQ, SERQ, and PT on PU were confirmed. These findings support the existing research (Al-Fraihat et al., Citation2020; Hagos et al., Citation2016; Liaw & Huang, Citation2013; Lwoga, Citation2014; Su-Houn Liu et al., Citation2005). PU is an antecedent of PNB. This suggests that if SYSQ and SERQ are superior and E-Gov services are trustworthy, then the citizens will perceive these services as more worthwhile, and they will expect more net benefits from the use of these services.
It was confirmed by our results that the UEG, PU, and USAT are the three key determinants of PNB. Moreover, PU has positive impacts on both the UEG and USAT. These outcomes provide support for prior research (Al-Fraihat et al., Citation2020; Rana et al., Citation2014; M. Rehman et al., Citation2016; Stefanovic et al., Citation2016; Wang & Liao, Citation2008). These findings indicate that citizens with more PU are ready to embrace E-Gov services and that they feel more satisfied with these services. Their satisfaction and usage experiences increase their understanding of the net benefits of E-Gov.
This study hypothesized that PA moderates the UEG→PNB relationship. Empirical results have confirmed that PA moderates the UEG→PNB relationship: it is stronger for higher values of PA and vice versa. These results have presented the importance of PA in quantifying the success of E-Gov amenities. Moreover, it supports the argument of prior research concerning the worth of PA in fostering an attitude that is favorable to the acceptance of E-Gov (Shareef et al., Citation2011).
4.1. Theoretical and practical implications
The outcomes have revealed that the model presented by this study has a substantial ability to explain E-Gov’s success. This study incorporated PU and PT into the D&M success model and confirmed that PT and PU play a crucial role in the success of E-Gov. This integration will be helpful in other information system contexts.
Other than the total indirect and direct effects of different variables, the study investigated the moderating function of citizens’ awareness of the espousal of E-Gov amenities. This will help E-Gov project managers to take citizens’ awareness into account, launch different campaigns to keep them informed about E-Gov services, and motivate them to use these services. Governments are advised to encourage citizens to internet users because the internet is the fundamental requirement for an E-Gov amenity. Our findings will open doors for future research to consider how to boost citizens’ awareness.
These findings confirm that the three quality dimensions (INFQ, SYSQ, SERQ) and the PT are the critical determinants of the UEG, PU, and USAT. Further, PU has significant impacts on the UEG, USAT, and PNB. Thus, E-Gov project managers should emphasize improving the quality dimensions to guarantee the accomplishment of such projects. They should examine the reliability of service providers. The privacy and security of transactions should be ensured because this will deepen the users’ trust in the system. Enhanced quality aspects and trustworthiness will increase the use of E-Gov services, PU, and users’ satisfaction. Increased usage, more satisfaction, and enhanced insights about usefulness can result in more benefits, such as higher efficiency, operational excellence, time and cost savings, and improved delivery of services.
Further, the study explored important contextual and theoretical phenomenon of interest. It added to both, body of knowledge and practice. From the theoretical perspective, the study extended the current literature on D&M IS success model by incorporating the PU (from TAM) and PT constructs. The study demonstrated that the D&M IS success model is an effective model to appraise the success of E-Gov. The incorporation of TAM construct namely PU further confirmed the capability of TAM related constructs in investigating the technology adoption. The information quality along with other quality dimensions of the E-Gov were tested and found significant. Thus the recommendations of researchers as mentioned in Section 2.2 were addressed. Moreover, the moderating role of perceived awareness was confirmed which filled the research gap, mentioned in the introduction section of the paper.
Similarly, from the contextual perspective, in many countries, especially, the developing countries, still manual practices of the governance has shaken their pace of progress, which need to be resolved. There can be many valid reasons, however, the three confirmed in this study are the PT, PU, and PA. General public is considered tech-illiterate. The governments should launch awareness campaigns to motivate the citizens towards the use of E-Gov. If the public sees some value-added in the form of PU, they may happily adopt technology. So, the interest of the citizen can be bolster through incorporating PU in the technology adoptions. Similarly, the policy makers should make the E-Gov infrastructure and services trustworthy for the users which can boost their satisfaction and perceptions about usefulness of the system. The above-tested model admits that the governments can implement technology using the above-tested model, which can reduce costs, wastages and can lead to the lean management practices.
4.2. Limitations and future directions
Although this study enhances the existing literature on the success of E-Gov and discusses theoretical and practical implications, there are some limitations associated with the research. First, this research has ignored the feedback relationships from PNB to the UEG and USAT to keep the proposed model simple and to avoid model complications. Future studies could test our model in other geographical contexts and include feedback relationships, which could produce more valuable insights into the phenomenon. Second, our study is based on a cross-sectional survey. As the IS discipline is more dynamic, future studies could use a longitudinal approach, collecting samples during different periods to assess citizens’ behaviors to quantify the success of E-Gov services. Third, this study used PA as a moderator. Future research may include other moderators like the “perceived ability to use” and other demographic variables like “income level,” “education level,” and “facilitating conditions.” Testing such moderating variables may produce interesting results. Fourth, this research has employed a quantitative technique to explore E-Gov success. Future studies could use mixed-method approaches that could provide deeper insights into the problem. Fifth, this study has considered the “net benefits” variable in a wider E-Gov context. Future researchers could clearly define the stakeholders and contexts for which the net benefits will be measured (DeLone & McLean, Citation2003).
Disclosure statement
No potential conflict of interest was reported by the authors.
Additional information
Funding
References
- Ahn, T., Ryu, S., & Han, I. (2007). The impact of Web quality and playfulness on user acceptance of online retailing. Information and Management, 44(3), 263–18. https://doi.org/10.1016/j.im.2006.12.008
- Alcaide–Muñoz, L., Rodríguez–Bolívar, M. P., Cobo, M. J., & Herrera–Viedma, E. (2017). Analysing the scientific evolution of e-Government using a science mapping approach. Government Information Quarterly, 34(3), 545–555. https://doi.org/10.1016/j.giq.2017.05.002
- Al-Fraihat, D., Joy, M., Masa’deh, R., & Sinclair, J. (2020). Evaluating E-learning systems success: An empirical study. Computers in Human Behavior, 102, 67–86. https://doi.org/10.1016/j.chb.2019.08.004
- AlKalbani, A., Deng, H., & Kam, B. (2015). Organisational security culture and information security compliance for e-government development: The moderating effect of social pressure. https://aisel.aisnet.org/pacis2015/65
- Al-Rahmi, W.M., Uddin, M., Alkhalaf, S., Al-Dhlan, K. A., Javier, C.F., Al-Rahmi, A.M., & Al-Adwan, A.S. (2022). validation of an integrated is success model in the study of E-Government. mobile information system, 2022, 1–16. https://doi.org/10.1155/2022/8909724
- Bartlett, J. E., Kotrlik, J. W., & Higgins, C. C. (2001). Organizational research: Determining appropriate sample size in survey research. Information Technology, Learning, and Performance Journal, 19(1), 43–50. https://doi.org/10.1109/LPT.2009.2020494
- Belanche, D., Casaló, L. V., & Flavián, C. (2012). Integrating trust and personal values into the technology acceptance model: The case of e-government services adoption. Cuadernos de Economía y Dirección de la Empresa, 15(4), 192–204. https://doi.org/10.1016/j.cede.2012.04.004
- Bélanger, F., & Carter, L. (2008). Trust and risk in e-government adoption. Journal of Strategic Information Systems, 17(2), 165–176. https://doi.org/10.1016/j.jsis.2007.12.002
- Chen, H. J. (2010). Linking employees’ e-learning system use to their overall job outcomes: An empirical study based on the IS success model. Computers and Education, 55(4), 1628–1639. https://doi.org/10.1016/j.compedu.2010.07.005
- Clemes, M. D., Gan, C., & Zhang, J. (2014). An empirical analysis of online shopping adoption in Beijing, China. Journal of Retailing and Consumer Services, 21(3), 364–375. https://doi.org/10.1016/j.jretconser.2013.08.003
- Dale Stoel, M., & Muhanna, W. A. (2009). IT capabilities and firm performance: A contingency analysis of the role of industry and IT capability type. Information and Management, 46(3), 181–189. https://doi.org/10.1016/j.im.2008.10.002
- Davis, F. D. (1989). Perceived usefulness, perceived ease of use, and user acceptance of information technology. MIS Quarterly, 13(3), 319–340. https://doi.org/10.2307/249008
- DeLone, W. H., & McLean, E. R. (1992). Information systems success: The quest for the dependent variable. Information Systems Research, 3(1), 60–95. https://doi.org/10.1287/isre.3.1.60
- DeLone, W. H., & McLean, E. R. (2003). The DeLone and McLean model of information systems success: A ten-year update. Journal of Management Information Systems, 19(4), 9–30. https://doi.org/10.1080/07421222.2003.11045748
- Deng, H., Karunasena, K., & Xu, W. (2018). Evaluating the performance of e-government in developing countries: A public value perspective. Internet Research, 28(1), 169–190. https://doi.org/10.1108/IntR-10-2016-0296
- Dwivedi, Y. K., Papazafeiropoulou, A., Brinkman, W. P., & Lal, B. (2010). Examining the influence of service quality and secondary influence on the behavioural intention to change internet service provider. Information Systems Frontiers, 12(2), 207–217. https://doi.org/10.1007/s10796-008-9074-7
- Dwivedi, Y. K., Weerakkody, V., & Janssen, M. (2011, November). Moving towards maturity: Challenges to successful e-government implementation and diffusion. Data Base for Advances in Information Systems, 42(4), 11–22. https://doi.org/10.1145/2096140.2096142
- Gefen, D., Karahanna, E., & Straub, D. W. (2003). Trust and TAM in online shopping: an integrated model. MIS Quarterly, 27(1), 51–90. https://doi.org/10.1007/s13398-014-0173-7.2
- Hagos, Y., Garfield, M., & Anteneh, S., “Measurement factors model for e-learning systems success,” in Proceedings - International Conference on Research Challenges in Information Science, 2016, pp. 1–6, https://doi.org/10.1109/RCIS.2016.7549361.
- Hair Jr, J. F., Hult, G. T. M., Ringle, C., & Sarstedt, M. 2017. A primer on partial least squares structural equation modeling (PLS-SEM) (2nd Ed.) Los Angeles [2017]: Sage Publications.
- Hassanzadeh, A., Kanaani, F., & Elahi, S. (2012). A model for measuring e-learning systems success in universities. Expert Systems with Applications, 39(12), 10959–10966. https://doi.org/10.1016/j.eswa.2012.03.028
- Henseler, J., Ringle, C. M., & Sarstedt, M. (2015). A new criterion for assessing discriminant validity in variance-based structural equation modeling. Journal of the Academy of Marketing Science, 43(1), 115–135. https://doi.org/10.1007/s11747-014-0403-8
- Hew, J. J., Tan, G. W. H., Lin, B., & Ooi, K. B. (2017). Generating travel-related contents through mobile social tourism: Does privacy paradox persist? Telematics and Informatics, 34(7), 914–935. https://doi.org/10.1016/j.tele.2017.04.001
- Hidayat-ur-Rehman, I., Ahmad, A., Akhter, F., & Ziaur Rehman, M. (2022). Examining consumers’ adoption of smart wearable payments. SAGE Open, 12(3), 215824402211177. https://doi.org/10.1177/21582440221117796
- Hidayat-Ur-Rehman, I., Ahmad, A., Khan, M. N., & Mokhtar, S. A. (20212021). Investigating mobile banking continuance intention: A mixed-methods approach. Mobile Information Systems, 2021, 1–17. https://doi.org/10.1155/2021/9994990
- Hidayat-ur-Rehman, I., Akram, M. S., Malik, A., Mokhtar, S. A., Bhatti, Z. A., & Khan, M. A. (2020). Exploring the determinants of digital content adoption by academics: The moderating role of environmental concerns and price value. SAGE Open, 10(2), 1–15. https://doi.org/10.1177/2158244020931856
- Hidayat-ur-Rehman, I., Alzahrani, S., Rehman, M. Z., & Akhter, F. (2022, January). Determining the factors of m-wallets adoption. A twofold SEM-ANN approach. PLOS ONE, 17(1), e0262954. https://doi.org/10.1371/journal.pone.0262954
- Hooda, A., Gupta, P., Jeyaraj, A., Giannakis, M., & Dwivedi, Y. K. (2022, December). The effects of trust on behavioral intention and use behavior within e-government contexts. International Journal of Information Management, 67, 102553. https://doi.org/10.1016/j.ijinfomgt.2022.102553
- Ibrahim, Y., & Hidayat-ur-rehman, I. (2021). COVID-19 crisis and the continuous use of virtual classes. International Journal of Advanced and Applied Sciences, 8(4), 117–129. https://doi.org/10.21833/ijaas.2021.04.014
- Joshi, P. R., & Islam, S. (2018). E-government maturity model for sustainable E-government services from the perspective of developing countries. Sustainability (Switzerland), 10(6), 1882. https://doi.org/10.3390/su10061882
- Kock, N. (2015). Common method bias in PLS-SEM: A full collinearity assessment approach. International Journal of e-Collaboration, 11(4), 1–10. https://doi.org/10.4018/ijec.2015100101
- Lallmahomed, M. Z. I., Lallmahomed, N., & Lallmahomed, G. M. (2017). Factors influencing the adoption of e-Government services in Mauritius. Telematics and Informatics, 34(4), 57–72. https://doi.org/10.1016/j.tele.2017.01.003
- Larsson, H., & Grönlund, Å. (2014). Future-oriented eGovernance: The sustainability concept in eGov research, and ways forward. Government Information Quarterly, 31(1), 137–149. https://doi.org/10.1016/j.giq.2013.07.004
- Leong, L. Y., Hew, T. S., Ooi, K. B., & Wei, J. (2020). Predicting mobile wallet resistance: A two-staged structural equation modeling-artificial neural network approach. International Journal of Information Management, 51, 102047. https://doi.org/10.1016/j.ijinfomgt.2019.102047
- Liaw, S. S., & Huang, H. M. (2013). Perceived satisfaction, perceived usefulness and interactive learning environments as predictors to self-regulation in e-learning environments. Computers and Education, 60(1), 14–24. https://doi.org/10.1016/j.compedu.2012.07.015
- Limayem, M., Hirt, S. G., & Cheung, C. M. K. (2007). How habit limits the predictive power of intention: The case of information systems continuance. MIS Quarterly: Management Information Systems, 31(4), 705–737. https://doi.org/10.2307/25148817
- Liu, Y., Li, H., Kostakos, V., Goncalves, J., Hosio, S., & Hu, F. (2014). An empirical investigation of mobile government adoption in rural China: A case study in Zhejiang province. Government Information Quarterly, 31(3), 432–442. https://doi.org/10.1016/j.giq.2014.02.008
- Lwoga, E. (2014). Critical success factors for adoption of web-based learning management systems in Tanzania. International Journal of Education and Development Using Information and Communication Technology (IJEDICT), 10(1). https://www.learntechlib.org/p/147447/
- Malik, B. H., Shuqin, C., Mastoi, A.G., Gul, N., & Gul, H. (2016). Evaluating citizen e-satisfaction from e-government services: A case of Pakistan. European Scientific Journal, ESJ, 12(5), 346–370. https://doi.org/10.19044/esj.2016.v12n5p346
- Mokhtar, S. A., Katan, H., & Hidayat-ur-Rehman, I. (2017). Mobile Banking Adoption: The Impacts of Social Influence, Ubiquitous Finance Control and Perceived Trust On Customers’ Loyalty. Science International-Lahore, 29(4), 829–836. http://www.sci-int.com/pdf/636408285057251754.pdf
- NITB, Pakistan.” https://nitb.gov.pk/ xxxx
- Petter, S., Delone, W., & McLean, E. R. (2013). Information systems success: The quest for the independent variables. Journal of Management Information Systems, 29(4), 7–62. https://doi.org/10.2753/MIS0742-1222290401
- Philip, P., Scott, M. M., Jeong-Yeon, B. L., & Nathan P, P. (2003). Common method biases in behavioral research: A critical review of the literature and recommended remedies. Journal of Applied Psychology, 88(5), 879. https://doi.org/10.1037/0021-9010.88.5.879
- Rana, N. P., Dwivedi, Y. K., Williams, M. D., & Weerakkody, V. (2014). Investigating success of an e-government initiative: Validation of an integrated IS success model. Information Systems Frontiers, 17(1), 127–142. https://doi.org/10.1007/s10796-014-9504-7
- Rasool, T., Warraich, N. F., & Rorissa, A. (2020). Citizens’ assessment of the information quality of e-government websites in Pakistan. Global Knowledge, Memory and Communication, 69(3), 189–204. https://doi.org/10.1108/GKMC-03-2019-0033
- Rehman, I. H., Ahmad, A., Akhter, F., & Aljarallah, A. (2021, November). A dual-stage SEM-ANN analysis to explore consumer adoption of smart wearable healthcare devices. Journal of Global Information Management, 29(6), 1–30. https://doi.org/10.4018/jgim.294123
- Rehman, M., Kamal, M. M., & Esichaikul, V. (2016). Adoption of e-government services in Pakistan: A comparative study between online and offline users. Information Systems Management, 33(3), 248–267. https://doi.org/10.1080/10580530.2016.1188570
- Ringle, C. M., Wende, S., & Becker, J.-M. (2015). SmartPLS 3.’ Boenningstedt: SmartPLS GmbH. Journal of Service Science and Management, 10(3), 32–49.
- Roscoe, J. T. (1975). Fundamental research statistics for the behavioral sciences. Holt, Rinehart and Winston.
- Seddon, P. B. (1997). A respecification and extension of the Delone and McLean model of Is success. Information Systems Research, 8(3), 240–253. https://doi.org/10.1287/isre.8.3.240
- Seo, D. B., & Bernsen, M. (2016). Comparing attitudes toward e-government of non-users versus users in a rural and urban municipality. Government Information Quarterly, 33(2), 270–282. https://doi.org/10.1016/j.giq.2016.02.002
- Shareef, M. A., Kumar, V., Kumar, U., & Dwivedi, Y. K. (2011). e-Government Adoption Model (GAM): Differing service maturity levels. Government Information Quarterly, 28(1), 17–35. https://doi.org/10.1016/j.giq.2010.05.006
- Shareef, M. A., Kumar, V., Kumar, U., & Hasin, A. A. (2009). Diffusion of innovation and capability theory in the context of e-government. In Handbook of research on contemporary theoretical models in information systems (pp. 193–211). IGI Global. https://doi.org/10.4018/978-1-60566-659-4.ch011
- Sharma, R., & Mishra, R. (2017). Investigating the role of intermediaries in adoption of public access outlets for delivery of e-Government services in developing countries: An empirical study. Government Information Quarterly, 34(4), 658–679. https://doi.org/10.1016/j.giq.2017.10.001
- Sharma, S. K., & Sharma, M. (2019). Examining the role of trust and quality dimensions in the actual usage of mobile banking services: An empirical investigation. International Journal of Information Management, 46, 10–22. https://doi.org/10.1016/j.ijinfomgt.2018.09.013
- Stats, I. W. (2020). Internet World Stats.
- Stefanovic, D., Marjanovic, U., Delić, M., Culibrk, D., & Lalic, B. (2016). Assessing the success of e-government systems: An employee perspective. Information and Management, 53(6), 717–726. https://doi.org/10.1016/j.im.2016.02.007
- Stevens, J. P. (2002). Applied multivariate statistics for the social sciences (4th ed.). Routledge, Taylor&FrancisGroup.
- Su-Houn Liu, C. Y., Hsiu-Li Liao, C. Y., & Cheng-Jun Peng, C. Y. (2005). Applying the technology acceptance model and flow theory to online e-learning users’ acceptance behavior. E-learning, 4(H6), 175–181. https://doi.org/10.48009/2_iis_2005_175-181
- Sun, P. L., Ku, C. Y., & Shih, D. H. (2015). An implementation framework for E-Government 2.0. Telematics and Informatics, 32(3), 504–520. https://doi.org/10.1016/j.tele.2014.12.003
- Susanto, A., Chang, Y., & Ha, Y. (2016). Determinants of continuance intention to use the smartphone banking services: An extension to the expectation-confirmation model. Industrial Management and Data Systems, 116(3), 508–525. https://doi.org/10.1108/IMDS-05-2015-0195
- Teo, T. S. H., Srivastava, S. C., & Jiang, L. (2008). Trust and electronic government success: An empirical study. Journal of Management Information Systems, 25(3), 99–132. https://doi.org/10.2753/MIS0742-1222250303
- U. Nations., “United Nations E-Government Survey Report,” 2018. Available: https://www.un.org/development/desa/publications/2018-un-e-government-survey.html.
- Urbach, N., & Ahlemann, F. (2010). Structural equation modeling in information systems research using partial least squares structural equation modeling in information systems research using partial least squares. Journal of Information Technology Theory and Application, 11(2), 5–40. https://aisel.aisnet.org/jitta/vol11/iss2/2
- Veeramootoo, N., Nunkoo, R., & Dwivedi, Y. K. (2018). What determines success of an e-government service? Validation of an integrative model of e-filing continuance usage. Government Information Quarterly, 35(2), 161–174. https://doi.org/10.1016/j.giq.2018.03.004
- Venkatesh, V., Thong, J. Y. L., Chan, F. K. Y., Hu, P. J. H., & Brown, S. A. (2011). Extending the two-stage information systems continuance model: Incorporating UTAUT predictors and the role of context. Information Systems Journal, 21(6), 527–555. https://doi.org/10.1111/j.1365-2575.2011.00373.x
- Wang, Y. S., & Liao, Y. W. (2008). Assessing eGovernment systems success: A validation of the DeLone and McLean model of information systems success. Government Information Quarterly, 25(4), 717–733. https://doi.org/10.1016/j.giq.2007.06.002
- Warkentin, M., Gefen, D., Pavlou, P. A., & Rose, G. M. (2002). Encouraging Citizen Adoption of e-Government by Building Trust. Electronic Markets, 12(3), 157–162. https://doi.org/10.1080/101967802320245929
- Weerakkody, V., Irani, Z., Lee, H., Hindi, N., & Osman, I. (2016). Are U.K. Citizens Satisfied With E-Government Services? Identifying and Testing Antecedents of Satisfaction. Information Systems Management, 33(4), 331–343. https://doi.org/10.1080/10580530.2016.1220216
- Wen, C., Prybutok, V., & Xu, C. (2011). An integrated model for customer online repurchase intention. Journal of Computer Information Systems, (FEBRUARY), 14–23. https://thekeep.eiu.edu/business_fac/8
- Wu, K., Zhao, Y., Zhu, Q., Tan, X., & Zheng, H. (2011). A meta-analysis of the impact of trust on technology acceptance model: Investigation of moderating influence of subject and context type. International Journal of Information Management, 31(6), 572–581. https://doi.org/10.1016/j.ijinfomgt.2011.03.004
- Xie, Q., Song, W., Peng, X., & Shabbir, M. (2017). Predictors for e-government adoption: Integrating TAM, TPB, trust and perceived risk. Electronic Library, 35(1), 2–20. https://doi.org/10.1108/EL-08-2015-0141/FULL/XML
- Zahid, H., & Din, B. H. (2019). Determinants of intention to adopt e-government services in Pakistan: An imperative for sustainable development. Resources, 8(3), 128. https://doi.org/10.3390/resources8030128