
Abstract
The rapid growth and success of sharing economy, particularly e-hailing services, have attracted many organisations to participate in this business. As a result, e-hailing organisations need strategies that enable them to compete in the market. One of the strategies that could help e-hailing organisations to stay competitive is to understand users’ perception of value. The aim of this study is to identify the values that users gain when they use e-hailing services. From there, this study also sought to determine the specific values, which contribute to satisfaction with e-hailing services. The Theory of Consumption Value was applied to examine as users’ perceived value with the inclusion of sustainability value. Based on the Partial Least Squares analysis via the software SmartPLS 3.2.8, users’ perceived value, which consists of economic value, convenience value, sustainability value, and hedonic value positively influences users’ satisfaction, while symbolic value negatively influences users’ satisfaction. The Importance-Performance Matrix Analysis (IPMA) results revealed that hedonic value is the most important value that contributes to users’ satisfaction. Theoretical and managerial implications as well as research limitations are duly discussed.
1. Introduction
Sharing economy “encompasses several ICT developments and technologies, which endorses sharing the consumption of goods and services through online platforms” (Hamari et al., Citation2016, 2047). It is also known as collaborative consumption, on-demand, and peer-to-peer services (Bellotti et al., Citation2015; Benoit et al., Citation2017; Schor & Fitzmaurice, Citation2015). In the accommodation sector, for example, the sharing economy not only allows users to buy and sell the use of a room or house but also involves transactions facilitated by the use of a sharing economy enabled platform on the internet whereby the user needs to pay for the use of the services via this platform (Eastman et al., Citation2014). In short, sharing economy happens when people participate in organised sharing, bartering, leading, trading, renting, swapping assets or collectives in order to obtain the same pleasure of ownership with reduced personal cost and lower environmental impact (Botsman & Rogers, Citation2010). In other words, it is also known as “sharing instead of having” principle by Arora et al. (Citation2022). Such activities are typically carried out through the use of a technological platform, and payment is done through payment online. Not to mention, sharing economy has also replaced the traditional business operations (Fang & Li, Citation2022).
The consumption of e-hailing services is growing exponentially and not to mention it has also gained rapid popularity among consumers worldwide (Elnadi & Gheith, Citation2022; Gaber et al., Citation2021). E-hailing services is one of the preferences among consumers, particularly in developing countries such as China, India, Vietnam, and Malaysia (Mordor Intelligence, Citation2022). Revenue from the e-hailing services in Southeast Asia is forecast to reach $20.1 billion in revenue by 2025 (Newcomer & Lee, Citation2018). These figures do not only show how profitable e-hailing services are but also show the rapid adoption of e-hailing services in this region. In addition, as e-hailing is asset-light and depends on cloud-based mobile application technology, the barriers for competitors to enter the market become relatively low and attract many new players in the market (Shamsudin et al., Citation2023). This is the case especially in Malaysia where there are 42 registered e-hailing companies had registered with the Land Public Transportation (APAD) (Choong & Lai, Citation2019).
E-hailing services are currently involved in a price war, making it difficult for e-hailing companies to exist in the long run (Aw et al., Citation2019). Due to the intense competition and rivalry, e-hailing companies must maintain their competitiveness and long-term viability. To remain competitive, e-hailing companies cannot rely exclusively on user satisfaction; instead, they must capitalise on their perception of value. With this gap to be addressed in this study, organiastion will understand and know which of the values are important for e-hailing users.
According to K. Ofori et al. (Citation2022), the term perceived value describes how customers compare a marketing offer’s costs and benefits to those of rival products. Perceived value had been acknowledged as forming the basis of every marketing activity and it is also one of the weapons in attracting and retaining users (E. J. Lee & Overby, Citation2004; Holbrook, Citation1999). In addition, it is also a strategy that is difficult to imitate compared to other strategies such as pricing, quality, and convenience (Woodruff, Citation1997). More importantly users’ perceived value is the primary antecedent towards users’ satisfaction particularly in the technology-based services context (Bonsón-Ponte et al., Citation2015; Gurau, Citation2012).
Many technology-based services have been established to improve society’s development in a multitude of ways (Asongu et al., Citation2019). While a user who adopts a new technology may experience improvement in his or her lifestyle as a result of the adoption. In addition, new technology will also help to manage societies’ daily activities more conveniently and efficiently (Pop et al., Citation2023). Qureshi (Citation2012) stated that this is contingent upon local conditions and cultural sensitivities surrounding the user. Given this, the contention of e-hailing services as a new technology that improves users’ lives but most of the research are conducted in the developed countries and these findings may not be applied in developing countries such as Malaysia, a fast developing nation among the ASEAN countries (Gaber et al., Citation2021). Therefore, this study aspires to identify the values that users gain when they use e-hailing services. From there, this study also sought to determine the specific values, which contribute to the satisfaction with e-hailing services. When users are satisfied with the use of e-hailing services, organisations could stay competitive and sustain in such a competitive market.
To understand what are the types of perceived value that could contribute towards users’ satisfaction in e-hailing services, the Theory of Consumption Value (TCV) was applied. In addition, sustainability value was incorporated into the TCV because it had become relevant in current times particularly in the sharing economy context (Botsman & Rogers, Citation2011; Tussyadiah, Citation2015). In this study, TCV was examined as a unidimensional construct, which consists of convenience value, economic value, hedonic value, symbolic value, and sustainability value. An importance-performance map analysis (IPMA) by means of partial least squares structural equation modelling (PLS-SEM) was also undertaken as a support to the research objectives. In addition to identifying which aspect of perceived value contributes most towards user’s satisfaction, IPMA also helps to ascertain which aspect of perceived value has relatively high importance for satisfaction. Indeed, IPMA analysis could help e-hailing organisations in their aim to stay competitive by retaining and attracting new users. In addition, it will also contribute towards sharing economy literature, particularly in the e-hailing context and TCV.
The underlying theory and the development of the hypotheses of this study will be discussed in the following section. The research methodologies, analysis and interpretation of the data, and a discussion of the findings were then presented. This study will then be concluded with theoretical and practical implications, limitations, as well as recommendations for future research.
TCV was initially developed by Sheth et al. (Citation1991). According to Tanrikulu (Citation2021), as TCV explains why (or not) a customer purchases a product, a product category, and a brand based on the value perspective, it offers significant contributions to theory and practise. More importantly, it is a valuable theory and most cited theory particularly in the field of consumer behaviour (Chi, Citation2015; Tanrikulu, Citation2021). However, perceived value remains lacking in consistency, especially on the nature of value, characteristics, and conceptualisation (Helkkula et al., Citation2012). Due to these complexities of perceived value, Gallarza et al. (Citation2019) stated that “researching value for marketing scholar has been an endless challenger” (p. 256). As such, empirical studies are required to understand research to investigate customer perceived value.
Although the perceived values that have been studied and tested in the sharing economy context are economic value, convenience value, symbolic value, and hedonic value (i.e. Benoit et al., Citation2017; Jiang et al., Citation2019; Razli et al., Citation2017; Stollery & Jun, Citation2017), researchers such as Botsman and Rogers (Citation2011) and Tussyadiah (Citation2015) stated sustainability value also relevant in the context of sharing economy. Interestingly, sustainability value was scarcely mentioned or tested empirically in many studies, particularly in sharing economic context (Benoit et al., Citation2017; Hamari et al., Citation2016) and not to mention in TCV. Therefore, sustainability value was added into TCV value dimensions.
Accordingly, in this study, TCV value dimensions namely consist of economic value, convenience value, symbolic value, hedonic value, and sustainability value. Furthermore, this theory is relevant in studying sharing economy particularly e-hailing services because TCV can be applied to both products and services in both pre- and post-experience settings. TCV tends to have its own flexibility and better reliability for measuring user’s perceived value (Sweeney & Soutar, Citation2001). In short, TCV enables researchers to capture perceived values more efficiently.
Economic value is one of the main reasons why users are attracted to use e-hailing services because economic value refers to users’ perception of the services as cost saving and providing better value (Tussyadiah, Citation2016). Researchers such as Hamari et al. (Citation2016) and Möhllmann (Citation2015) had identified empirically that economic value is one of the motivations and benefits that consumers gain while using sharing economy services as compared to other traditional services. Consumer perceived e-hailing as cheaper as compared to other similar transportation (C. K. H. Lee & Wong, Citation2021). Rintamäki et al. (Citation2007) stated that the economic value is one of the “hard-to-beat” value compared to other values. In addition, as users could save money when they are using the e-hailing services, they will feel satisfied with the services because Zhu et al. (Citation2017) found that users’ perception of value significantly predicted their satisfaction. Furthermore, Möhllmann’s (Citation2015) empirical study on sharing economy also proved that economic value is one of the key determinants of users’ satisfaction especially among Millennials users. Therefore, economic value has a positive influence on satisfaction.
H1:
Economic value is positively related to satisfaction with e-hailing services.
Convenience value is where users perceive that the services are derived through speed, ease of use and efficiency of completing an innovative service (Pihlström & Brush, Citation2008; Sigala & Sigala, Citation2006). In mobile technology-related services, convenience value has become a major attractor because technology helps to fulfil users’ tasks efficiently (Anderson & Srinivasan, Citation2003). As e-hailing services are technology-based, where the user is connected to the internet and has an application, users could hail a car at the location and time convenient to them. Furthermore, as drivers use GPS navigators, which show the fastest route to reach the destination, users could reach their destination faster as compared to traditional transportation such as buses. Therefore, services are delivered conveniently to users, and this convenience value will contribute towards customers’ satisfaction.
H2:
Convenience value is positively related to satisfaction with e-hailing services.
Symbolic value refers to the user perceiving that the use of e-hailing service could enhance their image and status in their social system (Teo & Pok, Citation2003). Following the definition by Hwang and Griffiths (Citation2017), symbolic value is one of the outcomes when using sharing economy enabled digital platforms. According to Park et al. (Citation1986), when products or services fulfil users internally and generate needs associated with users’ self-image or role, symbolic value will occur. Millennials are likely to perceive the use of sharing economy enabled digital platforms as “technology-savvy” because they can hail a car in style through their smartphones. In addition, as sharing economy services is an emerging trend, this has influenced users’ behaviour on a large scale (Botsman & Rogers, Citation2011). As a result, users who seek for symbolic value are more likely to be satisfied with collaborative consumption services (Möhllmann, Citation2015). Therefore, symbolic value will have a positive influence on satisfaction.
H3:
Symbolic value is positively related to satisfaction with e-hailing services.
Sustainability value optimises the environmental, social, and economic consequences of consumption in order to meet the needs of both current and future generations (Luchs et al., Citation2011). It is possible to see e-hailing services as environmentally friendly and cognizant of their positive impact on the environment (C. K. H. Lee & Wong, Citation2021). According to Phipps et al. (Citation2013) the development of sharing economy services such as Airbnb is used to foster a more sustainable market place. In line with research, Hamari et al. (Citation2016) have examined sustainability values and found that users who use sharing economy services, particularly accommodation services (Airbnb), are environmentally concerned about ecological issues. Furthermore, Botsman and Rogers (Citation2011) argue that sharing economy services particularly e-hailing could highly contribute towards ecological sustainability due to the need for fewer cars or tools needing to be produced. As such, the more users believed that using e-hailing services brings about sustainability value, the more satisfied they will be with e-hailing services. Thus, sustainability value will have a positive influence on satisfaction.
H4:
Sustainability value is positively related to satisfaction with e-hailing services.
Values received from the multisensory, fantasy, and emotive aspects, particularly on e-hailing experiences, are known as hedonic values (Jones et al., Citation2006). In other words, hedonic value is the users’ feelings of enjoyment and pleasure derived from using e-hailing services (Sweeney & Soutar, Citation2001). When a user has a good experience with the services they use, hedonic value could occur (Babin & Attaway, Citation2000). However, there has not been any conclusion as to the importance of hedonic value to customers’ experience in the context of e-hailing (K. Ofori et al., Citation2022). In the e-hailing services, hedonic value could occur because users can enjoy car rides with their family and friends. They could experience riding in different types of cars from one destination to another. Furthermore, they feel more relaxed and stress free when they use e-hailing services especially during heavy traffic. These pleasurable and fun experiences evoke favourable and positive feelings. Through these experiences and positive feelings, a higher degree of satisfaction will occur (Hsiao et al., Citation2016). Therefore, hedonic value has a positive influence on satisfaction.
H5:
Hedonic value is positively related to satisfaction with e-hailing services.
Figure shows the theoretical model of this study.
Figure 1. Theoretical Model.
1.1. Research MethodologyResearch site
This study was conducted in Malaysia. E-hailing services were first introduced in Malaysia in 2012 were MyTeksi (known as Byrne, Citation2016) followed by Uber in 2014. To date, the demand of e-hailing services has grown dramatically, even GrabCar that is well established in Malaysia, they are still facing numerous competitors from other e-hailing services. As of October 2019, there are around 42 e-hailing services that are registered with APAD (Land Public Transport Agency—Transportation Ministry) (Choong & Lai, Citation2019). Besides e-hailing services, these companies also compete with other public transport services such as metro, bases, and taxis. Not to mention, e-hailing services are also competing with free transportation that is being provided by several state governments in Malaysia, which increases the competition in this market. The data was collected through face-to-face self-administered questionnaires.
1.2. Population and Sample
This study was carried out among Malaysian Millennials who were born between 1980 and 2000 (Gurau, Citation2012). In addition, Millennials are always being linked to mobile technology and are described as the first high-tech generation (Eastman et al., Citation2014). More importantly, they are the segment that is most drawn towards sharing economy as compared to other segments (Hwang & Griffiths, Citation2017). As most of the millennials are students attending universities/colleges, some have already joined the workforce. However, millennials who join the workforce were not recruited in this study because most of them possessed a car. Therefore, in this study, public university Millennials users were chosen because they have limited resource of transportations as compared to the private university students. Contrary to suppositions, public university students’ lifestyles do not revolve solely around studies. Apart from their studies, the students do make time for other leisurely activities like patronising shopping malls, cinemas, entertainment lounges, as well as cafes. The fact that major public universities in Malaysia are located in or within close proximities to city centres means that the students will seek out e-hailing services as a convenient means to go to these outlets. More importantly, they have experience in using GrabCar, a popular e-hailing application in Malaysia.
The study employs a purposive sampling approach where Millennials who have experience in riding an e-hailing service were in the best position to provide the required information for this study. Regarding the sample size, G-power software was used to calculate the minimum sample size (Faul et al., Citation2009). From the G-power calculation, the minimum sample size needed was 92. However, to achieve an acceptable level of statistical power in PLS, a sample threshold of 100 was required (Reinartz et al., Citation2009).
1.3. Measurement
The items of these studies were adopted from several resources. Economic value was adopted from Tussyadiah (Citation2015); convenience value from Sigala and Sigala (Citation2006); symbolic value from Teo and Pok (Citation2003); sustainability value from Hamari et al. (Citation2016); hedonic value from Sweeney and Soutar (Citation2001); and satisfaction from Ruiz et al. (Citation2008). All of these items were measured using a 5-point Likert scale ranging from 1 = strongly disagree and 5 = strongly agree. Two analysis software were used for the data analysis namely SPSS version 23 was used to compute the descriptive statistics for the demographic profile and SmartPLS version 3.2.8 was used for the partial least-squares analysis (C. C. M. Ringle et al., Citation2015).
1.4. Findings Demographic
A total of 500 responses were obtained. However, seven responses had to be removed from the analysis due to outliers’ issues, resulting in a usable sample of 493 respondents. From these 493 respondents, 64.3% are female and 35.7% are male. The mean age of the respondents is 23 years old. As expected, a large percentage of the respondents are Malays (66.5%), followed by the Chinese (19.1%), other ethnicities in Malaysia such as Dusun, Bajau, Kadazan, Rungus (9.3%), and finally Indians (5.5%). The majority of the respondents are doing their undergraduate studies (76.1%), 18.5% are postgraduate students while 5.5% are diploma students. In terms of usage experience, the majority of the respondents have 1–2 years of experience using e-hailing services, particularly GrabCar.
1.5. Common method bias
Since the data for this study was collected from a single source (experience user), it is important to verify whether common method bias has occurred (Tehseen et al., Citation2017). According to MacKenzie and Podsakoff (Citation2012) and Podsakoff et al. (Citation2003), they suggested two primary ways to solve this problem namely through procedural control and statistical control. In this study, both procedural control and statistical control were used because using only one procedure does not help to remove the potential impact of common method bias. For procedural control, a cover letter was attached with the questionnaires explaining the basis of the research. As for statistical control, a marker variable called cognitive rigidity (Oreg, Citation2003) was introduced into the questionnaire. Cognitive rigidity is an individual’s cognitive process underlying the individual’s tendency to resist or avoid making changes, and this variable is not theoretically related to the variables of this study. The method of partialling out a marker variable (Podsakoff et al., Citation2003) was implemented by observing the R2 values of the endogenous constructs before and after adding the marker variable. Table shows that the R2 changes are very small. Therefore, this indicates that common method bias did not occur in this study.
Table 1. Partial Out a Marker Variable
1.6. Measurement Model
The measurement model’s construct validity was assessed through convergent and discriminant validity. Figure shows the model computed by SmartPLS. Table shows that all indicator loadings were higher than 0.50 (Byrne, Citation2016); Average variance extracted (AVE) values for each latent variable exceeded the threshold value of more than 0.50 (Hair et al., Citation2017) where the latent constructs explain more than 50% of the indicators’ variance. These findings (outer loadings and AVE values) signify the establishment of a satisfactory convergent validity. In addition, the composite reliability scores exceeded 0.70 (Hair et al., Citation2017). This indicates an adequate level of internal consistency. This ensures that all indicators adopted are reliable.
Figure 2. Model compute by SmartPLS.
Table 2. Convergent Validity of the Measurement Model
To ascertain discriminant validity of the measurement model, Heterotrait–Monotrait Ratio of Correlations (HTMT) was used. Table shows that all the inter-construct correlations are less than the threshold value of 0.85 (Kline, Citation2015). This indicates that the constructs are unique and dissimilar to other constructs.
Table 3. Heterotrait-Monotrait Ration of Correlations (HTMT)
After assessing the measurement model, the analysis then continued towards the structural model assessment. To obtain the path coefficients and the corresponding t-values, a bootstrapping procedure of 5000 samples was used. Table shows that the variance inflation factor (VIF) scores for all the variables are within the threshold of less than or equal to 5 (Hair et al., Citation2017). In other words, no collinearity occurs in the predictor constructs.
Table 4. Results of Structural Equation Model
In order to be deemed adequate then the R2 must be greater than the value of 0.02. According to Cohen (Citation1988), if R2 is 0.02 it means the explanatory power is weak, 0.13 means the explanatory power is moderate and 0.26 means the explanatory power is substantial. This study has shown that 50.6% of variance in satisfaction (R2 = 0.506) can be explained by the model. The model used in this study demonstrated a good explanatory power because the R2 is reasonably substantial. To determine the overall fitness of this study, the standardised root mean square residual (SRMR) was assessed. The value for SRMR is 0.055 which is below the 0.08 threshold recommended by Hu and Bentler (Citation1999). This indicates that the model presented a good model fit.
The variables that are significant and have a positive effect on satisfaction were convenience value (β = 0.195; t = 5.3), economic value (β = 0.146; t = 3.673), hedonic value (β = 0.536; t = 13.337) and sustainability value (β = 0.077; t = 2.019). Although the symbolic value (β=-0.092; t = 2.163) was found to be significant, nevertheless, the relationship turned out to be an inverse one due to the negative sign, thus rendering the effect of symbolic value on satisfaction as not significant in this study. As for the lower and upper confidence limits, all of the variables did not straddle a “0” rendering the abovementioned paths as significant except for symbolic values. Furthermore, it is also important to assess whether the exogenous constructs, which consist of convenience value, economic value, hedonic value, and sustainability value have a substantive impact on the endogenous constructs. To assess this, Cohen’s (Citation1988) criteria for the effect sizes (f2) were referred where 0.02 equals to a small effect, 0.15 as a medium effect, and 0.35 as a large effect. In this study, it was found that the hedonic value has a medium effect (f2 = 0.336) on satisfaction, while the convenience value (f2 = 0.062) and the economic value (f2 = 0.032) have a small effect. However, sustainability value has no effect (f2 = 0.009) on satisfaction. This study took a further step to evaluate predictive validity (out-of-sample prediction). PLS-predict demonstrated high predictive relevance because none of the indicators in the PLS-SEM analysis has higher RMSE values compared to the Naïve LM benchmark (Hair et al., Citation2019). It can be concluded that perceived value can significantly predict users’ satisfaction particularly among the Millennials in Malaysia. These results are shown below (Table ).
Table 5. PLS Predict
IPMA is an analysis that can identify predecessors having relatively high importance for the target construct (i.e. those that have a strong total effect but also have a relatively low performance, i.e. low average latent variable scores) (C. M. Ringle & Sarstedt, Citation2016, 1866). IPMA was conducted to extract useful insights in users’ perceived value that predict users’ satisfaction in e-hailing services. In IPMA, there are four dimensions of perceived value that exerted a significant influence on users’ satisfaction, namely, convenience value, hedonic value, economic value, and sustainability value. Figure indicates that the convenience value exhibits an overall average score of 76. However, hedonic value, economic value, and sustainability value with a performance score of 64.2, 54.5, and 53.4 were slightly below the average score of 76. Therefore, this indicates that these three values were underperforming.
Figure 3. Importance Performance Map Analysis.
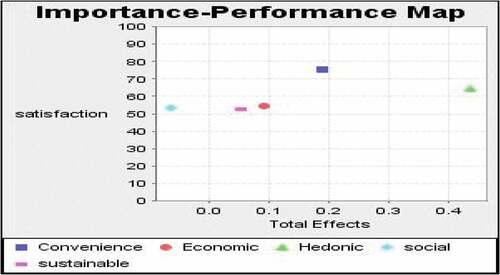
In comparison to the three other values, the hedonic value had a total effect of 0.44, and this indicates that the perceived hedonic value is important. In other words, a one-unit increase in hedonic value performance from 0.44 to 0.45 would increase the performance of satisfaction. Therefore, e-hailing organisations, particularly GrabCar, should maintain their services on convenience value. Also, they should not overlook hedonic value, sustainability value, and economic value.
2. Discussion of Findings
To address the main research question of this study: What are the critical antecedents that build satisfaction in e-hailing services? The direct effect of the convenience value, hedonic value, economic value, and sustainability value do contribute towards Millennial users’ satisfaction with e-hailing services.
Hedonic value was found to be the most salient determinant of users’ satisfaction, which illustrates that users experience enjoyment and pleasure when riding on the GrabCar especially with their friends and family. This finding is in line with the previous study (as was the case in K. Ofori et al., Citation2022).
The significant relationship between convenience value and user’s satisfaction is in line with other researchers such as Hamari et al. (Citation2016) and Hwang and Griffiths (Citation2017)’s studies on the reasons behind the use of e-hailing services. These Millennials emphasise on the convenience value considering e-hailing services allowed them to hail a car at their convenient time and reach their destination faster.
The positive effect of economic value on satisfaction has also been demonstrated in other studies such as Hamari et al. (Citation2016) and Yang and Xia (Citation2021). This indicates that the Millennials use collaborative consumption services due to cost savings. Even though Millennials tend to be price-conscious, they do recognise that e-hailing services are cheaper compared to other traditional mode of services, especially taxi services. As Kim and Jin (Citation2018) pointed out that one of the main reasons why the Millennials use sharing economic services is partly due to the influence of cost-savings.
Sustainability value was found to have a positively significant effect on satisfaction. This finding confirms the conclusion of earlier studies Arteaga-Sánchez et al. (Citation2018), where they also found that sustainability value led to users’ satisfaction. It is obvious that users are aware that e-hailing can contribute towards the sustainability of the environment. An important issue emerging from this finding is that sustainability value is relevant for e-hailing users as e-haling helps to reduce vehicle ownership (Arteaga-Sánchez et al., Citation2018).
However, unlike previous studies, this study found that symbolic value was not found to be significant due to the negative relationship symbolic value satisfaction. This finding contradicts the Li et al. (Citation2019) finding. One plausible reason is that Millennials may have come to regard the usage of e-hailing as a standard way of commuting which is part and parcel of today’s modern lifestyle. Furthermore, symbolic value could be an important value for early adopters because early adopters perceive that using e-hailing services could make them be regarded as smart, resourceful, and technology-savvy. However, after the services have reached a mature stage where more and more Millennials have used the services, Millennials no longer feel any sense of novelty about e-hailing services and that reduces the symbolic value of the services to the user.
2.1. Theoritical Contributions and Pratical Implications
From a theoretical standpoint, this study has contributed to the perceived value literature, particularly on TCV models, by providing empirically proving sustainability value as an influential variable for users’ satisfaction with e-hailing services. Several previous studies Botsman & Rogers, (Citation2011) and Tussyadiah (Citation2015) have mentioned the importance of sustainability value in sharing economics, however sustainability value was scarcely mentioned or tested empirically (Benoit et al., Citation2017; Hamari et al., Citation2016). Such a finding has validated the necessity to include sustainability value into studies on sharing economic services, especially in the context of e-hailing services. In addition, this study also proved empirically that economic value, hedonic value, and convenience value led towards user satisfaction in e-hailing services.
From the practical implications, the IPMA results provide valuable information for e-hailing organisations to improve their users’ satisfaction. The IPMA results indicate that e-hailing organisations are doing well in providing users convenience value. Due to this, e-hailing organisations should keep up their services and maintain their services in terms of continuing to provide convenience value to their users. Start-ups which aspire to jump into the bandwagon of the e-hailing services need to be mindful that providing convenience value should be at the core of their business because doing so will not only improve users’ satisfaction but also allow them to sustain in the market.
The IPMA results also indicate that hedonic value, economic value, and sustainability value will lead towards users’ satisfaction. However, through the IPMA results, e-hailing organisations are not doing enough for hedonic value, economic value, and sustainability value in their services. Furthermore, the results also indicate that hedonic value is the most important value compared to economic value and sustainability value.
To be more competitive, e-hailing organisations, particularly in their marketing communication strategies, should emphasise hedonic value by relating to the feelings associated with fun and pleasure. Furthermore, the e-hailing organisations could also highlight users’ feelings of relaxation and pleasure during the ride as part of their advertising campaign. Such messages could indirectly increase users’ emotional responses. As a result, it would potentially increase the usage of e-hailing services not only among the current users but also potential (new) users who ride with their friends. Emotional advertisement is one of the most effective ways of advertising and its benefits are well documented in the literature.
Economic value is one of the reasons why users use e-hailing services (Kim & Jin, Citation2018). However, e-hailing organisations should not take advantage of this fact by increasing prices, but instead, offer incentives or promotional rebates from time to time for their users especially the Millennials. For example, e-hailing organisations particularly GrabCar could offer promotional rebates during a term break or other monetary privileges since economic value could determine users’ staisfaction.
In this study, Millennials agreed that by using e-hailing services, they were, in some way, contributing towards the environment. However, e-hailing organisations are not doing enough to publicise the aspect of sustainability value derived from using their services. For this reason, e-hailing organisations should seriously promote and stress how e-hailing services could contribute to sustainability. For example, e-hailing organisations, particularly GrabCar, could partner with policymakers or Non-Governmental Organisation (NGO) campaigns on sustainable development programs. Alternatively, GrabCar could send a personal message to the user about how they have contributed towards the environment upon the user’s arrival at his or her destination. All these examples could help to increase users’ sustainability value and contribute to users’ satisfaction.
2.2. Limitation and Future Research
As a caveat, the scope of this study was limited to the Millennial generational cohort, which indicates that the findings are relevant to this group of respondents. Future studies can expand this study by including a wider coverage of respondents from other generational cohorts. A comparison study can also be done, especially between different generational cohorts as well as different cultural contexts, as e-hailing is still growing rapidly in other countries. Symbolic value did not show any significance in shaping users’ satisfaction towards e-hailing usage. Due to this, future undertakings can further investigate the real reasons behind this by carrying out qualitative interviews. This will not only deepen the existing knowledge on e-hailing users but also help to improve their symbolic value. Changes in government policy should also be taken into consideration in future research. For example, as of 29 May 2019, the Malaysian Government imposed a new regulation requirement where all e-hailing drivers need to undergo a test to prove they are fit to be e-hailing drivers. Due to the new regulation, e-hailing drivers will be limited in the market and demand for the services is high. As a result, this will influence users’ perception of convenience value and economic value. Therefore, future research could also factor in governments’ regulation into their research and re-examine users’ perceived value especially convenience value and economic value.
Disclosure statement
No potential conflict of interest was reported by the authors.
Additional information
Funding
References
- Anderson, R. E., & Srinivasan, S. S. (2003). E-Satisfaction and E-Loyalty: A contingency framework. Psychology and Marketing, 20(2), 123–16. https://doi.org/10.1002/mar.10063
- Arora, M., Singh, H., & Gupta, S. (2022). What drives e-hailing apps adoption? An analysis of behavioral factors through fuzzy AHP. Journal of Science and Technology Policy Management, 13(2), 382–404. https://doi.org/10.1108/JSTPM-12-2020-0177
- Arteaga-Sánchez, R., Belda-Ruiz, M., Ros-Galvez, A., & Rosa-Garcia, A. (2018, September). Why continue sharing: Determinants of behavior in ridesharing services. International Journal of Market Research, 62(6), 1–8. https://doi.org/10.1177/1470785318805300
- Asongu, S. A., Anyanwu, J. C., & Tchamyou, V. S. (2019). Technology-driven information sharing and conditional financial development in Africa. Information Technology for Development, 25(4), 630–659. https://doi.org/10.1080/02681102.2017.1311833
- Aw, E. C. X., Basha, N., Ng, S. I., & Sambasivan, M. (2019). To grab or not to grab? The role of trust and perceived value in on-demand ridesharing services. Asia Pacific Journal of Marketing and Logistics, 31(5), 1442–1465. https://doi.org/10.1108/APJML-09-2018-0368
- Babin, B. J., & Attaway, J. S. (2000). Atmospheric affect as a tool for creating value and gaining share of customer. Journal of Business Research, 49(2), 91–99. https://doi.org/10.1016/S0148-2963(99)00011-9
- Bellotti, V., Ambard, A., Turner, D., Gossmann, C., Demkova, K., & Carroll, J. M. (2015). A muddle of models of motivation for using peer-to-peer economy systems. Proceedings of the 33rd Annual ACM Conference on Human Factors in Computing Systems - CHI, Seoul, Republic of Korea. ’15, (October), 1085–1094.
- Benoit, S., Baker, T. L., Bolton, R. N., Gruber, T., & Kandampully, J. (2017). A triadic framework for collaborative consumption (CC): Motives, activities and resources & capabilities of actors. Journal of Business Research, 79(November 2016), 219–227. https://doi.org/10.1016/j.jbusres.2017.05.004
- Bonsón-Ponte, E., Carvajal-Trujillo, E., & Escobar-Rodríguez, T. (2015). Influence of trust and perceived value on the intention to purchase travel online: Integrating the effects of assurance on trust antecedents. Tourism Management, 47, 286–302. https://doi.org/10.1016/j.tourman.2014.10.009
- Botsman, R., & Rogers, R. (2010). Beyond Zipcar: Collaborative consumption. Harvard Business Review, 88(10), 30.
- Botsman, R., & Rogers, R. (2011). What’s Mine is Yours. Collins.
- Byrne, B. M. (2016). Structural equation modeling with AMOS: Basic concepts, applications and programming (3rd ed.). Routledge.
- Chi, T. (2015). Consumer perceived value of environmentally friendly apparel: An empirical study of Chinese consumers. The Journal of the Textile Institute, 106(10), 1038–1050. https://doi.org/10.1080/00405000.2014.985879
- Choong, M., & Lai, A. (2019). 42 e-hailing firms licensed to operate. The Star Online. Retrieved from https://www.thestar.com.my/news/nation/2019/10/05/41-e-hailing-firms-licensed-to-operate
- Cohen, J. (1988). Statistical power analysis for the behavioural science (2nd ed.). Lawrance Elrbaum.
- Eastman, J., Iyer, R., Liao-Troth, S., Williams, D., & Griffin, M. (2014). The role of involvement on millennials’ mobile technology behaviors: The moderating impact of status consumption, innovation, and opinion leadership. Journal of Marketing Theory and Practice, 22(4), 455–470. https://doi.org/10.2753/MTP1069-6679220407
- Elnadi, M., & Gheith, M. H. (2022). What makes consumers reuse ride-hailing services? An investigation of Egyptian consumers attitudes towards ride-hailing apps. Travel Behaviour and Society, 29, 78–94. https://doi.org/10.1016/j.tbs.2022.06.002
- Fang, Y. H., & Li, C. Y. (2022). Does the sharing economy change conventional consumption modes?. International Journal of Information Management, 67, 1–17. https://doi.org/10.1016/j.ijinfomgt.2022.102552
- Faul, F., Erdfelder, E., Buchner, A., & Lang, A. G. (2009). Statistical power analyses using G*Power 3.1: Tests for correlation and regression analyses. Behavior Research Methods, 41(4), 1149–1160. https://doi.org/10.3758/BRM.41.4.1149
- Fitzmaurice, C., & Schor, J. (2015). Collaborating and Connecting: The Emergence of the Sharing Economy. In L. Reisch & J. Thogersen (Eds.), Handbook of Research on Sustainable Consumption (pp. 410–425). Massachusetts: Edgar Elgar.
- Gaber, H. R., Elsamadicy, A. M., & Liu, G. (2021). What drives customers to continue using ride-sharing apps during the Covid-19 pandemic? The case of Iber in Egypt. Cogent Business & Management, 8(1). https://doi.org/10.1080/23311975.2021.1944009
- Gallarza, M., Arteaga, F., & Gil-Saura, I. (2019). Customer value in tourism and hospitality: Broadening dimensions and stretching the value-satisfaction-loyalty chain. Tourism Management Perspectives, 31(3), 254–268. https://doi.org/10.1016/j.tmp.2019.05.011
- Gurau, C. (2012). A life-stage analysis of consumer loyalty profile: Comparing Generation X and Millennial consumers. Journal of Consumer Marketing, 29(2), 103–113. https://doi.org/10.1108/07363761211206357
- Hair, J., Hult, G. T., Ringle, C., & Sarstedt, M. (2017). A primer on partial least squares structural equation modeling (PLS-SEM) (2nd ed). Sage Publications.
- Hair, J., Risher, J., Sarstedt, M., & Ringle, C. (2019). When to use and how to report the results of PLS-SEM. European Business Review, 31(1), 2–24. https://doi.org/10.1108/EBR-11-2018-0203
- Hamari, J., Sjoklint, M., & Ukkonen, A. (2016). The sharing economy: Why people participate in collaborative consumption. Journal of the Association for Information Science and Technology, 67(9), 2047–2059. https://doi.org/10.1002/asi.23552
- Helkkula, A., Kelleher, C., & Pihlström, M. (2012). Characterizing value as an experience: Implications for service researchers and managers. Journal of Service Research, 15, 59–75. https://doi.org/10.1177/1094670511426897
- Holbrook, M. B. (1999). Introduction to Consumer Value. (M. B. Holbrook, Ed.). Roultledge.
- Hsiao, C. H., Chang, J. J., & Tang, K. Y. (2016). Exploring the influential factors in continuance usage of mobile social Apps: Satisfaction, habit, and customer value perspectives. Telematics and Informatics, 33(2), 342–355. https://doi.org/10.1016/j.tele.2015.08.014
- Hu, L., & Bentler, P. M. (1999). Cutoff criteria for fit indexes in covariance structure analysis: Conventional criteria versus new alternatives. Structural Equation Modeling: A Multidisciplinary Journal, 6(1), 1–55. https://doi.org/10.1080/10705519909540118
- Hwang, J., & Griffiths, M. (2017). Share more, drive less: Millennials value perception and behavioral intent in using collaborative consumption services. Journal of Consumer Marketing, 34(2), 132–146. https://doi.org/10.1108/JCM-10-2015-1560
- Jiang, Y., Balaji, M. S., & Jha, S. (2019). Together we tango: Value facilitation and customer participation in Airbnb. International Journal of Hospitality Management, 82(May), 169–180. https://doi.org/10.1016/j.ijhm.2019.05.004
- Jones, M. A., Reynolds, K. E., & Arnold, M. J. (2006). Hedonic and utilitarian shopping value: Investigating differential effects on retail outcomes. Journal of Business Research, 59(9), 974–981. https://doi.org/10.1016/j.jbusres.2006.03.006
- Kim, N., & Jin, B. E. (2018). Why buy new when one can share? uncovering dimensions of collaborative consumption of consumer goods. International Textile and Apparel Association Annual Conference Proceedings, Cleveland, Ohio. 1–4.
- Kline, R. (2015). Principles and practice of structural equation modeling. The Guildford Press, New York, London.
- Lee, E. J., & Overby, J. W. (2004). Creating value for online shoppers: Implications for satisfaction and loyalty. Journal of Consumer Satisfaction, Dissatisfaction and Complaining Behavior, 17(January 2004), 54–58.
- Lee, C. K. H., & Wong, A. O. M. (2021). Antecedents of consumer loyalty in ride-hailing. Transportation Research Part F: Traffic Psychology Behaviour, 80, 14–33. https://doi.org/10.1016/j.trf.2021.03.016
- Li, J., Xu, L., Yao, D., & Mao, Y. (2019, July). Impacts of symbolic value and passenger satisfaction on bus use. Transportation Research Part D: Transport and Environment, 72, 98–113. https://doi.org/10.1016/j.trd.2019.04.012
- Luchs, M., Naylor, R. W., Rose, R., Catlin, J., Gau, R., Kapitan, S., & Weaver, T. (2011). Toward a sustainable marketplace: Expanding options and benefits for consumers. Journal of Research for Consumers, 19(2011), 1–12.
- MacKenzie, S. B., & Podsakoff, P. M. (2012). Common method bias: Nature, causes, and procedural remedies. Journal of Retailing, 88(January), 556–562. https://doi.org/10.1016/j.jretai.2012.08.001
- Möhllmann, M. (2015). Collaborative consumption: Determinants of satisfaction and the likelihood of using a sharing economy option again. Journal of Consumer Behaviour, 14(3), 193–207. https://doi.org/10.1002/cb.1512
- Mordor Intelligence. (2022), “Taxi market - growth, trends, Covid-19 impact and forecasts (2022-2027)”, Mordor Intelligence, available at: www.mordorintelligence.com/industry-reports/taxi-market (accessed 29 July 2022).
- Newcomer, E., & Lee, Y. (2018). Uber is said to reach agreement on Southeast Asia sale to Grab. Retrieved March 30, 2018, from Bloomberg Quint website: https://www.bloombergquint.com/business/uber-is-said-to-reach-agreement-on-southeast-asian-sale-to-grab#gs.vbraBcI
- Ofori, K., Anyigba, H., Adeola, O., Junwu, C., Osakwe, C., & West, O. (2022).
- Oreg, S. (2003). Resistance to change: Developing an individual differences measure. The Journal of Applied Psychology, 88(4), 680–693. https://doi.org/10.1037/0021-9010.88.4.680
- Park, W., Jaworski, B., & Maclnnis, D. (1986). Strategic brand concept image management. Journal of Marketing, 50(4), 135–145. https://doi.org/10.1177/002224298605000401
- Phipps, M., Ozanne, L., Luchs, M., Subrahmanyan, S., Kapitan, S., Catlin, J., Weaver, T. & Weaver, T. (2013). Understanding the inherent complexity of sustainable consumption: A social cognitive framework. Journal of Business Research, 66(8), 1227–1234. https://doi.org/10.1016/j.jbusres.2012.08.016
- Pihlström, M., & Brush, G. J. (2008). Comparing the perceived value of information and entertainment mobile services. Psychology & Marketing, 25(8), 732–755. https://doi.org/10.1002/mar.20236
- Podsakoff, P. M., MacKenzie, S. B., Lee, J. -Y., & Podsakoff, N. P. (2003). Common method biases in behavioral research: A critical review of the literature and recommended remedies. The Journal of Applied Psychology, 88(5), 879–903. https://doi.org/10.1037/0021-9010.88.5.879
- Pop, R. A., Hledik, E., & Dabija, D. C. (2023). Predicting consumers’ purchase intention through fast fashion mobile apps: The mediating role of attitude and the moderating role of COVID-19. Technolgical Forecasting and Social Change, 186(Part A), 122111. https://doi.org/10.1016/j.techfore.2022.122111
- Qureshi, S. (2012). Discovering development from information technologies: Does open access to technology improve the lives of people? Information Technology for Development, 18(3), 181–184. https://doi.org/10.1080/02681102.2012.702858
- Razli, I. A., Jamal, S. A., & Zahari, M. S. (2017). Perceived value in peer-to-peer (P2P) accommodation: A case of Airbnb. Journal of Tourism, Hospitality & Culinary Arts, 9(2), 213–224.
- Reinartz, W., Haenlein, M., & Henseler, J. (2009). An empirical comparison of the efficacy of covariance-based and variance-based SEM. International Journal of Research in Marketing, 26(4), 332–334. https://doi.org/10.1016/j.ijresmar.2009.08.001
- Ringle, C. M., & Sarstedt, M. (2016). Gain more insight from your PLS-SEM results. Industrial Management & Data Systems, 116(9), 1865–1886. https://doi.org/10.1108/IMDS-10-2015-0449
- Ringle, C. C. M., Wende, S., & Becker, J. M. (2015). SmartPLS 3.
- Rintamäki, T., Kuusela, H., & Mitronen, L. (2007). Identifying competitive customer value propositions in retailing. Managing Service Quality: An International Journal, 17(6), 621–634. https://doi.org/10.1108/09604520710834975
- Ruiz, D. M., Gremler, D. D., Washburn, J. H., & Carrión, G. C. (2008). Service value revisited: Specifying a higher-order, formative measure. Journal of Business Research, 61(12), 1278–1291. https://doi.org/10.1016/j.jbusres.2008.01.015
- Shamsudin, M. F., Bakar, A. R., & Hashim, F. (2023). Understanding passengers’ satisfaction and loyalty towards ridesharing services. Global Business and Organizational Excellence, 42(2), 29–44. https://doi.org/10.1002/joe.22176
- Sheth, J. N., Newman, B. I., & Gross, B. L. (1991). Why we buy what we buy: A theory of consumption values. Journal of Business Research, 22(2), 159–170. https://doi.org/10.1016/0148-2963(91)90050-8
- Sigala, M., & Sigala, M. (2006). Mass customisation implementation models and customer value in mobile phones services: Preliminary findings from Greece. Managing Service Quality, 16(4), 395–420. https://doi.org/10.1108/09604520610675720
- Stollery, A., & Jun, S. H. (2017). The antecedents of perceived value in the Airbnb context. Asia Pacific Journal of Innovation and Entrepreneurship, 11(3), 391–404. https://doi.org/10.1108/APJIE-12-2017-040
- Sweeney, J. C., & Soutar, G. N. (2001). Consumer perceived value: The development of a multiple item scale. Journal of Retailing, 77, 203–220. https://doi.org/10.1016/S0022-4359(01)00041-0
- Tanrikulu, C. (2021). Theory of consumption values in consumer behaviour research: A review and future research agenda. Intenrational Journal of Consumer Studies, 45(6), 1–21. https://doi.org/10.1111/ijcs.12687
- Tehseen, S., Ramayah, T., & Sajilan, S. (2017). Testing and controlling for common method variance: A review of available methods. Journal of Management Sciences, 4(2), 142–168. https://doi.org/10.20547/jms.2014.1704202
- Teo, T. S. H., & Pok, S. H. (2003). Adoption of WAP-enabled mobile phones among Internet users. Omega, 31(6), 483–498. https://doi.org/10.1016/j.omega.2003.08.005
- Tussyadiah, I. P. (2015). An exploratory study on drivers and deterrents of collaborative consumption in travel. Information & Communication Technologies in Tourism, 2015, 1070–1082.
- Tussyadiah, I. P. (2016). Factors of satisfaction and intention to use peer-to-peer accommodation. International Journal of Hospitality Management, 55(October 2017), 70–80. https://doi.org/10.1016/j.ijhm.2016.03.005
- Woodruff, R. B. (1997). Customer value: The next source for competitive advantage. Journal of the Academy of Marketing Science, 25(2), 139–153. https://doi.org/10.1007/BF02894350
- Yang, H., & Xia, L. (2021). Leading the sharing economy: An exploration on how perceived value affecting customers’ satsifaction and willingness to pay by using DiDi. Journal of Global Scholars of Marketing Science, 32(1), 54–76. https://doi.org/10.1080/21639159.2020.1808833
- Zhu, G., So, K. K. F., & Hudson, S. (2017). Inside the sharing economy: Understanding consumer motivations behind the adoption of mobile applications. International Journal of Contemporary Hospitality Management, 29(9), 2218–2239. https://doi.org/10.1108/IJCHM-09-2016-0496