
 ?Mathematical formulae have been encoded as MathML and are displayed in this HTML version using MathJax in order to improve their display. Uncheck the box to turn MathJax off. This feature requires Javascript. Click on a formula to zoom.
Abstract
This bibliometric analysis of earnings management (EM) literature work published between 2000 and 2022 sheds light on the growth of knowledge and research in the field. The study analyzed 1383 papers from the Scopus Core Collection database and evaluated various factors such as year of publication, journal, author, institution, nation, affiliation, subject area, and term analysis. The findings showed that EM is a heavily studied topic, with a significant growth in publications in 2020 (162). Most research was centered in the United States, China, Australia, and the United Kingdom. The study provides a comprehensive review of the EM literature and identifies broad research trends in the field. The findings highlight the most pressing concerns in this field and suggest new avenues for exploration. It enlighten on the social and intellectual structure of the domain, which may benefit policymakers in the field of EM. The findings also draw attention to the growing interest among researchers in studying earnings management and suggest opportunities for exploring the dynamics of EM in emerging economies. This study aims to provide a valuable resource for researchers, policymakers, and practitioners by demonstrating on the current state of EM research. Findings shows that early study focused on demographic and socioeconomic characteristics, but later studies included issues like earnings smoothing, earnings with societal effect, corporate governance, audit quality, stock returns and corporate social responsibility, which affect earnings quality. The findings of this study can inform future research by highlighting areas in need of further exploration and gaining a deeper understanding of the challenges and opportunities in the field of EM.
1. Introduction
Since, earnings management (EM) continues to bring it to the attention of academicians and practitioners as a significant economic and social concern throughout the world (Alhadab & Clacher, Citation2018; Ali & Bansal, Citation2021; Buertey et al., Citation2020; Choi et al., Citation2022; El Diri et al., Citation2020; Kuo et al., Citation2021; M. Lee & Hwang, Citation2019; Widagdo et al., Citation2021; Wu & Zhou, Citation2022; Y. Zhang et al., Citation2018). The former Chairman of the Securities and Exchange Commission (SEC), Arthur Levitt, used the term “The Number Game” that firms modified their accounting information in order to meet certain goals (Levitt, Citation1998, p. 14). Earnings are considered an essential element in financial statements since they are characterized by the end result in the profit and loss statement of the corporations, and they characterize an entity’s financial performance (Cudia & Dela Cruz, Citation2018; Dechow, Citation1994; Ghazalat et al., Citation2017; Kighir et al., Citation2013; Rahman et al., Citation2013). The openness of generally accepted accounting principles allows managers to exercise some discretion in calculating reported earnings, which may or may not properly reflect the company’s current financial condition (Prior et al., Citation2008). EM is “the practice of taking purposeful efforts within the boundaries of generally accepted accounting principles (GAAP) to achieve about an optimal level of reported earnings.” (Schipper, Citation1989, p. 92). (Citation1999) provide one of the most often-used definitions of EM. According to Healey & Whalen, “earnings management occurs when managers use judgement in financial reporting and transaction structuring to alter financial reports to either mislead some stakeholders about the fundamental economic performance of the company or to influence contractual outcomes that rely on reported accounting numbers” (Healy & Wahlen, Citation1999). According to Fischer and Rosenzweig (Citation1995), earnings management is defined by as efforts taken by division managers to inflate or (reduce) existing reported earnings of a department without a matching increase or (decrease) in the division’s long-term economic profitability. “Real activities manipulation is a break from usual operational processes, motivated by managers’ aim to deceive at least some stakeholders into believing that specific financial reporting targets have been accomplished in the normal course of operations,” according to Roychowdhury (Citation2006). According to the SEBI Data Research Group (Ajit et al., Citation2013), non-financial businesses in India manage an average of 2.9% of their total assets as earnings, and it is one of the most notable studies on EM in the Indian context (Ajit et al., Citation2013). EM may be viewed as the application of several accounting procedures; the primary objective of this is to generate income statements in such a manner that the commercial activity of a business, and its financial status, are presented in a better way. For this reason, various accounting regulations and standards compel corporate managers to formulate their judgments. Thus, EM evaluates how accounting procedures might be applied and financial information created to boost or offset firm income (Belas et al., Citation2018). There are two viewpoints on EM: The opportunistic approach claims that management teams strive to deceive investors, whereas the information approach, first articulated by Holthausen and Leftwich (Citation1983), possesses that managerial discretion is a medium for managers to expose to shareholders their personal anticipations about the company’s future cash flows. Detecting EM practices is a difficult task. Several methodologies have been used in the literature, each with its own set of features. To begin with, there is a substantial body of studies attempting to detect discretionary accruals (DACC) using the relationship between total accruals (TACC) and theorized explanatory variables (Ajit et al., Citation2013). TACC and change in total accruals were utilized as metrics of management’s discretion over earnings by Healy (Citation1985) and DeAngelo (Citation1986), respectively. In order to take into consideration NDACC factors while calculating accruals, Jones (Citation1991) devised a regression method that establishes a linear link between TACC and shifts in sales and PPE. As a result, DACC may be used as a proxy for EM, allowing researchers and practitioners to identify and measure EM levels because of these analytical and methodological breakthroughs. Finally, this research adds crucial additions to the current literature, broadening and increasing understanding regarding EM.
The most crucial task for developing a specific study area is synthesizing previous research results. To make sense of past results, researchers have historically relied on two approaches: (i) systematic literature review, which takes the qualitative technique, and (ii) meta-analysis, which takes the quantitative method (Schmidt, Citation2008). Bibliometric techniques (such as network analysis, co-citation analysis and bibliographic coupling) create structural representations of scientific domains using bibliographic data from published databases. They provide an element of objectivity to the process of evaluating scientific literature (Garfield, Citation1979), and they may be utilized to identify informal research networks, sometimes known as “invisible colleges,” which are hidden below the surface but are not officially affiliated with one another (Crane, Citation1972; Price, Citation1965). Bibliometric analysis is a quantitative approach used to study scientific research and scholarly publication. This method involves the use of bibliographic databases to collect, analyze, and interpret data related to the publication and citation patterns of academic research. Bibliometric analysis provides important insights into the research productivity, collaboration patterns, impact, and visibility of different academic fields, institutions, and individual researchers (Crane, Citation1972; Garfield, Citation1979; Price, Citation1965; Schmidt, Citation2008). One of the main applications of bibliometric analysis is to evaluate the impact of scientific research. This is done by analyzing the number of times a research paper has been cited in other academic works. The number of citations is seen as an indicator of the influence and impact of the research, and can be used to rank researchers, institutions, and academic fields. The most widely used bibliometric indicator for measuring the impact of research is the h-index, which takes into account both the number of publications and their cumulative citation impact (Crane, Citation1972; Price, Citation1965).
The first part of this paper provides a summary of a wide variety of bibliometric metrics derived from citation mapping and content analysis of the most cited EM research articles, including total citations, citations per article, top journals, most relevant institutions, and most impacting nations on the issue. These metrics will be of great interest to researchers looking to further their understanding of the study’s origins, progress, and current state. Second, this research uses a bibliometric examination of scientific output as an inductive method to look at how this particular field of study has evolved through time. Third, this study adds to the literature by emphasizing emerging areas of inquiry like EM with CSR and the development of EM. etc. Lastly, based on a survey of highly cited EM research publications, this research presents future prospects for EM-related studies and suggests those results as future study fields. Notably, we used Biblioshiny, R package and VOSviewer, a bibliometric tool that helps analyze keyword density in research networks and authorship partnerships, to create a network density map. The results of these investigations have shed light on the most recent developments in this field of study. Hence, this study adds to the conceptual evolution of research on EM since it enables researchers to determine the significant research topics, relevant approaches and the potential for exploring untapped issues. In short, the fundamental contribution of this work is the discovery of various kinds of literature. The goals of this literature review are threefold: (i) to look at the latest findings in the study of EM; (ii) to highlight theoretical views; and (iii) to propose avenues for future study in this area. We used VOSviewer, a scientific mapping programme, to conduct the bibliometric study. Then, in order to define the theoretical viewpoints and suggest further study, Biblioshiny R packages were applied. This study helps advance the fields of EM in three ways: (i) The article includes a comprehensive literature analysis of the primary issues and theoretical ideas; (ii) it adds a systematic literature review technique and insights by examining the past and current of EM research; and (iii) it suggests new research directions by highlighting the gaps in the existing literature.
The current research brings the following unique contributions. In the first place, this is the first EM-related, broad-based bibliometric study that has identified major research themes and directions based on citation mapping and content analysis of the most cited EM research papers. This was accomplished by comparing the most cited EM research publications to each other. Second, this paper is unique among research publications because it provides a comprehensive EM conceptual model that includes the key elements of EM with regards to managers, stakeholders, practise indicators, suppliers, and performance metrics, thereby broadening the scope of bibliometric citation analysis. Third, this study contributes to the literature by highlighting the state of the art in terms of identifying current research topics, including EM, the EM model, and emerging research trends, the interaction between EM and CSR and CG, and EM related measures.
There are five sections to the research. In the first section, titled “Introduction,” the objectives of the study, the primary focus, and what makes this paper special are outlined. The following section presents the theoretical layout and important information concerning EM, together with a complete survey of the researchers working on this topic. The third part of this paper explains the study’s aims, procedures, and data analysis strategy. The citation mapping of the EM literature is discussed in further depth of the bibliometric study and its limits are discussed in the next section.
1.1. Models to detect EM
1.1.1. The Healy model (1985)
In the year 1985, Healy came up with one of the early models for discretionary accrual. The model uses the median of total accruals multiplied by lagged total assets out from anticipated period as a proxy for NDACC. The Healy (Citation1985) model presumes a mean reversion mechanism for non-discretionary accruals. This suggests the following non-discretionary accruals model.
Where:
NDACC connotes projected non-discretionary accruals
The acronym TA stood for “total accruals multiplied by lagging total assets.”
t = 1, 2… The year T is subscripted to indicate its presence within the estimating timeframe.
1.1.2. The DeAngelo model (1986)
The underlying assumption of DeAngelo’s (Citation1986) model is that NDACC follows a random walk pattern. To calculate NDACC, the DeAngelo’s (Citation1986) model “scales total accruals (TAt-1) by lagged total assets (At-2)”. The estimating period for NDACC is limited to data from the prior year in the DeAngelo model, which may be seen as a specific example of the Healy model. When DACC follow a random walk, Dechow (Citation1994) contends that the DeAngelo model is much more widely accepted for usage, whereas the Healy method is suitable. Discretionary accruals are determined by a white noise algorithm centred on a steady mean.
Where:
stands for “non-discretionary accrual at time t”
stands for “total accrual at time t − 1”
= “Total Asset at time t 2”.
1.1.3. The Jones model (1991)
Attempting to account for the effect of external factors on a company’s NDACC, Jennifer Jones (Citation1991) provides a model. This model was published in the journal Accounting and Finance. According to her, non-discretionary accruals are determined by changes in total assets, gross income, and gross PPE. According to the Jones (Citation1991) model, gross PPE accounts for non-discretionary accruals relating to depreciation expenditure, while sales revenue serves as a stand-in for the economic events that lead to current non-discretionary accruals. As a result, the Jones (Citation1991) model is predicated on two central tenets. First off, it is believed that sales income is uncontrolled. Second, it is presumable that variations in sales revenue cause changes in current assets and liabilities. For non-discretionary accruals in the event year, the Jones (Citation1991) model is
Wherever:
= Multiplying the firm’s total assets in year t by the ratio of its revenue in year t minus its revenue in year t-1;
= The entire value of a company’s gross property, plant, and equipment in year t, scaled by the total asset in year t-1;
= whole assets as of time 1; and
= variables specific to the company.
During the estimating phase, the following model is used to obtain estimates of the company parameters :
1.1.4. The modified jones model (1995)
Since NDACC are expected to emerge due to sales variations, the Jones (Citation1991) model has a significant flaw in that it is unable to capture the influence of sales-based manipulation, which is a fundamental limitation of the model (Dechow et al., Citation1995). Dechow et al. (Citation1995) suggested making an adjustment to the standard-Jones model in an effort to address this constraint. In contrast to the original Jones model (Jones, Citation1991), which assumes that the second stage is identical to the first, the modified Jones model (Jones, Citation1991) assumes that the change in debtors (REC) is deducted from REV (EquationEquation 55
5 ). Using a three-stage methodology, the original Jones model (Jones, Citation1991) divides TA into their discretionary (controlled) and non-discretionary parts. The following definitional equation estimates total accruals (TA) in the first stage.
Where,
TA = Total accruals,
ΔCA = difference in current assets
ΔCL = shift in current liabilities (CL)
Δ Cash = shift in cash and cash equivalents
ΔSTD = shift in debt included in CL
Dep = costs associated with depreciation and amortization
A = Total Assets
In the second step of the process, calculating NDACC requires using the Modified Jones Model (1995). This is the model.
Here, ,
, and
are the parameters for the year t that are unique to the company,
= variation in income relative to TA;
= shifts in receivables scaled by TA;
= gross PPE scaled by TA; and
During the estimating phase, estimations of the firm-specific factors ,
, and
are obtained using EquationEquation 7
(7)
(7) ). Regression of total accruals on the shifts in sales (REV) and the PPE.
The model is thus:
The variable descriptions are identical to those in the previously covered equations. The OLS estimates of ,
, and
, are represented by the letters
,
, and
respectively. The values of
,
, and
were found using the standard Jones Model.
1.1.5. Industry model
In a manner that is comparable to that of the Jones model (Jones, Citation1991), the presupposition that NDACC will remain the same over time is removed from consideration by the industry model. NDACC follow an industry model that is
The modified Jones model is one of the models that is often used in empirical research. Comparing the Healy, DeAngelo, original Jones model, and industry model, Dechow et al. (Citation1995) found that the modified Jones model (MJM) offers the most efficient assessment of EM. The MJM was shown to perform better by Dechow et al. (Citation1995) when they assessed the functioning of the different models outlined above in terms of description (i.e., the chance of a Type 1 mistake) and power (i.e., probability of making a Type II errors). The findings of Dechow et al. are also supported by Guay et al. (Citation1996) as well as Peasnell et al. (Citation2000). Compared to the Healy, DeAngelo, and regular Jones and industry models, Dechow et al. (Citation1995) show that a MJM gives the most powerful test of EM (Ajit et al., Citation2013).
2. Literature review
The phenomenon of EM has become a global concern for economies, and it has been steadily expanding in the previous two periods (Alves, Citation2012; Hashim et al., Citation2013). Several studies have been conducted to evaluate the Modified Jones model’s effectiveness. According to Guay et al. (Citation1996), the Jones and MJM are both consistent discretionary accruals (DACC) estimates. The studies of Dechow et al. (Citation1995) and Peasnell et al. (Citation2000) also viewed that the Jones and MJM may operate as effective EM tests. According to early investigations, the motives for EM include agency issues and knowledge asymmetries (Davidson et al., Citation2005; Fields et al., Citation2001). Because EM may be used to gain remuneration and secure employment, managers can take advantage of information asymmetry between insiders and outside investors to hide genuine financial performance (Healy & Wahlen, Citation1999). Another kind of information asymmetry that might impact market liquidity is the quality of earnings (Bar Yosef & Prencipe, Citation2013). Empirical results from Hardingham et al. (Citation2018) show how consolidated accrual models that fail to take long-term earnings growth into account are likely misspelt and can result in erroneous conclusions about earnings behaviour.
McNichols (Citation2000) addressed three procedures. The author addressed the features of the three most regularly utilized designs in EM. There are three types of accrual models: specific accrual models, aggregate accrual models, and access to frequency distribution. McNichols has suggested that progress in EM research would result from particular accruals, which seems to be one of the key motivations for the usage of aggregated accrual models. The fundamental issue author identifies in her papers is that stimulus theories for enabling accrual management and institutional knowledge of accrual behaviour have gotten ahead of empirical approaches for cumulative accrual research. Hirst et al. (Citation2008) explored the prognosis of EM, classifying earnings forecasts by three separate subsets (antecedents, features, and repercussions) that correlate to the chronology connected with earnings projections. The authors documented that much of the existing research focused on why and how one assumption or forecast feature influences predictions and does not explore interrelations between the three components. Executive remuneration is more directly tied to the value of the securities, according to studies by (Cheng et al., Citation2005; Bergstresser and Philippon (Citation2006); and Jiang et al. (Citation2010), and such “incentivized” executives engage in greater degrees of EM. Many studies have investigated the correlation between EM and audit quality. Evidence suggests that Big 6 audited companies had lower DACC than non-Big 6 audited companies, according to research by Becker et al. (Citation1998) and Francis et al. (Citation1999). Based on these findings, it’s clear that audit quality greatly affects the intensity of EM. According to research conducted by Leuz et al. (Citation2003), which was based on a comparative examination of 31 different nations, the amount of EM reduces as investors are given more protection. According to the findings of research performed by Yu (Citation2008), EM is significantly low in businesses with high analyst attention levels. After the implementation of IFRS (in 2005), research was conducted by Ianniello (Citation2015). On Italian firms indicated that audit committees and board independence significantly impact EM. In their study, Asghar et al. (Citation2020) aim to investigate the moderating effect EM has on the association between CG and firm value as well as CG and risk in the context of Pakistan’s rising economy. Findings demonstrate that CG eliminates the possibility that managers will engage in opportunistic activity and reduces the likelihood that fraudulent acts will be practised due to EM techniques. Orazalin (Citation2020) aims to determine how top public firms in Kazakhstan manage their profitability and if other board qualities, such as gender diversity, impact them. The empirical findings demonstrate that corporations with more gender diversity on their boards are more successful at limiting their ability to control profitability. The results further corroborate the study’s theoretical framework by showing that organizations with more giant boards use more conservative approaches for managing profits. The findings, however, provide little provision for the premise that board independence and profits quality are related. El Diri et al. (Citation2020) investigate how real earnings management (REM) and accrual management (AEM) vary in large and small concentrated markets, as well as how CG plays a role in reducing such actions in both kinds of markets. Comparing concentrated and non-concentrated markets, researchers find that businesses in concentrated markets use greater accrual and REM. In addition, the authors account that CG, in the form of excellent board features, is more successful in reducing EM in non-concentrated markets than it is in concentrated markets. Other studies and their context with findings are exhibited in Table , and the description of the data is shown in Table .
Table 1. Meta-analysis of the previous literature
Table 2. Description of the data
The primary goal of this research is to provide the current status of EM research, with the following questions defining the study’s scope.
RQ 1. What is the number of articles on this topic, their development trend, and regional distribution?
RQ 2. Which scholars have emerged as the most prominent in this field’s literature?
RQ 3. What areas of study have had the most significant impact in this field?
RQ 4. How have earnings management publications evolved across time, authors, sources, fields, affiliated nations and institutions, research types, and economies?
RQ 5. What has evolved over time, and what are the current research trends in this field?
Finally, this article adds to the current literature by widening and deepening our understanding of earnings management.
3. Research methodology
This section discusses the techniques for assessing the corpus of current empirical literature in order to identify potential research gaps and knowledge limitations (Fahimnia et al., Citation2015; Tranfield et al., Citation2003).
3.1. Analytical instruments
For this study, we used VOSviewer, RStudio, and Excel software programs. A new R Integrated Development Environment is called RStudio (IDE). All of R’s instruments (source editing, console, history, graphics, help, etc.) are intended to be integrated into a single, efficient workspace by the open-source project RStudio (Allaire, Citation2012). Networks of scholarly publications, researchers, nations, keywords, or ideas may be built using VOSviewer. Item connections in these networks may be made via co-occurrence, co-authorship, or co-citation relationships (Van Eck & Waltman, Citation2020). As the visuals in RStudio were not readily editable, we used Microsoft Excel to create editable tables and figures as an addition. Finally, gaps in the literature were found using content analysis.
3.2. The bibliometric methodology
According to Pritchard (Citation1969), bibliometrics is “the application of mathematical and statistical methods to articles and other forms of communication” (p. 349). It quantitatively tracks the development of a subject through a body of papers, minimizing researcher prejudice and giving a broad overview of the field (Merigó et al., Citation2015). Due to its impartiality and ability to handle enormous volumes of data, bibliometric analysis has been utilized by many scholars (Donthu et al., Citation2021; Merigó et al., Citation2015). Two bibliometric approaches are scientific mapping and performance analysis (Baier-Fuentes et al., Citation2018; Donthu et al., Citation2021). Recent developments in computer software analytics, for example, VOSviewer, which includes graphical descriptions, may now make it possible to do bibliometric research (Donthu et al., Citation2021; Srivastava & Sivaramakrishnan, Citation2021). The implementation of quantitative approaches is covered by bibliometric methodology i.e., study of bibliographic information (including citation analysis) (e.g., units of publication and citation) (e.g. name of the source, a country doing more research and co-citation analysis) (Broadus, Citation1987; Pritchard & Pritchard, Citation1969).
The two methods of performance analysis that are most frequently used are citation analysis and explanatory assessment (established on citations and built on publications) (Donthu et al., Citation2021). It is possible to evaluate the success of individual articles, authors, countries, and journals based on the number of citations and number of publications they receive (Donthu et al., Citation2021). However, feature networking may be made using the data from the scientific modelling for articles depending on their characteristics (Donthu et al., Citation2021; Zupic & Čater, Citation2015). In this survey report, we employed bibliometric analysis to look at I publishing trends, (ii) top nations, (iii) top journals, (iv) top articles, (v) top authors, (vi) key terms, and (vii) a network of author-created research clusters.
4. Results and discussion
4.1. Keywords analysis
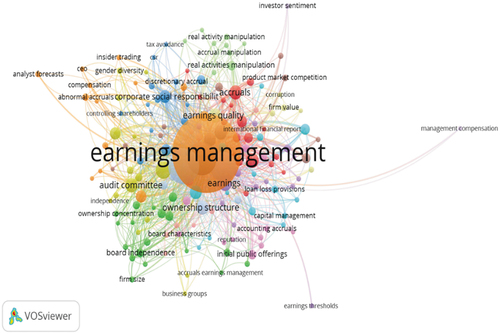
Utilizing co-occurrence analysis, significant terms were examined. Author keywords were employed since they denote the substance of an article, whereas a semantic map of keywords shows the conceptual framework of a study field (Donthu et al., Citation2021). When two or more keywords appear together in a single article, it is presumed that they are strongly linked (Donthu et al., Citation2021). A total of 440 keywords from the recently evaluated literature were used in this review study. There were 51 keywords because the threshold for keyword occurrence was set at three times. Generic terms were manually omitted, such as country names, research methods, analytical tools, and group keywords for earnings management. Thus, just the 20 most crucial terms were highlighted (see Figure ). In 2017, research trends centred on “ethics,” “ownership,” and “investor protection,” and in 2020, they will be on “governance approach,” “gender diversity,” and “financial reporting” (see Figure ). The focus of the CSR and EM study is between 2017 and 2020.
Figure 1. The author’s keywords represent the themes of research publications.
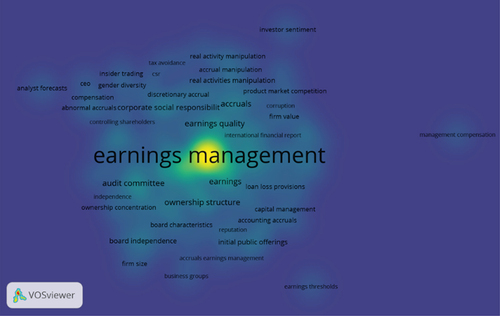
The themes of research publications are represented by the author’s keywords (Comerio & Strozzi, Citation2019). Keyword analysis was carried out using the VOS Viewer to discover the most common themes in earnings management. A total of 2341 keywords were identified in 1381 papers. Table shows the top keywords used in EM research from 2000 to 2021. With 1127 occurrences, “earnings management” is the most commonly used keyword, indicating that this keyword is used as a termed concept in the literature. The other three most frequently used keywords are “corporate governance” (232 occurrences), “real earnings management” (197 occurrences) and “discretionary accruals” (158 occurrences). Figure depicts the keywords density of the notion of earnings management. The most used keyword with EM is earnings quality followed by ownership structure, audit committee, CSR, and other variables of CG. The method in which an audit committee can avoid EM is by supervising the external auditor. The company’s financial statements must be audited by the external auditor, who must also provide an opinion on whether or not they are presented honestly in all material areas. The audit committee plays a significant role in selecting and managing the external auditor, and it is responsible for ensuring that the auditor is independent and impartial. By ensuring that the external auditor is independent and impartial, the audit committee can help to prevent earnings management. The ownership structure of a firm may have a substantial impact on how it manages its earnings. Investors and regulators should be aware of a company’s ownership structure and how it may influence its profits management strategies. The way an audit committee may avoid EM is to ensure that the company’s financial reporting adheres to generally accepted accounting principles (GAAP) or international financial reporting standards (IFRS). These accounting standards ensure that financial results are reported in a consistent and transparent manner by providing guidance on how financial information should be presented and conveyed. The effectiveness of a board in carrying out its oversight duties is significantly dependent on elements such as board size, board independence, board characteristics, and board diversity. Studies indicate that boards with a diverse membership and a majority of independent directors are better able to resist profits management.
Table 3. Keywords analysis
4.2. Most productive authors
Table profiles the 25 most prominent and relevant writers in the field of EM research. Articles published by these authors concentrate on earnings management from various angles and offer a comprehensive review of all of the important studies in the field. New theoretical groundwork is due in part to these writers as well as empirical tests of old theories, improving EM research and providing a foundation for future research. The h-index is a metric used to evaluate the productivity and impact of a scholar or scientist’s published work. It was introduced by J.E. Hirsch in 2005 and has since become a widely used measure of research impact. The h-index is calculated based on the number of articles published by an author and the number of citations those articles have received. The m-index is calculated by dividing the total number of citations received by an author by the number of years since their first publication. The m-index provides a more accurate measure of an author’s productivity by taking into account the length of their career, as well as the impact of their work. On the basis of author’s impact, the most productive author is Kim J B with h_index of 7 and total citations is 1092. Alhadab M is the second most productive author having h-index 6 with a total number of citation 131, followed by Campa 6 h_index and 82 total citations and the list goes on.
Table 4. The authors’ impact
4.3. Publication trend
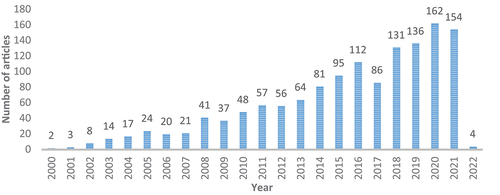
There is a general upward tendency in the number of papers produced each year. Substantial growth can be observed in Figure . Note that the lower number of articles in 2022 is due to the literature search for this study in early 2022. The publishing trend indicates a growing interest in EM research (see Figure ). From 24 articles to 48, just double the number reached from 2005 to 2010 on the notion of EM. Then, in 2019, there were 136 publications; in 2020, there were 162, the highest number of publications, a significant rise. With an R-squared value of 0.9187, this topic has a remarkably strong yearly publishing increase.
Figure 2. Publication trend over the period.
4.4. Three-field plot
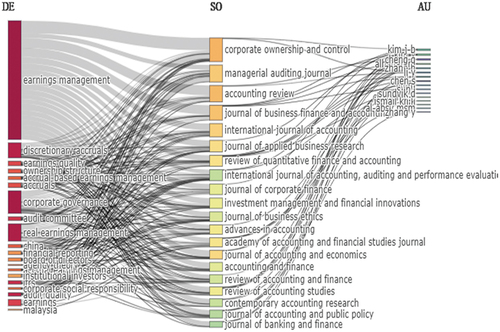
The Three-field plot is a bibliometric analysis tool that provides a visual representation of the distribution of publication productivity, collaboration patterns, and publication impact in a specific field of study or scientific community (Koo, Citation2021). This plot is created by plotting the number of publications, the number of authors, and the average number of citations per publication on three separate axes. The x-axis represents the number of publications, the y-axis represents the number of authors, and the size of each dot represents the average number of citations per publication. This plot allows for the identification of different patterns in the publication behavior of authors and the impact of their work. Three-field plot is a valuable tool for bibliometric analysis, as it provides a visual representation of the distribution of publication productivity, collaboration patterns, and publication impact in a specific field of study or scientific community (Ingale & Paluri, Citation2022). It allows for the identification of key players in a scientific community and provides insights into the collaboration and publication behavior of authors. The three-field plot illustrate the connections between influential authors, major EM keywords, and high-impact journals (Phoong et al., Citation2022). As a result, the three-field plot depicts an intriguing link between the three key study sites. The figure illustrates the primary author is depicted together with their most frequently used keywords and the most cited articles from the most prestigious journals in the field. The data given by this three-field plot could aid scholars in identifying key earnings management authors who could be approached for collaboration, and top journals can be targeted accordingly (Riehmann et al., Citation2005). One can also determine the critical research subfields that can be investigated further. Furthermore, knowledge of the acceptance of the three-field plot helps authors locate or contact more suitable publications. As shown in Figure , Kim J B is the leading researcher working on the keywords EM and published in the journal corporate ownership and control. Ownership structure is heavily studied with EM as shown in Figure . The ownership structure describes who owns and controls a business. A company’s ownership structure may significantly affect how it manages its earnings. The practise of adjusting financial outcomes to match or exceed predetermined expectations is known as earnings management. Investors and regulators should be aware of a company’s ownership structure and how it may affect its methods for managing earnings. Another word is audit committee shown by the three field plot with EM. The governance structure of a firm should include an audit committee. Its major responsibility is to supervise the financial reporting procedure and make sure it complies with all applicable rules and regulations and is accurate and transparent. The prevention of EM, which is the practise of altering financial results to meet or exceed specific expectations, is one of the areas in which an audit committee is particularly crucial. The function of an audit committee in avoiding earnings management is very crucial. The first method an audit committee may prevent EM is by making sure that the company’s financial reporting complies with generally accepted accounting principles (GAAP) or international financial reporting standards (IFRS). These accounting standards serve to guarantee that financial results are reported in a uniform and transparent way by offering direction on how financial information should be presented and communicated. The audit committee may aid in preventing EM by monitoring the financial reporting process and making sure it complies with these criteria.
Figure 3. Three field plot Method: Author, Source and Keywords.
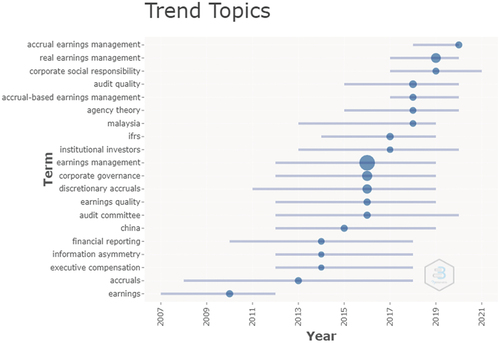
4.5. Topics in the trend
The research world is constantly changing and evolving, and with it, the topics that are in EM trend, drawing the attention of researcher a lot. In recent times, there have been a number of topics that have been trending with EM are accrual earnings management, REM, CSR, and audit quality as depicted in Figure . In EM also, AEM as well as REM are the two subdivided proxies used for measuring the earnings quality. The theories pinpointing the issue of EM are agency theory, stakeholder theory, and signal theory. EM is studied much in Malaysian context as analyzed by Figure . In 2021, the main topic for EM was AEM, REM, starting from executive compensation, information asymmetry, and IFRS. Agency theory, stakeholder theory, and signalling theories are being pinpointed to address the issue of EM with CSR and CG variables like board independence, board size, ownership structures, and board characteristics etc. As these variables play a crucial role in earnings management studies. In order to ensure successful and efficient management of a company’s activities, boards are essential. The success of a board in carrying out its oversight responsibilities depends heavily on factors including board size, independence, characteristics, and diversity. According to studies, boards with a diversified membership and a majority of independent directors are better equipped to prevent earnings management. Therefore, it is crucial for businesses to make sure that the members of their boards have the knowledge, experience, and diversity needed to conduct efficient monitoring.
Figure 4. The trend of the topic over the period.
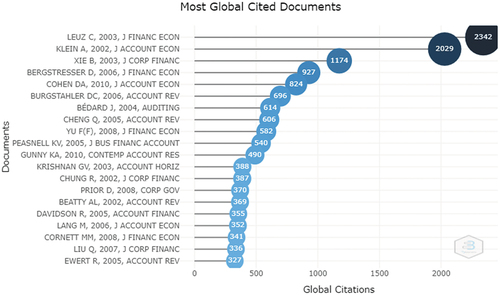
4.6. Most globally cited documents
There are several documents that are widely cited and referenced globally. Some of the most notable include: Leuz C, published in 2003, in the Journal of Finance Economics followed by the document of Klein A, in 2003, Xie B, 2003, Bergstresser D, 2006 so on as depicted in Figure . Again in 2010, the Journal of Accounting Economics published a document authored by Cohen DA. Rest of the progress can be visualized by Figure .
Figure 5. Most globally cited documents.
4.7. Prominent journals
“A co-citation is a connection between two things that are both cited by the same document,” as previously said (Van Eck & Waltman, Citation2020, p. 26). Table shows the prominent journal in this field of investigation.
Table 5. Top journal in earnings management research
The search in the titles, abstracts, and keywords of English documents (research papers, review papers, letters, and commentaries) indexed since 2000 in the following Scopus databases returned 1383 resources on 31 January 2022: Science Citation Index Expanded, Social Sciences Citation Index, and Emerging Sources Citation Index.
Nodes in a network can be divided into different clusters, with the power of edges connecting cluster nodes being higher than that of other clusters (Leydesdorff et al., Citation2017).
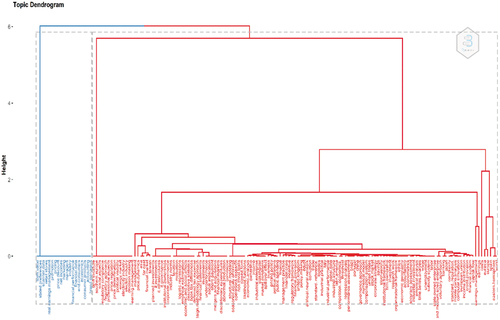
4.8. Method: Multiple correspondence analysis
Factorial analysis is a statistical technique used to identify the underlying structure of a set of variables. It is used to determine which variables are important, and how they interact with each other by breaking down complex relationships into simpler components. The factorial analysis is a powerful tool that is used in many fields, including psychology, sociology, marketing, and engineering. The goal of the factorial analysis is to reduce the number of variables in a dataset by identifying the underlying factors that are driving the observed relationships. These factors are called latent variables and can be thought of as underlying causes of the observed variables. By reducing the number of variables, factorial analysis makes it easier to understand the data’s underlying structure and make predictions about future relationships. In a dendrogram, the relationships between keywords are shown to be hierarchical since they are derived from clustering different study subfields. The following graphic depicts the dendrogram of Earnings management, which contains four primary subjects of EM study. The first grouping of terms from the left in the dendrogram indicates an Earnings management-oriented study issue. Similarly, interconnected themes centring on REM and DACC are seen in the other keywords outside of EM. As depicted in Figure , earnings quality is at the highest level in terms of the number of nodes. Followed by discretionary accruals, non-discretionary accruals, and AEM. EM can take many different forms, such as manipulating the system to recognise income, inflating assets, and understating liabilities. Firms can misrepresent their financial accounts using two different strategies: real earnings management and accrual earnings management. Even though they could provide comparable results, each method’s fundamental assumptions and driving forces are unique. Real earnings management describes the steps businesses take to tamper with their transactions or processes in order to obtain desired financial results. Real earnings management is frequently employed to achieve or surpass financial goals, impress investors, or improve a company’s creditworthiness. On the other side, accrual earnings management entails working with accruals, which are non-cash transactions noted on the financial statements. Accounts receivable, Accounts Payable, and Depreciation are some examples of accruals. In spite of the real cash flows created by their activities, companies can manipulate accruals to either boost or decrease reported earnings.
Figure 6. Factorial analysis: Keywords plus.
In this section, we will examine a specific country’s bibliometric review to better understand its scientific production of different countries in the notion of EM. The bibliometric analysis also provides valuable information on the collaboration patterns between researchers, institutions, and countries. It enables the examination of the extent of collaboration within and between different academic fields and identifies the most productive collaborations and research networks. This information is essential for understanding the dynamics of scientific collaboration and can help guide the development of scientific policies and strategies. Authors from more than 51 nations provided research on EM for more than 1150 papers. The United States (781), China (408), Indonesia (209), Malaysia (193), Australia (183), the United Kingdom (148), South Korea (124), Tunisia (107), Spain (104), Canada (103), and are among the top 10 leading nations as shown in Table and Figure .
Figure 7. Total publications by country.
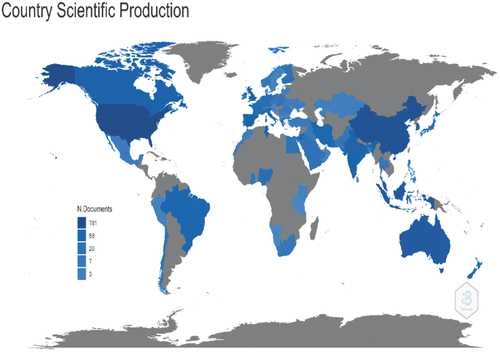
Table 6. Countries and number of documents
Table depicts the number of citations as well as the average article citation statistics. USA leads by the highest total number of citations followed by Hong Kong, i.e. 1931 total number of citations. In terms of average citation, Hong Kong is on the top having the average article citations 120.69.
Table 7. Country-wise statistics in terms of citations
A bibliometric review reveals that the country has a lower average citation count compared to other leading countries in the field. This suggests that its research may not have the same level of international recognition or influence as the research produced by other countries. Additionally, the data shows that the country has a low percentage of publications in top-tier journals, indicating a lower quality and impact level. Despite having a high or lower average citation count depending upon a country’s production and fewer top-tier publications, the country’s high level of productivity and the impact of its research on the economy is noteworthy. To continue to thrive and compete on the global stage, the country may need to focus on improving the quality and impact of its research while maintaining its high level of productivity.
4.9. Keyword co-occurrence networks
Every published article often includes a few keywords below the abstract, exposing essential aspects of the study reported in that piece (Grames et al., Citation2019). Some of the most important keywords are utilized often in the articles. Keyword co-occurrence, or the repeated occurrence of keywords together, sends vital meanings to the audience. Keyword co-occurrence networks are a type of data visualization that provides a graphical representation of the relationship between keywords in a large text corpus. This approach is often used in natural language processing and information retrieval to understand the context in which words are used and the associations between different words. In a keyword co-occurrence network, keywords are represented as nodes, and the edges between nodes represent the frequency of co-occurrence between two keywords in the text corpus (Radhakrishnan et al., 217 and Linnenluecke et al., Citation2020). The strength of the edge can be determined by the number of times two keywords appear together, the proximity of the keywords, or the significance of the relationship between the keywords. The size of the nodes can also be adjusted to reflect the frequency of use of a particular keyword in the text corpus. The main benefits of using keyword co-occurrence networks is that they provide a quick and easy way to identify patterns and relationships in large amounts of text data. For example, in a scientific paper, a keyword co-occurrence network can be used to identify the main topics and subtopics of the paper and to see how they are related (Grames et al., Citation2019 Radhakrishnan et al., 217; Linnenluecke et al., Citation2020). This can help researchers to better understand the structure of the paper and to identify any potential gaps in the literature. The most common keywords used together in a study field are identified using keyword co-occurrence analysis. This co-occurrence reveals a number of closely connected study subareas that are highly correlated and share a common research background (Su & S. S. Lee, Citation2010). As a result, this type of study indicates the closeness of a research field to others. Figure shows the primary EM research keywords that combine and have established links. Earnings quality, ownership structure, audit committee, CSR, AEM and REM are some co-occurred keywords with EM. Keywords that occur frequently with the notion EM are earnings quality, audit committee, board independence, ownership structure, and board characteristics. Studies with these keywords plays a crucial role in preventing earnings management. By good CG practices, companies may lessen the danger of manipulation and increase trust with their stakeholders by making sure that there are checks and balances in place and by encouraging openness and accountability. Additionally, businesses can put internal controls in place to track down and stop fraud, as well as conduct regular audit to ensure that these controls are working effectively in curbing EM. Having more diverse boards will help them perform their oversight duties more efficiently. This is due to the fact that diverse boards are more likely to provide a variety of viewpoints and experiences, which may aid in detecting and reducing risks.
Figure 8. Keyword co-occurrence networks.
4.9. Co-citation analysis
Initial presentations of the concept of a co-citation analysis were made by Small (Citation1973) & Pilkington and Liston Heyes (Citation1999). This approach is commonly used in bibliometric analysis to investigate the intellectual structure of the most prominent publications on a topic. The greater the number of times that two articles are referenced together, the closer in topic they are (Culnan, Citation1987). Co-citation analysis is a method of evaluating the importance of scientific papers, articles, or authors by analyzing the frequency with which they are cited together by other researchers (Jeong et al., Citation2014; Surwase et al., Citation2011). The idea behind this method is that papers or authors that are often cited together are likely to be related or have similar research interests, and therefore, they are likely to be more influential or important in their respective fields (Zhao et al., Citation2019). Co-citation analysis is often used as a complementary method to traditional bibliometric indicators such as impact factors, h-index, and publication count. Unlike these traditional indicators, co-citation analysis provides a more nuanced picture of the relationships between papers, authors, and fields, and can provide valuable insights into the intellectual structure and evolution of a field over time (Boyack & Klavans, Citation2010; Hou et al., Citation2018; Jeong et al., Citation2014; Surwase et al., Citation2011). Co-citation analysis is a valuable method for evaluating the importance and impact of scientific papers, authors, and fields. By analyzing the co-citation patterns of papers and authors, it is possible to gain valuable insights into the intellectual structure and evolution of a field and to identify emerging trends, influential authors, and areas of research that are likely to be more impactful (Jeong et al., Citation2014). Co-citation analysis looks at how frequently two papers are referenced all together by other articles and may thus be thought of as a publication proximity metric (Zhao et al., Citation2019).
4.10. Co-author analysis
Co-author Analysis is a field of study that aims to understand the relationships and dynamics between co-authors in scientific research (S. S. Lee, Citation2010). This can be a useful tool for researchers, publishers, and institutions to evaluate the productivity and impact of individual authors, as well as the research groups and institutions they are associated with. The primary method for conducting co-author analysis is through the examination of collaboration networks (Chun, Citation2015). These networks provide a visual representation of the relationships between authors and can be used to identify patterns and trends in collaboration. For example, a densely connected cluster of authors may indicate a strong collaborative relationship, while a dispersed network may indicate a more individualistic approach to research (Park & Nam, Citation2016). One key benefit of co-author analysis is that it provides a more comprehensive view of an author’s contributions to their field of study. Unlike traditional metrics such as the number of publications or citations, co-author analysis considers the role that the author played in each collaboration and the impact of that collaboration on the scientific community (Chung, Citation2021). This allows for a more nuanced understanding of an author’s contributions, particularly in interdisciplinary fields where a single publication may have a broader impact than others (Moon & Kim, Citation2018). Zhang, Cheng, Alhadab, Kim, Goel, and Zhu are the co- author who mostly worked as co-authors as depicted in Figure .
Figure 9. Co-author analysis.
4.11. Bibliocoupling
Bibliocoupling is a concept in bibliometrics that refers to the relationship between two publications based on the citations they share (Weinberg, Citation1974). This relationship can be used to identify co-citation patterns and to understand the relationships between different research fields and disciplines. Bibliocoupling analysis can be applied to individual papers, authors, journals, or even entire research fields. It can provide insights into the research landscape, including the evolution of research topics, the emergence of new fields, and the interdisciplinary nature of research. One of the key benefits of bibliocoupling analysis is that it provides a more comprehensive view of the relationships between different pieces of research. Unlike traditional metrics such as citations or impact factors, bibliocoupling considers the nature of the relationships between papers rather than just the number of citations (Van Eck & Waltman, Citation2010). This allows for a deeper understanding of how different research fields are interconnected and how research builds upon previous work. Bibliocoupling can also be used to identify key players in a particular area of study (Weinberg, Citation1974). For example, by examining the bibliocoupling relationships between papers, researchers can identify which authors or institutions are most closely linked to the most influential research in their field. This information can be used to identify key players in an area and to understand the relationships between them, which can provide insight into the dynamics of research collaboration (Dehghanbanadaki et al., Citation2020).
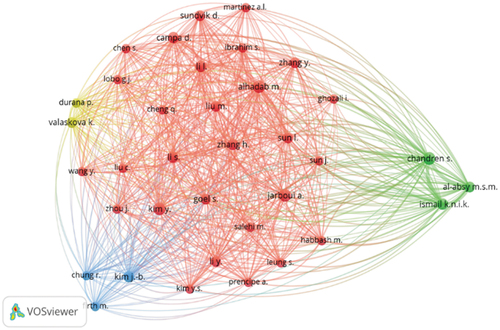
Table present the cluster analysis, the minimum no. of an author’s documents is five & minimum no. of citations of an author is also five, so a total of 2744 authors, 36 meet the threshold. 36 items and 4 clusters. One can analyze form the Table , that cluster 1 analyses the most items the number of items are 28, in cluster 2 and 3, only three items are clustered together. The prominent authors are clustered in 1 for example Alhadab, Campa, Chen, Ghozali all are on the top level.
Table 8. Cluster analysis
The data clustering methodology produces the fundamental groups of articles, which are referred to as clusters. These clusters contain articles that were written by the same researchers and pertain to the same area of research.
5. Conclusions and implication
This review article uses bibliometric analysis, and bibliophily analysis, of the theme EM research articles to achieve three study aims. This review paper illuminates the knowledge and possibilities for aspiring researchers to explore future avenues after major findings from the history and present of EM research. The research on EM that was published between 2000 and 2022 in Scopus-indexed papers was thoroughly and scientifically analyzed in this study. The findings need to help aspiring researchers who are interested in carrying out EM studies in the broadest but most reliable sense. In conclusion, bibliometric analysis is a valuable tool for understanding academic research’s impact, collaboration, and visibility. By providing important insights into the scientific enterprise, bibliometric analysis can help researchers, institutions, and policymakers make informed decisions and strategies. However, it is important to recognize and address the limitations of bibliometric analysis to ensure that the results of the analysis are accurate and meaningful. According to the findings, the multidisciplinary area of study that encompasses the topics of earnings management has progressed over the course of time. In the early phases of the area’s development, researchers concentrated their attention on demographic and socioeconomic variables, but, throughout time, the discipline began to incorporate themes such as earnings smoothing, earnings with societal impact, and corporate governance as well as corporate social responsibility dimensions that influence the quality of earnings. It is believed by researchers’ that companies practising CSR may be less inclined to indulge in earnings manipulations because they put stakeholders’ needs ahead of their own in the long run. Results shows that an independent audit committee may be in charge of analyzing financial statements to make sure they are accurate and compliant with accounting rules in a corporation with sound corporate governance. In order to maintain the external auditor’s independence and objectivity, the audit committee may also have the authority to employ the good quality of earnings. The goal of the corporate board is to manage risks, protect the interests of shareholders, and make sure that management choices are in line with the company’s objectives. Financial reporting is one of the key responsibilities of boards. The efficacy of the board in carrying out its responsibilities is greatly influenced by its size. Large boards may struggle to properly make decisions and perform their monitoring responsibilities. According to studies, boards with a predominance of independent directors are more efficient at monitoring earnings quality. More diversified boards are better equipped to provide effective supervision. This is due to the increased likelihood that diverse boards will bring a range of viewpoints and experiences to the table, which may aid in detecting and reducing risks. This research exposes not only the conceptual structure of the domain but also the intellectual and social structure of the domain. This work sheds significant light on topics that demand more research and offers vital new insights.
6. Limitations
Despite its numerous advantages, bibliometric analysis is not without its limitations. One of the main limitations is the bias inherent in the data sources used for the analysis. For example, data from bibliographic databases may be incomplete and may not accurately reflect the total number of citations or the full impact of research. Additionally, some fields’ citation patterns may differ, making comparisons between areas difficult. Limitations of co-citation analysis are, for example, it can be influenced by publication bias, self-citation, and citation manipulation. Therefore, it is important to use co-citation analysis in conjunction with other metrics and to carefully interpret the results. Because this study is based on a bibliometric evaluation, it is subject to the typical constraints associated with that type of research. A comprehensive literature analysis would be beneficial for future scholars to establish a robust conceptual framework. The Scopus database was used for this study’s science mapping because it provides access to more high-quality articles in structured forms that are compatible with the Bibliometrix programme. The current research sheds light on the EM literature. It draws attention to the most pressing concerns in the field and suggests new avenues for exploration. It elucidates the domain’s social and intellectual structure, enlightening future scholars about the developing topics, settings, and possibilities of cooperation in this field. Policymakers in the field of earnings management may benefit greatly from the paper’s findings.
Disclosure statement
No potential conflict of interest was reported by the authors.
References
- Ajit, D., Malik, S. A. R. A. T., & Verma, V. K. (2013). Earnings management in India. SEBI DRG Study, 1–28.
- Alhadab, M., & Clacher, I. (2018). The impact of audit quality on real and accrual earnings management around IPOs. The British Accounting Review, 50(4), 442–461. https://doi.org/10.1016/j.bar.2017.12.003
- Alharbi, S., Al Mamun, M., & Atawnah, N. (2021). Uncovering real earnings management: Pay attention to risk taking behavior. International Journal of Financial Studies, 9(4), 53. https://doi.org/10.3390/ijfs9040053
- Ali, A., & Bansal, M. (2021). Impact of upward and downward earnings management on stock returns. South Asian Journal of Business Studies, (ahead-of-print). https://doi.org/10.1108/SAJBS-12-2020-0417
- Allaire, J. (2012). Rstudio: Integrated development environment for R. Boston, MA, 770(394), 165–171.
- Almahrog, Y., Ali Aribi, Z., & Arun, T. (2018). Earnings management and corporate social responsibility: UK evidence. Journal of Financial Reporting and Accounting, 16(2), 311–332. https://doi.org/10.1108/JFRA-11-2016-0092
- Alquhaif, A., Al-Gamrh, B., Latif, R. A., & Chandren, S. (2021). Board independence tenure and real earnings management: Accretive share buyback activities in Malaysia. International Journal of Business Governance and Ethics, 15(3), 266–284. https://doi.org/10.1504/IJBGE.2021.116533
- Alves, S. (2012). Ownership structure and earnings management: Evidence from Portugal. Australasian Accounting Business & Finance Journal, 6(1), 57–74.
- Asghar, A., Sajjad, S., Shahzad, A., & Matemilola, B. T. (2020). Role of discretionary earning management in corporate governance-value and corporate governance-risk relationships. Corporate Governance the International Journal of Business in Society, 20(4), 561–581. https://doi.org/10.1108/CG-11-2019-0347
- Baier-Fuentes, H., Merigó, J. M., Amorós, J. E., & Gaviria-Marin, M. (2018). International entrepreneursip, an overview from bibliometric analysis. International Entrepreneurship and Management Journal, 15(2), 385–429. https://doi.org/10.1007/s11365-017-0487-y
- Bansal, M., Ali, A., & Choudhary, B. (2021). Real earnings management and stock returns: Moderating role of cross-sectional effects. Asian Journal of Accounting Research, 6(3), 266–280. https://doi.org/10.1108/AJAR-11-2020-0107
- Bar Yosef, S., & Prencipe, A. (2013). The impact of corporate governance and earnings management on stock market liquidity in a highly concentrated ownership capital market. Journal of Accounting, Auditing & Finance, 28(3), 292 316. https://doi.org/10.1177/0148558X13492591
- Becker, C. L., DeFond, M. L., Jiambalvo, J., & Subramanyam, K. R. (1998). The effect of audit quality on earnings management. Contemporary Accounting Research, 15(1), 1–24. https://doi.org/10.1111/j.1911-3846.1998.tb00547.x
- Beck, P. J., & Narayanamoorthy, G. S. (2013). Did the SEC impact banks’ loan loss reserve policies and their informativeness? Journal of Accounting and Economics, 56(2–3), 42–65. https://doi.org/10.1016/j.jacceco.2013.06.002
- Belas, J., Gavurova, B., & Toth, P. (2018). Impact of selected characteristics of SMES on the capital structure. Journal of Business Economics and Management, 19(4), 592–608. https://doi.org/10.3846/jbem.2018.6583
- Ben Amar, A., & Chakroun, S. (2018). Do dimensions of corporate social responsibility affect earnings management? Evidence from France. Journal of Financial Reporting and Accounting, 16(2), 348–370. https://doi.org/10.1108/JFRA-05-2017-0033
- Bergstresser, D., & Philippon, T. (2006). CEO incentives and earnings management. Journal of Financial Economics, 80(3), 511–529. https://doi.org/10.1016/j.jfineco.2004.10.011
- Berrill, J., Campa, D., & O’hagan-Luff, M. (2021). Firm diversification and earnings management strategies: European evidence. International Review of Financial Analysis, 78, 101955. https://doi.org/10.1016/j.irfa.2021.101955
- Bhattacharya, U., Daouk, H., & Welker, M. (2003). The world price of earnings opacity. The Accounting Review, 78(3), 641–678. https://doi.org/10.2308/accr.2003.78.3.641
- Boyack, K. W., & Klavans, R. (2010). Co‐citation analysis, bibliographic coupling, and direct citation: Which citation approach represents the research front most accurately? Journal of the American Society for Information Science and Technology, 61(12), 2389–2404. https://doi.org/10.1002/asi.21419
- Broadus, R. N. (1987). Toward a definition of “bibliometrics”. Scientometrics, 12(5–6), 373 379. https://doi.org/10.1007/BF02016680
- Buertey, S., Sun, E. J., Lee, J. S., & Hwang, J. (2020). Corporate social responsibility and earnings management: The moderating effect of corporate governance mechanisms. Corporate Social Responsibility and Environmental Management, 27(1), 256–271. https://doi.org/10.1002/csr.1803
- Burgstahler, D., & Dichev, I. (1997). Earnings management to avoid earnings decreases and losses. Journal of Accounting and Economics, 24(1), 99–126. https://doi.org/10.1016/S0165-4101(97)00017-7
- Cheng, Q., Warfield, T., & Ye, M. (2005). Equity Incentives and Earnings Management. Equity Incentives and Earnings Management, the Accounting Review, 80(2), 441–476. https://doi.org/10.2308/accr.2005.80.2.441
- Chen, R. C., & Hung, S. W. (2021). Exploring the impact of corporate social responsibility on real earning management and discretionary accruals. Corporate Social Responsibility and Environmental Management, 28(1), 333–351. https://doi.org/10.1002/csr.2052
- Chih, H. L., Shen, C. H., & Kang, F. C. (2008). Corporate social responsibility, investor protection, and earnings management: Some international evidence. Journal of Business Ethics, 79(1–2), 179–198. https://doi.org/10.1007/s10551-007-9383-7
- Choi, A., Lee, E. Y., Park, S., & Sohn, B. C. (2022). The differential effect of accrual-based and real earnings management on audit fees: International evidence. Accounting and Business Research, 52(3), 254–290. https://doi.org/10.1080/00014788.2021.1911779
- Chun, H. (2015). The comparison of coauthor networks of two statistical journals of the Korean Statistical Society using social network analysis. Journal of the Korean Data and Information Science Society, 26(2), 335–346. https://doi.org/10.7465/jkdi.2015.26.2.335
- Chung, E. (2021). An investigation on the network analysis papers by content analysis and bibliometric analysis. Journal of the Korean Society for Information Management, 38(1), 169–190.
- Comerio, N., & Strozzi, F. (2019). Tourism and its economic impact: A literature review using bibliometric tools. Tourism Economics, 25(1), 109–131. https://doi.org/10.1177/1354816618793762
- Crane, D. (1972). Invisible colleges: Diffusion of knowledge in scientific communication. The University of Chicago Press.
- Cudia, C. P., & Dela Cruz, A. C. (2018). Determinants of earnings management choice among publicly listed industrial firms in the Philippines. DLSU Business & Economics Review, 27(2), 119 129.
- Culnan, M. J. (1987). Mapping the intellectual structure of MIS, 1980-1985: A co-citation analysis. MIS Quarterly, 11(3), 341–353. https://doi.org/10.2307/248680
- Davidson, R., Goodwin Stewart, J., & Kent, P. (2005). Internal governance structures and earnings management. Accounting & Finance, 45(2), 241–267. https://doi.org/10.1111/j.1467-629x.2004.00132.x
- DeAngelo, L. (1986). Accounting numbers as market valuation substitutes: A study of management buyouts of public stockholders. The Accounting Review, 61, 400 420.
- Dechow, P. M. (1994). Accounting earnings and cash flows as measures of firm performance: The role of accounting accruals. Journal of Accounting and Economics, 18(1), 3–42. https://doi.org/10.1016/0165-4101(94)90016-7
- Dechow, P. M., Sloan, R. G., & Sweeney, A. P. (1995). Detecting earnings management. Accounting Review, 70, 193–225. https://www.jstor.org/stable/248303
- DeFond, M. L., & Park, C. W. (2001). The reversal of abnormal accruals and the market valuation of earnings surprises. The Accounting Review, 76(3), 375–404. https://doi.org/10.2308/accr.2001.76.3.375
- Dehghanbanadaki, H., Seif, F., Vahidi, Y., Razi, F., Hashemi, E., Khoshmirsafa, M., & Aazami, H. (2020). Bibliometric analysis of global scientific research on Coronavirus (COVID-19). Medical Journal of the Islamic Republic of Iran, 34, 51. https://doi.org/10.47176/mjiri.34.51
- Donthu, N., Kumar, S., Mukherjee, D., Pandey, N., & Lim, W. M. (2021). How to conduct a bibliometric analysis: An overview and guidelines. Journal of Business Research, 133, 285–296. https://doi.org/10.1016/j.jbusres.2021.04.070
- El Diri, M., Lambrinoudakis, C., & Alhadab, M. (2020). Corporate governance and earnings management in concentrated markets. Journal of Business Research, 108, 291–306. https://doi.org/10.1016/j.jbusres.2019.11.013
- Fahimnia, B., Sarkis, J., & Davarzani, H. (2015). Green supply chain management: A review and bibliometric analysis. International Journal of Production Economics, 162, 101–114. https://doi.org/10.1016/j.ijpe.2015.01.003
- Fields, T. D., Lys, T. Z., & Vincent, L. (2001). Empirical research on accounting choice. Journal of Accounting and Economics, 31(1–3), 255–307. https://doi.org/10.1016/S0165-4101(01)00028-3
- Fischer, M., & Rosenzweig, K. (1995). Attitudes of students and accounting practitioners concerning the ethical acceptability of earnings management. Journal of Business Ethics, 14(6), 433–444. https://doi.org/10.1007/BF00872085
- Francis, J. R., Maydew, E. L., & Spark, H. C. (1999). The role of big 6 auditors in the credible reporting of accruals, auditing. AUDITING: A Journal of Practice & Theory, 18(2), 17–34. https://doi.org/10.2308/aud.1999.18.2.17
- Frank, M. M., Lynch, L. J., & Rego, S. O. (2009). Tax reporting aggressiveness and its relation to aggressive financial reporting. The Accounting Review, 84(2), 467–496. https://doi.org/10.2308/accr.2009.84.2.467
- Garfield, E. (1979). Is citation analysis a legitimate evaluation tool? Scientometrics, 1(4), 359–375. https://doi.org/10.1007/BF02019306
- Ghazalat, A. N. M., Islam, M. A., & Noor, I. B. M. (2017). Impact of internal ownership on the monitoring and mitigating mechanisms of earnings management practices. Corporate Ownership & Control, 14(2), 289–295. https://doi.org/10.22495/cocv14i2c2p2
- Gonçalves, T., Gaio, C., & Ferro, A. (2021). Corporate social responsibility and earnings management: Moderating impact of economic cycles and financial performance. Sustainability, 13(17), 9969. https://doi.org/10.3390/su13179969
- Grames, E. M., Stillman, A. N., Tingley, M. W., & Elphick, C. S. (2019). An automated approach to identifying search terms for systematic reviews using keyword co‐occurrence networks. Methods in Ecology and Evolution, 10(10), 1645–1654. https://doi.org/10.1111/2041-210X.13268
- Guay, W. R., Kothari, S. P., & Watts, R. L. (1996). A market-based evaluation of discretionary accrual models. Journal of Accounting Research, 34, 83–105. https://doi.org/10.2307/2491427
- Hardingham, E., Vrbka, J., Kliestik, T., & Kliestikova, J. (2018). Will cognitive technology-driven automation lead to economic growth? Journal of Self-Governance and Management Economics, 6(4), 13.
- Hashim, H. A., Salleh, Z., & Ariff, A. M. (2013). The underlying motives for earnings management: Directors perspective. International Journal of Trade, Economics and Finance, 4(5), 296 299. https://doi.org/10.7763/IJTEF.2013.V4.304
- Healy, P. M. (1985). The effect of bonus schemes on accounting decisions. Journal of Accounting and Economics, 7(1–3), 85–107. https://doi.org/10.1016/0165-4101(85)90029-1
- Healy, P. M., & Wahlen, J. M. (1999). A review of the earnings management literature and its implications for standard setting. Accounting Horizons, 13(4), 365 383. https://doi.org/10.2308/acch.1999.13.4.365
- Hirst, D. E., Koonce, L., & Venkataraman, S. (2008). Management earnings forecasts: A review and framework. Accounting Horizons, 22(3), 315–338. https://doi.org/10.2308/acch.2008.22.3.315
- Holthausen, R. W., & Leftwich, R. W. (1983). The economics consequences of accounting choice. Journal of Accounting and Economics, 5(2), 77 117. https://doi.org/10.1016/0165-4101(83)90007-1
- Hou, J., Yang, X., & Chen, C. (2018). Emerging trends and new developments in information science: A document co-citation analysis (2009–2016). Scientometrics, 115(2), 869–892. https://doi.org/10.1007/s11192-018-2695-9
- Ianniello, G. (2015). The effects of board and auditor independence on earnings quality: Evidence from Italy. Journal of Management & Governance, 19(1), 229–253. https://doi.org/10.1007/s10997-013-9285-2
- Ingale, K. K., & Paluri, R. A. (2022). Financial literacy and financial behaviour: A bibliometric analysis. Review of Behavioral Finance, 14(1), 130–154. https://doi.org/10.1108/RBF-06-2020-0141
- Jeong, Y. K., Song, M., & Ding, Y. (2014). Content-based author co-citation analysis. Journal of Informetrics, 8(1), 197–211. https://doi.org/10.1016/j.joi.2013.12.001
- Jiang, J., Petroni, K. R., & Wang, I. Y. (2010). Cfos and CEOs: Who Have the most influence on earnings management? Journal of Financial Economics, 96(3), 513–526. https://doi.org/10.1016/j.jfineco.2010.02.007
- Jin, J., Kanagaretnam, K., & Lobo, G. J. (2018). Discretion in bank loan loss allowance, risk taking and earnings management. Accounting & Finance, 58(1), 171–193. https://doi.org/10.1111/acfi.12210
- Jones, J. J. (1991). Earnings management during import relief investigations. Journal of Accounting Research, 29(2), 193 228. https://doi.org/10.2307/2491047
- Kighir, A., Omar, N., & Mohamed, N. (2013). Opportunities, motivations and approaches of earnings management: A structured theoretical review of the corporate virus. International Journal of Auditing Technology, 1(3/4), 312 329. https://doi.org/10.1504/IJAUDIT.2013.057730
- Kim, K. S., Lee, J. H., & Park, Y. W. (2021). Acquiring firms’ earnings management in stock for stock mergers within Korean business groups. Managerial Finance.
- Kim, J. B., & Sohn, B. C. (2013). Real earnings management and cost of capital. Journal of Accounting and Public Policy, 32(6), 518–543. https://doi.org/10.1016/j.jaccpubpol.2013.08.002
- Koo, M. (2021). Systemic lupus erythematosus research: A bibliometric analysis over a 50-year period. International Journal of Environmental Research and Public Health, 18(13), 7095. https://doi.org/10.3390/ijerph18137095
- Kothari, S. P., Leone, A. J., & Wasley, C. E. (2005). Performance matched discretionary accrual measures. Journal of Accounting and Economics, 39(1), 163–197. https://doi.org/10.1016/j.jacceco.2004.11.002
- Kuo, Y. F., Lin, Y. M., & Chien, H. F. (2021). Corporate social responsibility, enterprise risk management, and real earnings management: Evidence from managerial confidence. Finance Research Letters, 41, 101805. https://doi.org/10.1016/j.frl.2020.101805
- Lee, S. S. (2010). A preliminary study on the co-author network analysis of Korean library & information science research community. Journal of Korean Library and Information Science Society, 41(2), 297–315. https://doi.org/10.16981/kliss.41.2.201006.297
- Lee, M., & Hwang, I. T. (2019). The effect of the compensation system on earnings management and sustainability: Evidence from Korea banks. Sustainability, 11(11), 3165. https://doi.org/10.3390/su11113165
- Leuz, C., Nanda, D., & Wysocki, P. D. (2003). Earnings management and investor protection: An international comparison. Journal of Financial Economics, 69(3), 505–527. https://doi.org/10.1016/S0304-405X(03)00121-1
- Levitt, A. (1998). The numbers game. Journal of Quantitative Criminology, 68(1), 14 19. https://doi.org/10.1023/A:1023096425367
- Leydesdorff, L., Bornmann, L., & Wagner, C. S. (2017). Generating clustered journal maps: An automated system for hierarchical classification. Scientometrics, 110(3), 1601–1614. https://doi.org/10.1007/s11192-016-2226-5
- Linnenluecke, M. K., Marrone, M., & Singh, A. K. (2020). Conducting systematic literature reviews and bibliometric analyses. Australian Journal of Management, 45(2), 175–194. https://doi.org/10.1177/0312896219877678
- Manzon, G. B. & Plesko. G. A. (2002). The Relation Between Financial and Tax Reporting Measures of Income. SSRN Journal. https://doi.org/10.2139/ssrn.264112
- McNichols, M. F. (2000). Research design issues in earnings management studies. Journal of Accounting and Public Policy, 19(4–5), 313–345. https://doi.org/10.1016/S0278-4254(00)00018-1
- Merigó, J. M., Mas-Tur, A., Roig-Tierno, N., & Ribeiro-Soriano, D. (2015). A bibliometric overview of the Journal of Business Research between 1973 and 2014. Journal of Business Research, 68(12), 2645–2653. https://doi.org/10.1016/j.jbusres.2015.04.006
- Moon, S., & Kim, I. (2018). The influence of authors’ centrality on research performance in a large-scale collaborative research network. Journal of Information Technology Services, 17(2), 179–190.
- Orazalin, N. (2020). Board gender diversity, corporate governance, and earnings management: Evidence from an emerging market. Gender in Management: An International Journal, 35(1), 37–60. https://doi.org/10.1108/GM-03-2018-0027
- Park, J. H., & Nam, E. (2016). Intra-and inter-institutional collaborative pairing trends of lis field in south korea. Libri, 66(2), 125–136. https://doi.org/10.1515/libri-2015-0096
- Peasnell, K., Pope, P., & Young, S. (2000). Detecting earnings management using cross-sectional abnormal accrual models. Accounting and Business Research, 30(4), 313–326. https://doi.org/10.1080/00014788.2000.9728949
- Phoong, S. Y., Khek, S. L., & Phoong, S. W. (2022). The bibliometric analysis on finite mixture model. SAGE Open, 12(2), 21582440221101039. https://doi.org/10.1177/21582440221101039
- Pilkington, A., & Liston Heyes, C. (1999). Is production and operations management a discipline? A citation/co citation study. International Journal of Operations & Production Management, 19(1), 7 20. https://doi.org/10.1108/01443579910244188
- Price, D. J. D. S. (1965). Networks of scientific papers. Science, 149(3683), 510–515. https://doi.org/10.1126/science.149.3683.510
- Prior, D., Surroca, J., & Tribó, J. A. (2008). Are socially responsible managers really ethical? Exploring the relationship between earnings management and corporate social responsibility. Corporate Governance an International Review, 16(3), 160–177. https://doi.org/10.1111/j.1467-8683.2008.00678.x
- Pritchard, A., & Pritchard, A. (1969). Statistical bibliography or bibliometrics. Journal of Documentation, 25(4), 348. https://doi.org/10.1108/eb026482
- Rahman, M. M., Moniruzzaman, M., & Sharif, M. J. (2013). Techniques, motives and controls of earnings management. International Journal of Information Global Business and Management Research: An International Journal, 11(3), 22 34.
- Riehmann, P., Hanfler, M., & Froehlich, B., “Interactive Sankey diagrams,” IEEE Symposium on Information Visualization, 2005. INFOVIS 2005., Minneapolis, MN, USA, 2005, pp. 233–240, https://doi.org/10.1109/INFVIS.2005.1532152.
- Roychowdhury, S. (2006). Earnings management through real activities manipulation. Journal of Accounting and Economics, 42(3), 335–370. https://doi.org/10.1016/j.jacceco.2006.01.002
- Schipper, K. (1989). Earnings management. Accounting Horizons, 3(4), 91 102.
- Schmidt, F. (2008). Meta-analysis: A constantly evolving research integration tool. Organizational Research Methods, 11(1), 96–113. https://doi.org/10.1177/1094428107303161
- Sha, Y., Qiao, L., Li, S., & Bu, Z. (2021). Political freedom and earnings management. Journal of International Financial Markets, Institutions and Money, 75, 101443. https://doi.org/10.1016/j.intfin.2021.101443
- Small, H. (1973). Co citation in the scientific literature: A new measure of the relationship between two documents. Journal of the American Society for Information Science, 24(4), 265 269. https://doi.org/10.1002/asi.4630240406
- Srivastava, M., & Sivaramakrishnan, S. (2021). Mapping the themes and intellectual structure of customer engagement: A bibliometric analysis. Marketing Intelligence & Planning, 39(5), 702–727. https://doi.org/10.1108/MIP-11-2020-0483
- Surwase, G., Sagar, A., Kademani, B. S., & Bhanumurthy, K. (2011). Co-citation analysis: An overview.
- Tang, T., & Firth, M. (2011). Can book–tax differences capture earnings management and tax management? Empirical evidence from China. The International Journal of Accounting, 46(2), 175 204. https://doi.org/10.1016/j.intacc.2011.04.005
- Tranfield, D., Denyer, D., & Smart, P. (2003). Towards a methodology for developing evidence informed management knowledge by means of systematic review. British Journal of Management, 14(3), 207–222. https://doi.org/10.1111/1467-8551.00375
- Van Eck, N., & Waltman, L. (2010). Software survey: VOSviewer, a computer program for bibliometric mapping. Scientometrics, 84(2), 523–538. https://doi.org/10.1007/s11192-009-0146-3
- Van Eck, N., & Waltman, L. (2020). Vosviewer Manual for VOSviewer Version. 1(6), 14. Leiden University: Leiden, The Netherlands.
- Weinberg, B. H. (1974). Bibliographic coupling: A review. Information Storage and Retrieval, 10(5–6), 189–196. https://doi.org/10.1016/0020-0271(74)90058-8
- Widagdo, A. K., Rahmawati, R., Murni, S., Wulandari, T. R., & Agustiningsih, S. W. (2021). Corporate governance, audit quality, family ownership and earnings management. KnE Social Sciences, 519–534. https://doi.org/10.18502/kss.v5i5.8839
- Wu, Y., & Zhou, S. (2022). Do firms practicing integrated reporting engage in less myopic behavior? International Evidence on Opportunistic Earnings Management Corporate Governance: An International Review, 30(3), 290–310. https://doi.org/10.1111/corg.12401
- Yu, F. (2008). Analyst coverage and earnings management. Journal of Financial Economics, 88(2), 245–271. https://doi.org/10.1016/j.jfineco.2007.05.008
- Zhang, Y., Perols, J., Robinson, D., & Smith, T. (2018). Earnings management strategies to maintain a string of meeting or beating analyst expectations. Advances in Accounting, 43, 46–55. https://doi.org/10.1016/j.adiac.2018.09.001
- Zhang, H., Zhu, J., He, J., & Chan, K. C. (2020). Two tales of earnings management with short sales deregulation. Journal of Accounting and Public Policy, 39(4), 106743. https://doi.org/10.1016/j.jaccpubpol.2020.106743
- Zhao, X., Zuo, J., Wu, G., & Huang, C. (2019). A bibliometric review of green building research 2000–2016. Architectural Science Review, 62(1), 74 88. https://doi.org/10.1080/00038628.2018.1485548
- Zupic, I., & Čater, T. (2015). Bibliometric methods in management and organization. Organizational Research Methods, 18(3), 429–472. https://doi.org/10.1177/1094428114562629