
Abstract
The sensory experience is the initial step in creating memorable dining experiences for consumers in traditional restaurants. However, the question remains as to how managers should best combine the five senses to satisfy customers. More research is needed to determine how sensory cues can be used in marketing strategies. By applying five sensory marketing to traditional restaurants, this study proposes a model for satisfying customers. In addition, it aims to leverage methodologies that ultimately lead to customer satisfaction based on sensory marketing that can serve as guidelines for restaurant managers. The study hypotheses were tested on a sample of 525 Indonesians who dined at traditional restaurants. Data analysis was conducted using structural equation modelling with Smart-PLS 4.0 and fuzzy set qualitative comparative analysis (QCA) 3.0. The results indicated that olfaction and haptics are significant factors in customer satisfaction, whereas visual, taste, and auditory are not. According to the QCA findings, two configurations were associated with high satisfaction outcomes, while two others were associated with low satisfaction outcomes. As a theoretical and managerial contribution, this study provides guidance to scholars and managers interested in improving satisfaction in traditional restaurants through sensory marketing techniques.
JEL classification:
Public Interest Statement
Traditional restaurants must remain authentic and sustainable to develop local cuisine. However, it is important to note how managers and traditional restaurant culinary business actors assess various marketing strategies to determine which will maximize customer satisfaction. Thus, this study contributes to developing practical guidelines for managers to monitor customer satisfaction by applying sensory marketing techniques. The sensory approach is straightforward and basic at its core. According to the study findings, sensory marketing covers almost every restaurant setting that consumers enjoy when dining out. Several sensory aspects are investigated in this study, including interior decoration, cleanliness, furniture, restaurant colours, cutlery, and air temperature. In the end, this study succeeded in confirming the authors’ proposition to differentiate high satisfaction and low satisfaction. It is hoped that the study findings can serve as a guide for managers and scholars investigating the effects of applying a combination of sensory marketing that influences both forms of satisfaction.
1. Introduction
Indonesia is a multicultural country rich in a variety of cultures. As a result of Indonesia’s cultural diversity, one can grasp the uniqueness of each region, mainly from a culinary standpoint. Numerous restaurants serve cultural and culinary delights throughout Indonesia. Traditional restaurants have now developed substantially and offer a variety of dishes comprising a wide variety of specialties to maintain local cuisine (Wijaya, Citation2019). Restaurants can create positive perceptions by offering various dishes, attributes, decorations, atmospheres, and views for consumers to enjoy. Incorporating local culture as part of the decoration of traditional restaurants will create distinctive and unique characteristics (Puspita, Citation2015). The restaurant will be more attractive to tourists if spatial planning, decoration, environment, and local culture are combined (C. J. Lee et al., Citation2015). In this sense, communities consider traditional restaurants to be a form of cultural service available to tourists (Cohen & Avieli, Citation2004).
Traditional restaurants are believed to serve as destinations where tourists can enjoy local cuisine that is representative of a particular culture or distinctiveness (Cohen & Avieli, Citation2004; Everett & Aitchison, Citation2008). According to Ebster and Guist (Citation2005), tourists prefer restaurants with an authentic ethnic heritage. For this reason, traditional restaurants must create an appealing impression for consumers while maintaining cultural elements. According to Clemes et al. (Citation2013), decorations, including furniture styles, lighting, dining tables, paintings, and other facilities, can influence visitor perceptions. Adding cultural elements to restaurant attributes will also help attract tourists’ attention as a starting point in customer decision-making (Puspita, Citation2015). Moreover, traditional restaurants are commonly known for serving dishes with distinctive flavours by using fresh, quality, and original spices from the region (Clemes et al., Citation2013). It is common for traditional restaurants to serve delicious, unique, and authentic food using regional spices.
Consumers’ sensory elements will also be enhanced and influenced by the various restaurant attributes that have a cultural impact when visiting a restaurant. Krishna (Citation2012) states that sensory elements form the first step in the consumer decision-making process. As a result, consumers can justify all the services restaurants offer through this sensory element. First and foremost, listening to music while eating at a restaurant will enhance enjoyment and become entertainment for the consumer. According to Garlin and Owen (Citation2006), slow, low-volume music creates a calming effect that encourages consumers to remain in their environment for an extended period. Traditional restaurants that play native local music will likely offer a cultural experience and added value (Wen et al., Citation2020). In addition, the strong restaurant aroma of the food served makes consumers want to order more dishes and to spend more time there (Biswas & Szocs, Citation2019). Because traditional restaurants use certain ingredients and different cooking methods, their food usually has a distinctive and robust aroma. Additionally, customers experience a unique feeling when eating with the provided cutlery. In a restaurant setting, the use of cutlery, such as plates, spoons, and utensils, contributes to consumer judgments and interests regarding food tastes (Biggs et al., Citation2016). Moreover, many traditional restaurants also provide consumers with a place to wash their hands to experience the sensation of eating with their hands directly. In sum, consumers visit traditional restaurants in order to satisfy their consumption needs and enrich their sensory experience before having a meal (Alonso & O’neill, Citation2010).
As part of culinary marketing, traditional restaurant managers need to understand the importance of sensory involvement. Further, increasing competition in business requires managers to devise creative strategies and innovations that will differentiate them from their competitors (E. H. M. Ali & Ahmed, Citation2019). Accordingly, traditional restaurants should be developed by paying attention to sensory cues (visual, taste, olfaction, auditory, and haptic) to increase consumer satisfaction (Brochado et al., Citation2021; Haase & Wiedmann, Citation2018). Indeed, future restaurant development depends on consumer satisfaction. Y. K. Lee et al. (Citation2005) found that the more satisfied customers are, the more positive word-of-mouth communication there is and the more likely they are to return. Ultimately, customer satisfaction influences loyalty (Manthiou et al., Citation2016).
A sensory marketing strategy will assist restaurants in improving the dining experience for their customers (Satti et al., Citation2021). Adding five sensory elements to the dining experience (Chang, Citation2019) will enhance the dining experience. In addition to providing sensory visuals, it will also influence consumer perceptions and responses to the food provided (Michel et al., Citation2014). The contextual noise, music, and sounds made while eating constitute sensory stimuli that can increase appetite and consumers’ appraisal of dishes (Spence & Shankar, Citation2010). In addition to taste, olfaction, and haptics, diners can experience strong emotions and authentic impressions (Chang, Citation2019). Restaurant managers who employ sensory marketing tend to see increases in consumer satisfaction (Satti et al., Citation2021). According to Kim et al. (Citation2020), sensory marketing increases consumer satisfaction and subsequently leads to loyalty (Satti et al., Citation2022).
This study emphasises the importance of sensory marketing applications in traditional restaurants serving consumers. However, it remains debatable whether traditional restaurant managers understand how to effectively apply sensory marketing to ensure customer satisfaction. This is especially true when sensory marketing is the initial stimulus that affects consumer attitudes and emotions, which implies that sensory marketing has great potential for influencing consumer decision-making in the traditional restaurant as part of potential customers’ decision-making journey. To be able to design an efficacious strategy that incorporates sensory marketing, traditional restaurants must provide unique services involving a combination of food, decoration, music, and other cultural components. Consequently, the first research question of this study is as follows: (RQ.1) How do managers apply sensory marketing strategies to enhance customer satisfaction in traditional restaurants? The implication is elucidating how a series of marketing strategies based on sensory elements stimulate consumers’ emotions and attitudes.
Although previous studies have examined how sensory marketing is applied to achieve marketing objectives (such as loyalty) (Satti et al., Citation2021, Citation2022), applications of sensory marketing have yet to be thoroughly studied in a traditional restaurant setting. Restaurant managers must devise strategies to achieve customer satisfaction through sensory marketing and thus meet marketing objectives (satisfaction, loyalty, word of mouth, etc.). Consequently, this study identified a gap in previous studies, which have focused primarily on applying sensory marketing to loyalty with only limited applications to traditional restaurants. Meanwhile, Krishna (Citation2012) reiterates the importance of sensory marketing applications in the consumer decision-making journey, stating that “sensory marketing is the first step in the consumer’s journey to obtaining valuable experiences.” Therefore, the second research question (RQ.2) is How is sensory marketing theory applied to achieve customer satisfaction? This study employed Krishna’s (Citation2012) sensory marketing theory to examine the impact of visual, auditory, olfactory, taste, and haptic elements on customer loyalty and satisfaction. The five sensory elements describe how consumers respond when eating at a restaurant, which can lead to satisfaction.
Furthermore, this research incorporates a methodological contribution by operating a hybrid analysis of structural equation modelling (SEM) and fuzzy sets qualitative comparative analysis (fsQCA) to provide an extensive contribution, achieve the research objective to obtain more detailed results, and evaluate the customer satisfaction model based on sensory marketing using SEM. The resulting findings explain how each sensory marketing element (visual, auditory, olfaction, taste, and haptic) contributes to customer satisfaction. Moreover, we uncover a series of causality configurations (present, absent, and do not care conditions) of each sensory element that affects consumer satisfaction using fsQCA. This study contributes to the empirical literature by determining sensory marketing causality in consumer satisfaction. In this way, fsQCA analysis will demonstrate how the combination of multisensory and single sensory experiences affects consumer satisfaction. Therefore, a significant practical contribution of this study will be providing restaurant managers with a comprehensive understanding of consumer consumption behaviour in traditional restaurants. By utilising sensory marketing strategies, restaurant managers can develop agile marketing strategies.
The remainder of this paper is organized as follows. Section 1 discusses the literature review and hypotheses. Section 2 describes the research methodology, including the method, operationalisation, questionnaire item development, sampling techniques, data collection techniques, and statistical analysis techniques. Section 4 presents the research findings, and Section 3 describes the discussion. Finally, Section 6 offers various conclusions.
2. Literature review and hypotheses
2.1. Customer satisfaction
Customer satisfaction is one of the most important and significant goals of marketing (Yi & Nataraajan, Citation2018). Indeed, customer satisfaction is at the centre of marketing strategies to improve business performance (Greenwell et al., Citation2002). Oliver (Citation1981) indicates that customer satisfaction influences attitudes and purchase intentions through perceived benefits. According to Parker and Mathews (Citation2001), satisfaction can be defined as the feeling that results from evaluating the performance of a product or service as having met certain needs (Parker & Mathews, Citation2001). According to some existing research (Kasiri et al., Citation2017; Shokouhyar et al., Citation2020), customer satisfaction is often influenced by customer service quality. As a result, marketers need to understand the right strategies and services to promote customer satisfaction (Anderson et al., Citation2008). To satisfy customers, managers must consider appropriate service strategies that can meet their unique characteristics.
Tourism and customer satisfaction have been shown to be strongly linked (C. C. Chen et al., Citation2016), whereby customer satisfaction is a significant indicator of a tourism business’s success. As a result of performing a wide variety of activities during a tour, tourists will be satisfied or dissatisfied, which influences their overall satisfaction with tourism services (Pratt et al., Citation2020). Tourists’ satisfaction is based on comparing their destination experience with their expectations, and satisfied customers will likely recommend the destination to others (Jeong & Kim, Citation2020). Tourist satisfaction can also be determined by assessing destination attributes, such as culinary offerings, accommodations, attraction cultures, and convenience levels (Heung & Quf, Citation2000; Huang et al., Citation2015). The level of satisfaction will also differ depending on the importance of the service (Turner et al., Citation2002).
2.2. Sensory marketing
Krishna’s (Citation2012) defined sensory marketing as a marketing method in which customers are influenced by their senses. Sensory marketing assesses five types of perceptions: visual, auditory, haptic, olfaction, and taste. The sequence of these cues in marketing is often sequential (rather than occurring simultaneously) as visual cues influence the olfactory, which then mediates taste perception and sensory sequences (Biswas et al., Citation2021). As a result, sensory marketing is an effective strategy for attracting consumers (Haase & Wiedmann, Citation2018). Restaurants can employ sensory marketing to increase consumer satisfaction by creating emotional attachments (Shahid et al., Citation2022). Notably, sensory marketing is more effective than traditional marketing in generating consumer satisfaction and encouraging diners to spend more time in a restaurant (Satti et al., Citation2021, Citation2022).
Consumers’ dining experiences at certain restaurants are impacted by the five sensory elements that serve as a basis for producing cognitive and emotional perceptions (Chang, Citation2019; W. K. Chen et al., Citation2021). To ensure that consumers have a pleasant dining experience, restaurants employ sensory marketing to be certain that consumers understand the available services (Satti et al., Citation2021). Consumers can experience a variety of different experiences when dining at a restaurant. Sensory cues affect a consumer’s perception of food and their response to it in a restaurant. Notably, consumers perceive the taste of food the first time they see it served to them, even before tasting it. The sensory cues consumers receive when tasting food may differ in terms of levels (Biswas et al., Citation2014). It is also important to consider background music and sounds during eating as sensory cues that also influence consumption and taste judgment (Spence & Shankar, Citation2010). Besides taste and aroma, all sensory cues contribute to customer satisfaction by influencing consumers’ memories and emotions. As a result, all sensory cues contribute to customer satisfaction.
Restaurants that utilise sensory marketing are more likely to be able to provide high-quality services to consumers. The dishes served at a restaurant can also influence a consumer’s perception and response to food; likewise, consumer expectations can be influenced by the dishes they are served (Michel et al., Citation2014). Consumers’ “visual perception” refers to how they perceive the restaurant through sight (Han & Ryu, Citation2009). Several physical factors can affect customer satisfaction and tourist enjoyment, including decoration, facilities, colour, lighting, and the restaurant layout (Ryu & Jang, Citation2007). Restaurants should focus on maintaining a clean environment and providing attentive service to increase customer satisfaction. Creating aesthetic stimulation as part of a restaurant’s service is believed to increase emotional attachment and satisfaction (Shahid et al., Citation2022). A traditional restaurant should consider this strategy as a marketing tactic for managing visual cues (Zha et al., Citation2022). The restaurant’s visuals and physical environment will create an impression of positive value that will ultimately lead to customer satisfaction (F. Ali et al., Citation2016; Ryu et al., Citation2012). Based on this information, the following hypothesis is proposed:
H1
Visual cues in traditional restaurants will likely increase satisfaction.
In dining, the human senses are sensitive to stimulation. Sound is one of the diverse phenomena resulting from interactions with the physical environment; music or sounds that accompany the act of eating can improve consumer satisfaction and enjoyment (Lindborg, Citation2015; Spence & Shankar, Citation2010). Raab et al. (Citation2013) suggested that other forms of sound, such as the sound heard by consumers in restaurants, may affect consumer satisfaction in significant ways. Several types of noise, such as relaxing music, can increase one’s liking for a meal, while traffic noise and restaurant noise decrease one’s liking (Spence & Shankar, Citation2010; Steffens et al., Citation2021). Thus, sound and music can contribute to consumer perceptions of restaurant quality overall satisfaction with a restaurant. Based on this, we postulate the following hypothesis:
H2
Auditory cues in traditional restaurants will likely increase satisfaction.
In addition to the quality and taste of the food served, positive consumer behaviour intentions can also be generated (Liu & Jang, Citation2009). Further, certain restaurants may provide consumers with emotional pleasure and memorable behaviour intentions when they eat at certain restaurants (Horng & Hsu, Citation2021). Many factors affect consumer satisfaction regarding restaurant services, including taste, freshness, and temperature (Liu & Jang, Citation2009). Consequently, a discrepancy between the form and presentation of food creates a negative or positive impression for consumers (Ferreira, Citation2019).
H3
Taste cues in traditional restaurants will likely increase satisfaction.
Chang (Citation2019) found that olfaction can influence consumer memories and emotions when eating in a restaurant. It happens because people smell things that activate specific parts of their brain, which, in turn, create positive emotions such as pleasure, relaxation, satisfaction, and other valuable memories (Krishna et al., Citation2014). In addition to being able to imagine what food will smell like, olfaction can also be referred to as a condition where a person will respond accordingly to a smell. Tourists will ultimately be satisfied with the level of service resulting from the restaurant environment’s air quality, cleanliness, and crowd control (Cicerali et al., Citation2017).
H4
Olfaction cues in traditional restaurants will likely increase satisfaction.
The sensory cue of haptics can influence consumer satisfaction when eating out in a restaurant. Additionally, the texture and presentation of food that consumers enjoy can simultaneously influence their perceptions and satisfaction (Chang, Citation2019). Consumers’ perceptions of a food’s taste can be influenced by a variety of factors, including the aforementioned food texture and presentation (visual) and the food equipment (haptics) used in restaurants (Biggs et al., Citation2016). Restaurant visitors may experience haptic experiences either consciously or unconsciously (Crusco & Wetzel, Citation1984). Based on this, we formulate the following hypothesis:
H5
Haptic cues in traditional restaurants will likely increase satisfaction.
2.3. Proposition development
Krishna’s (Citation2012) introduced a form of marketing known as sensory marketing as a method to influence consumers’ perceptions and behaviours by using their senses. Five sensory cues are of concern: visual, auditory, olfaction, taste, and haptic. Owing to the sequential nature of these five cues in marketing, visual cues typically appear first when visiting a restaurant, followed by scent and taste (Biswas et al., Citation2021). The first impression a restaurant gives is its food dishes and atmosphere, which can influence perceptions of flavours even before they are tasted (Michel et al., Citation2014). Furthermore, auditory sensory cues influence consumers’ consumption level and taste evaluation during meals (Spence & Shankar, Citation2010). Chang (Citation2019) contend that taste and aroma affect consumers’ memories and emotions more than any other sensory cue. As a result, Haase and Wiedmann (Citation2018) argue that all sensory cues are critical to determining whether satisfaction will be high or low. Different conditions may arise in a sensory marketing composition that create the highest satisfaction level and vice versa. Therefore, we propose the following:
Proposition 1.
The presence of a single sensory marketing alone is insufficient to achieve high customer satisfaction in traditional restaurants.
Proposition 2.
The absence of a single sensory marketing dimension alone is insufficient to cause a low level of customer satisfaction in traditional restaurants.
2.4. Research model
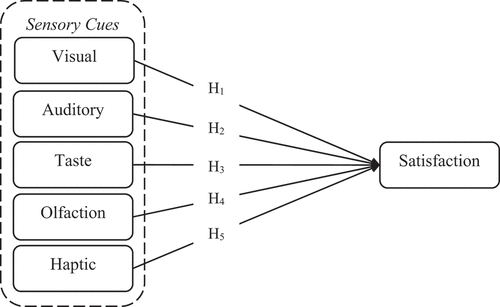
2.4.1. SEM model
The framework for the research model was developed based on the findings of previous studies. As previously mentioned, the study considered that five sensory marketing dimensions—visual, auditory, taste, olfaction, and haptic (Krishna, Citation2012)—determine satisfaction (Kim et al., Citation2020; Satti et al., Citation2021). These five dimensions of sensory marketing can shape or predict consumer satisfaction. Figure below presents the SEM framework developed in the study.
Figure 1. SEM model.
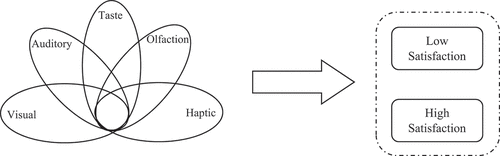
2.4.2. fsQCA model
This study aims to investigate several configurations that contribute to tourist satisfaction through a series of causal conditions. In addition, it investigates the relationship between sensory marketing cues, specifically visual, auditory, olfactory, taste, and haptic. According to this case study, the five sensory marketing cues are considered driving forces in shaping satisfaction simultaneously and interdependently. Most tourists are satisfied with restaurants after tasting delicious food and feeling calm in a quiet environment. However, it is also possible that tourists are satisfied with restaurants based only on their environment. The research will determine the most suitable causal conditions for satisfaction development based on the driving factors for satisfaction formation. Figure illustrates the research path.
Figure 2. Configuration path from sensory marketing to satisfaction.
3. Research methods
3.1. Measures
Table summarises the measurement items used in this study, which were modified from previous studies and based on sensory marketing (visual, auditory, taste, olfaction and haptic) and satisfaction. Visual was composed of three items modified from Haase and Wiedmann (Citation2018, Citation2020). Auditory included three items modified from Haase and Wiedmann (Citation2018, Citation2020). Taste items were modified from Haase and Wiedmann (Citation2018, Citation2020) and then three items were developed. Olfaction, also comprising three items, was modified from Haase and Wiedmann (Citation2018, Citation2020). Haptic was modified from Haase and Wiedmann (Citation2018, Citation2020) and three statement items were developed. Additionally, four satisfaction items were modified based on Kim et al. (Citation2020). Each item was evaluated using a 7-point Likert scale ranging from 1 = strongly disagree to 7 = strongly agree.
Table 1. Measurement items
3.2. Data collection and procedure
The study focus was the use of sensory marketing in traditional restaurants, particularly in the Lake Toba area of Indonesia, where consumers visit traditional restaurants. Thus, consumers may be influenced by their five senses while eating: visual, auditory, olfaction, taste, and haptic. Furthermore, the measurement items developed were arranged as an online questionnaire using Google Forms. The questionnaire was distributed randomly by using the link obtained from Google Forms and sharing it via Instagram, WhatsApp, and Facebook. The questionnaire was distributed randomly using a Google Form link, and 525 responses were collected over the course of eight months.
3.3. Sampling technique and profile
Both non-probability sampling and purposive sampling techniques were employed in this study. A questionnaire was administered to respondents who had visited traditional restaurants, had had memorable dining experiences, and had shared those experiences via social media. Respondents who met these criteria were permitted to fill out the questionnaire. In this way, we sought to obtain responses following the research objectives, namely, to determine whether consumers are satisfied with a restaurant experience by considering five sensory aspects (visual, auditory, taste, olfaction, and haptic).
The survey was conducted online, and 525 responses were collected. According to the demographic characteristics presented in Table , women dominated (69.7%). The largest age group was those ages 20 to 24 (42.1% of respondents). Regarding marital status, 64.2% of respondents were single, and 35.8% were married. As for educational background, 60% of respondents had completed a bachelor’s degree. Regarding occupation, 47% of respondents reported being undergraduate students. When asked about the frequency of visits to traditional restaurants; the most common answer was less than or equal to two times, representing 39.0% of respondents. Among travellers who prefer to travel with their families, 71.6% prefer traditional restaurants. According to 67.6% of respondents, the most impressive attribute in traditional restaurants was the food.
Table 2. Respondents’ profile
3.4. Analysis techniques
SEM was utilised to analyse the data using Smart-PLS 4.0 software. The measurement model is first evaluated using convergent and discriminant validity. The assessment of convergence validity is based on the average variance extracted (AVE) value, composite reliability (CR) value, and Cronbach’s alpha (CA) value for internal consistency (Hair et al., Citation2017). According to the Fornell-Larcker criterion, discriminant validity is evaluated based on the square root of the AVE being more significant than the correlation between other variables in the model and the heterotrait—monotrait (HTMT) ratio (Fornell & Larcker, Citation1981; Henseler et al., Citation2015). In addition, this study also evaluates the value of the variance inflation factor (VIF) to detect multicollinearity. According to Diamantopoulos (Citation2011), if the VIF value of less than 10 indicates there is no concern of multicollinearity. Two methods are used to evaluate the structural model. First, the R-square value is assessed using exogenous variable factors to assess the strength of the model performance (Falk & Miller, Citation1992). In the second step, model fit is evaluated based on fit indices, such as SRMR and NFI (Hu & Bentler, Citation1998). Hypothesis testing is performed once the fit model criteria have been satisfied in SEM.
The research was also tested using fsQCA, which can provide theoretical and practical benefits based on conditions that provide solutions for the dependent variable. A calibration evaluation was conducted to determine the position of the membership data used for the data analysis. This evaluation results in a value between 0 and 1 as part of the fsQCA test. In the fsQCA analysis, the data is transformed by calibrating a 7-point Likert scale (1 = strongly disagree to 7 = strongly agree) within three limits, namely “6” is full membership, “4” is the intersection or median, and “2” is full non-membership (Pappas & Woodside, Citation2021). The values obtained in the fsQCA analysis were used to build a truth table that tests the validity of the conclusions derived from the analysis.
4. Results
4.1. Analysis results from SEM
4.1.1. Validity and reliability assessment
Several stages of testing were conducted to ensure the validity and reliability of the research. The construct validity of the study was determined by comparing the loading values of each factor to 0.7 (Hair et al., Citation2017). This test was conducted to determine the measuring instrument’s capability to determine the research concept. The findings confirmed the construct validity of the study: the factor loadings for each item exceeded 0.7. In addition, the convergent validity of the study was assessed with an AVE value of 0.5 (Hair et al., Citation2017). This study found satisfactory results where the AVE value of each construct exceeded 0.5. To assess the internal consistency of a construct, Hair et al. (Citation2017) used a CA of 0.7 and CR of 0.7. In general, the results indicate that the internal consistency of the research is strong. Table shows the results of the construct validity and reliability in more detail.
Table 3. Construct validity and internal consistency
In the next step, discriminant validity was assessed using three methods. Using the Fornell-Larcker criterion approach, we evaluated the square root value of AVE compared to the inter-construct correlation value (Fornell & Larcker, Citation1981). Consequently, we determined that the square root value of the AVE was more significant than the inter-construct correlation value. Therefore, discriminant validity was established according to the Fornell-Larcker criterion, as indicated in Table .
Table 4. Discriminant validity fornell-larcker criterion
In addition, the discriminant validity was tested using the HTMT approach, which represents a new technique for evaluating discriminant validity with a determined HTMT value of 0.85 (Henseler et al., Citation2015). The HTMT values for each construct were lower than 0.85. Thus, the study can be said to have strong discriminant validity. Table presents the discriminant validity HTMT ratio.
Table 5. Discriminant Validity of Heterotrait-Monotrait Ratio (HTMT)
In addition, the cross-loading matrix approach can be used to assess discriminant validity. Discriminant validity is assessed when the factor loading item value of a construct exceeds the correlation coefficient of all other constructs. This result indicated that the factor loadings of all constructs were more significant than the correlation coefficients, thereby indicating a high degree of validity for discrimination using the cross-loading matrix method. Table presents the cross-loading matrix.
Table 6. Discriminant validity of cross-loading matrix
This study also evaluated the value of the variance inflation factor (VIF) to detect multicollinearity. According to the results, the outer VIF value ranges from 1.565 to 3.777, and the inner VIF value varies from 1.889 to 2.421. The VIF value obtained in this study fulfils the multicollinearity criteria. According to Diamantopoulos (Citation2011), a VIF value of less than ten indicates the absence of multicollinearity. Therefore, this study concluded that multicollinearity was not a concern.
4.1.2. Hypothesis testing
Structural model analysis was performed using Smart-PLS 4.0 software to evaluate the research model’s capability to test the hypotheses. Using the path coefficient between constructs (Falk & Miller, Citation1992), we can assess the model strength of endogenous variables. Using a structural model is appropriate if the R2 value is greater than 0.1 or near one. The fifth path coefficients of sensory marketing cues (visual, auditory, olfaction, taste, and haptic) indicated that the satisfaction construct has a value of R2 = 0.603 for the satisfaction construct. Since the endogenous construct has an R2 value greater than 0.1, we concluded that this research model is suitable for use. Furthermore, we assessed the structural model using model fit criteria. The threshold used is an SRMR less than 0.10 or of 0.08 and an NFI closer to 1 (Hu & Bentler, Citation1998). The exact model fit was measured using the lower d_ULS and d_G with using 95 to 99 bounds (Dijkstra & Henseler, Citation2015). As shown in Figure , each model fit the criteria, e.g., SRMR = 0.048, d_ULS = 0.441; d_G = 0.324, and NFI = 0.870 was deemed satisfactory. Thus, there were no concerns regarding the model fit.
Figure 3. Structural model.
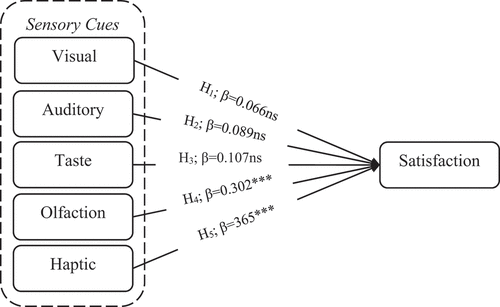
Figure and Table illustrate the results of the hypotheses testing. The results indicated that some sensory cues, namely visual, auditory and taste, did not influence the formation of satisfaction in a significant way. Therefore, H1, H2, and H3 are not supported. (β = 0.066, 0.089 and 0.107, T = 1.182, 1.201 and 1.924). Contrary to this, the sensory cues of olfaction and haptics had a significant effect on satisfaction. Thus, H4 and H5 are supported with (β = 0.302 and 0.365, T = 5.714 and 6.768).
Table 7. Summarize of hypothesis
4.2. Analysis results from fsQCA
4.2.1. Calibration selection and truth table construction
The use of fsQCA in research aims to produce a high or low satisfaction configuration derived from five sensory marketing cues: visual, auditory, taste, olfaction, and haptic. Additionally, the findings are used to resolve the complex theory of creating high satisfaction through inter-dimensional sensory marketing relationships by using inter-dimensional sensory marketing relationships to create a high level of satisfaction. To perform fsQCA analysis, data on the 7-Likert scale was calibrated into three fuzzy sets: “6” as full membership, “4” as a median or intersection, and “2” as full non-membership (Ordanini et al., Citation2014; Pappas & Woodside, Citation2021). To generate a truth table containing all composite conditions that indicate high and low satisfaction, the calibrated data was converted into fuzzy scores with “0” for “low” and “1” for “high.”
A truth table for high satisfaction is provided in Table . Eleven composite conditions that support high satisfaction outcomes were obtained. Each composite consists of constructs with unique and different conditions resulting in high satisfaction. Specifically, the fourth composite with 436 cases has conditions where five independent constructs are in the “high” condition, leading to high satisfaction. In addition, three composites form high satisfaction, derived from four constructs in the “high” condition in 15 cases. Four composites form high satisfaction, consisting of three constructs in the “high” condition in five cases. A “high” condition is also found in two constructs adding three cases, namely the ninth and tenth composites, which result in high satisfaction. Lastly, the eleventh composite condition forms high satisfaction with one construct or case in the “high” condition.
Table 8. Truth table for high satisfaction
A truth table for low satisfaction outcomes is also presented in Table . Using eleven composite conditions as predictors of low satisfaction, two composites were obtained for “high” low satisfaction and nine composites for “low” low satisfaction. A high low satisfaction composite is formed by using only one construct with one case as a “high” condition in the first composite. Additionally, the second composite, which has one case, is composed of two constructs in the “high” condition that result in a low satisfaction. Further, three constructs in the “high” condition constitute the third to seventh composite conditions, resulting in seven cases of low satisfaction. As with composites eight to ten, which consist of four constructs in the “high” condition, 12 cases of low satisfaction are derived. In addition, the composite conditions in which the five constructs are in a “high” condition, totalling 436 cases, also constitute a low satisfaction condition.
Table 9. Truth table for low satisfaction
4.2.2. fsQCA findings
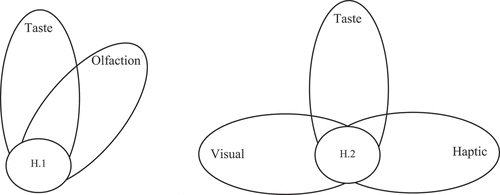
The data analysis was conducted using fsQCA 3.0 software. As a result, three solution configurations were obtained that resulted in high satisfaction, as shown in Table . An overall solution coverage value of 0.960 and a consistency value of 0.985 were obtained to form high satisfaction. This is in accordance with Ragin’s (Citation2006) study finding, which states that coverage and consistency values greater than 0.75 are considered relevant. A consistent value of above 0.75 was also found in each configuration, thus resulting in a unique and different configuration that produces high satisfaction. Specifically, only the first configuration (H.1) had a raw coverage value exceeding 0.75. In addition, each configuration had a presence (*) and do not care conditions (blank space). The first configuration (H.1) consisted of causal conditions of *OLF and *TST and do not care conditions of VSL, ADT, and HPT with a raw coverage of 0.958 and a consistency of 0.986. With a raw coverage value of 0.112 and a consistency value of) 0.986, the second configuration (H.2) consisted of causal conditions, (e.g., *VSL, *TST, *HPT) and do not care conditions such as ADT and OLF. Considering the results obtained, it may be concluded that preposition number one is supported.
Table 10. Configurations for high and low satisfaction
Table presents the resulting configurations of low satisfaction outcomes. Two configurations formed low satisfaction with an overall solution coverage value of 0.637 and a consistency value of 0.873. Each configuration had a presence and absence condition. In configuration L.1, the presence of *VSL was combined with the absence conditions of ADT, OLF, TST, and HPT, which provide a raw coverage of 0.506 and a consistency of 0.930. The second configuration, L.2, had a raw coverage value of 0.580 and a consistency value of 0.887, which consisted of causal conditions of *TST and *HPT, while the absence conditions included VSL, ADT, and OLF. These results suggest that the preposition number two is supported.
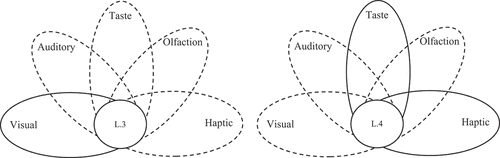
As shown in Figure , the first configuration (H.1) can result in high satisfaction levels in a traditional restaurant by considering the high raw coverage and consistency values as the optimal solution to create high satisfaction. In addition to the constructs in the configuration, each construct consists of several components that must be considered in its application. A restaurant’s olfactory construct includes several components, including aromas and soothing. Similarly, taste has components, including the type, deliciousness, and freshness of drinks and foods. Conversely, the second configuration (H.2) also yields high satisfaction results through a combination of visual, taste, and haptic components. A restaurant’s visual appeal is determined by its colour scheme, interior decoration, and balance. Meanwhile, the restaurant’s haptic appeal is determined by its cleanliness, furniture, and temperature balance. Combining these three sensory elements will result in high customer satisfaction.
Figure 4. First Configurations for high satisfaction.
Consumer satisfaction with these configurations is low, as shown in a comparison of the L.1 and L.2 configurations. This configuration was selected based on its high consistency and raw coverage. Based on the L.1 configuration results, low satisfaction is likely to result even when the restaurant provides gratifying visual aspects such as colour, decoration, and restaurant balance but fails to meet the auditory, taste, olfaction requirements, and haptic aspects. Restaurant managers can utilise this research finding to avoid negative aspects (low satisfaction) and develop sensory marketing strategies to satisfy consumers when they encounter them. Also, L.2 represents low satisfaction. The results of this study suggest that even though the food is excellent and the restaurant is immaculate and has unique furniture (presence of haptic cues), if other cues such as visual, auditory, and olfactory are not handled effectively (absent), customer satisfaction will be low. By leveraging sensory marketing linked to becoming a marketing strategy to increase customer satisfaction from these two configurations that refer to low satisfaction, managers can gain valuable insights into how to better manage traditional restaurants.
Figure 5. First Configurations for low satisfaction.
5. Discussion
This research aimed to explain the formation of consumer satisfaction when visiting traditional restaurants through perceived sensory experiences (visual, auditory, taste, olfaction and haptic). To that end, this study examined the effect of sensory marketing on satisfaction by investigating how the five sensory cues become motivating factors that directly influence satisfaction. Our data analysis revealed several results related to traditional restaurants and memorable dining experiences. Colours, interiors, attractive decorations, and physical surroundings can express the restaurant’s visual cues. The restaurant’s situation and environmental conditions are expressed in colours, interiors, and attractive décor. According to the hypothesis testing, visuals (H1) do not significantly influence satisfaction formation, indicating that the restaurant’s situation and physical environment may not explain why consumers are unsatisfied. Indeed, there are other sensory cues besides colour, decorations, or the interior involving auditory cues that consumers may be affected by in a restaurant, such as music and noise. This study confirms previous findings that visuals do not significantly affect satisfaction (Kim et al., Citation2020). This study also confirms that auditory cues do not significantly influence satisfaction formation (H2). Contrary to the assumption that consumers are either uncomfortable with or dissatisfied with the type of music played or other sounds played, it appears that consumers are not particularly interested in the sound of music playing in restaurants during their meals. This finding also in line with previous studies that emphasise that auditory signals do not significantly influence customer behaviour (Lv et al., Citation2022). In addition, taste cues describe the qualities of food such as the taste, freshness of ingredients, or type. In this study, taste (H3) was not significantly related to consumer satisfaction; therefore, restaurants serving a variety of food types with insignificantly different tastes may influence customer satisfaction. This finding aligns with previous research emphasising that taste does not have a significant influence on customer satisfaction (Vural et al., Citation2023).
In addition, there are olfaction cues or the aroma or smell of food. Based on the results of the hypothesis testing, olfaction (H4) is associated with significantly higher satisfaction levels. This indicates that consumers who can sense the aroma of food and the soothing atmosphere of the restaurant are likely to experience a feeling of satisfaction. Furthermore, olfaction can enhance consumer satisfaction while in the restaurant by influencing their emotions and memories. This finding is in line with Satti et al.’s (2021) conclusion that olfaction is a significant factor in determining customer satisfaction, as are several haptic cues relating to restaurant cleanliness, temperature, and furniture. Based on the results from testing the hypothesis that haptic (H5) affects satisfaction, consumers who experience various haptic attributes in restaurants will feel more comfortable and relaxed when dining. As an example, when restaurants provide tables and cutlery that are well-organized and clean, consumers’ appetite and satisfaction increase, which is also supported by previous research (Satti et al., Citation2022).
As a result of the analysis using fsQCA, the best solution configuration for high and low output satisfaction can be identified according to sensory marketing dimension predictors (visual, auditory, taste, olfaction, and haptic). The results indicate there are two causal configurations resulting in high satisfaction outcomes and two causal configurations resulting in low satisfaction outcomes. Clearly, all three configurations have a high consistency value when it comes to producing high satisfaction output, indicating that all solutions can be implemented. By identifying only one configuration with a raw coverage value compatible with the first configuration (H.1), this study substantiates the H.1 configuration as the most suitable solution for forming high satisfaction. Consequently, olfaction and taste are essential to achieve high levels of satisfaction, while visual, auditory, and haptic conditions are not necessary. Furthermore, based on the highest raw coverage value, the two configurations have a consistent value that fulfils the low satisfaction output. However, the research emphasises Configuration 2 (L.2). According to Configuration L.2, taste and haptic conditions are present, while visual, auditory, and olfactory conditions are absent.
6. Conclusion
6.1. Theoretical implication
As a result of the study, traditional restaurants are increasingly targeted by sensory marketing. When evaluating the impact of these sensory cues on customer satisfaction at traditional restaurants, researchers should consider the five sensory cues, visual, auditory, taste, olfaction, and haptic. Consequently, this study investigates the five effective sensory marketing cues as antecedents to creating satisfaction. The sensory of “visual” refers to as the physical environment of a restaurant, including color, decoration, facilities, interior, and lighting. Auditory includes music and sounds made while eating. A restaurant’s auditory attributes include music and volume. Food attributes include freshness of ingredients, temperature, and variety. Olfaction influences consumers’ memories and emotions through smells in restaurants (food and the surrounding environment). Also, consumers can feel haptics, such as how clean the restaurant is, how comfortable the temperature is, and how comfortable the furniture is. This study examines the five dimensions to confirm that sensory marketing can create customer satisfaction.
In traditional restaurants, sensory marketing is essential to increasing consumer satisfaction. As satisfaction is an indicator of success in a business industry, further research is needed. In the study, olfaction and haptic cues were found to have the most significant influence on satisfaction. However, visual, auditory, and taste had no significant effects, which means that consumers are more interested in the restaurant’s aroma, whether it is the smell of food or the smell around it. A clean place, appropriate temperature, and comfortable furniture are also more likely to make consumers feel comfortable and to enjoy their dining experience. Using these two cues, sensory marketing can determine if consumer satisfaction is being shaped appropriately. As a result, this study demonstrated the ability to form satisfaction through olfaction and haptics.
The results of the configuration analysis using fsQCA also enabled the achievement of theoretical complexity in research. Moreover, the researchers succeeded in determining causal condition configurations for both high and low satisfaction outputs. It is expected that study’s findings will assist researchers in developing a research proposition by configuring causal conditions to produce high and low satisfaction and unique configurations of the outputs, thus supporting the research proposition. A high level of customer satisfaction is achieved with a consistent raw coverage value. The first configuration (H.1) combines olfaction and taste, while the second configuration (H.2) serves as a “do not care” configuration. Using this configuration, consumers can enjoy the same sense of touch and taste as they would when dining at a traditional restaurant. Various factors increase customer satisfaction, including olfaction (the aroma of food and the restaurant’s environment) and taste (taste, freshness of ingredients, and variety). Moreover, traditional restaurants are often renowned for their distinctive and strong aroma and food taste that create pleasure and a memorable dining experience for consumers. The combination of olfactory and taste cues in restaurants will ultimately boost customer satisfaction. Attention should also be paid to one configuration (L.2) for low satisfaction output, which is characterized by the taste and haptic conditions but not the visual, auditory, or olfactory conditions. If tourists ignore taste and touch, they may not be satisfied with their meals. For example, consumers may be unhappy with the dining experience if the food is bland and there is insufficient cutlery. Customers are less likely to be satisfied if a restaurant lacks a comfortable atmosphere, lovely decorations, music, or has unpleasant smells. Therefore, the five senses consumers experience at traditional restaurants impact their satisfaction levels.
6.2. Managerial implications
This research contributes significantly to implementing sensory marketing, particularly in the culinary field. Additionally, sensory marketers engage consumers directly so they can better understand their needs when visiting. Traditional restaurants will benefit from implementing sensory marketing by improving their understanding of consumer behaviour and needs. Therefore, restaurant managers can utilise these findings as a managerial approach to boost customer satisfaction. In this case, managers should pay careful attention to two essential sensory cues. First, olfactory cues are found to shape customer satisfaction. The scent of typical food from traditional restaurants can increase consumer interest in ordering and trying food from a restaurant when it fills the entire room. When restaurant managers seek to increase customer satisfaction in this situation, they must pay attention to distinctive olfactory attributes that can attract consumers’ attention. The second is haptic cues. The furniture in restaurants must be comfortable for consumers. Cutlery, tables, and other facilities must be safe and accessible. A clean atmosphere and conditions, as well as the appropriate dining room temperature, will increase consumer comfort and encourage them to remain longer in the restaurant. This will lead to customer satisfaction and the creation of a memorable dining experience at a traditional restaurant. For managers to influence the formation of customer satisfaction, it is imperative to consider the attributes of olfaction and haptics in traditional restaurants.
The fsQCA results also enable restaurant managers to understand how to create high and low satisfaction levels through sensory marketing in traditional restaurants. To achieve high satisfaction output, the first configuration (H.1) must contain olfaction and taste conditions. Therefore, traditional restaurant managers should pay attention to the aroma, the use of cooking ingredients, and the taste of the various dishes served to consumers to stimulate high consumer satisfaction. The low satisfaction output seen in configuration 2 (L.2) is associated with taste and haptic conditions, whereas the absence of visual, auditory, and olfactory constructs is observed. Restaurant managers must pay attention to the way the food tastes to ensure dishes are delicious, fresh, and varied. Restaurants must also ensure cleanliness, appropriate temperature, and comfortable furniture, just as they do with haptics. Inconsistent food taste and presentation will affect consumer perceptions, resulting in low customer satisfaction. Restaurant managers should consider convenience when dining to avoid consumer complaints. In addition, restaurant managers need to pay attention to the decorations, aromas, and music that are installed. Because the absence of these three sensory cues creates low satisfaction when consumers visit traditional restaurants, these three are essential. In general, the resulting solution configuration from fsQCA has been validated through predictive validity analysis. The model derived from each solution configuration for high and low satisfaction can be implemented as a model.
6.3. Limitations and avenues for future research
Although this research has contributed to the theoretical and practical research, it still has limitations. This study only used satisfaction as an outcome and then analysed it using SEM and fsQCA. However, the importance of five sensory marketing cues on broader marketing objectives, such as loyalty and retention, should be considered. Therefore, future research should identify various other marketing objective-relevant outcomes that are influenced by sensory marketing. In addition, this study also uses traditional restaurants as the research objects. Sensory marketing can also be applied to a variety of products and fields. Among them is the influence of sensory marketing in terms of packaging on consumer taste and satisfaction. Consequently, future research can examine and identify sensory marketing in various product categories or marketing industry sectors.
Author statement
Authorship criteria are met by all individuals, and the authors certify that they have taken sufficient part in the work to accept responsibility for its content.
Author contribution
Conceptualization, P.H.S., and W.K.C.; Methodology, A.D.K.S., and I.J.E.; Software, A.D.K.S.; Validation, I.J.E. and A.D.K.S.; Formal Analysis, A.D.K.S.; Investigation, I.J.E., and P.H.S.; Resource, W.K.C., and P.H.S.; Data Curation, I.J.E., and A.D.K.S.; Writing-Original Draft, A.D.K.S., and I.J.E.; Writing & Review Editing, P.H.S., and A.D.K.S.; Visualization, A.D.K.S., and I.J.E.; Supervision, W.K.C., and P.H.S.; Project Administrator, A.D.K.S., and P.H.S.; Funding Acquisition, P.H.S.
Notes: P.H.S., Pantas H. Silaban; W.K.C., Wen-Kuo Chen; I.J.E., Ixora Javanisa Eunike; A.D.K.S., Andri Dayarana K. Silalahi
Disclosure statement
The authors report there are no competing interests to declare.
Additional information
Funding
References
- Ali, E. H. M., & Ahmed, M. O. (2019). Sensory marketing and its effect on hotel market-share: Perception of hotel customers. Journal of Tourism and Hospitality Management, 7(1), 116–22. https://doi.org/10.15640/jthm.v7n1a12
- Ali, F., Amin, M., & Ryu, K. (2016). The role of physical environment, price perceptions, and consumption emotions in developing customer satisfaction in Chinese resort hotels. Journal of Quality Assurance in Hospitality & Tourism, 17(1), 45–70. https://doi.org/10.1080/1528008X.2015.1016595
- Alonso, A. D., & O’neill, M. A. (2010). Consumers’ ideal eating out experience as it refers to restaurant style: A case study. Journal of Retail & Leisure Property, 9(4), 263–276. https://doi.org/10.1057/rlp.2010.9
- Anderson, S., Pearo, L. K., & Widener, S. K. (2008). Drivers of service satisfaction: Linking customer satisfaction to the service concept and customer characteristics. Journal of Service Research, 10(4), 365–381. https://doi.org/10.1177/1094670508314575
- Biggs, L., Juravle, G., & Spence, C. (2016). Haptic exploration of plateware alters the perceived texture and taste of food. Food Quality and Preference, 50, 129–134. https://doi.org/10.1016/j.foodqual.2016.02.007
- Biswas, D., Labrecque, L. I., & Lehmann, D. R. (2021). Effects of sequential sensory cues on food taste perception: Cross‐modal interplay between visual and olfactory stimuli. Journal of Consumer Psychology, 31(4), 746–764. https://doi.org/10.1002/jcpy.1231
- Biswas, D., Labrecque, L. I., Lehmann, D. R., & Markos, E. (2014). Making choices while smelling, tasting, and listening: The role of sensory (Dis) similarity when sequentially sampling products. Journal of Marketing, 78(1), 112–126. https://doi.org/10.1509/jm.12.0325
- Biswas, D., & Szocs, C. (2019). The smell of healthy choices: Cross-modal sensory compensation effects of ambient scent on food purchases. Journal of Marketing Research, 56(1), 123–141. https://doi.org/10.1177/0022243718820585
- Brochado, A., Stoleriu, O., & Lupu, C. (2021). Wine tourism: A multisensory experience. Current Issues in Tourism, 24(5), 597–615. https://doi.org/10.1080/13683500.2019.1649373
- Chang, W. L. (2019). Applying ANP to analyse sensory experience in restaurants. British Food Journal, 122(1), 122–135. https://doi.org/10.1108/BFJ-07-2019-0497
- Chen, C. C., Huang, W. J., & Petrick, J. F. (2016). Holiday recovery experiences, tourism satisfaction and life satisfaction–is there a relationship? Tourism Management, 53, 140–147. https://doi.org/10.1016/j.tourman.2015.09.016
- Chen, W. K., Wen, H. Y., & Silalahi, A. D. K. (2021, August). Parasocial interaction with youtubers: Does sensory appeal in the youtubers’ video influences purchase intention? In 2021 IEEE International Conference on Social Sciences and Intelligent Management (SSIM), Taichung. (pp. 1–8). IEEE.
- Cicerali, E. E., Kaya Cicerali, L., & Saldamlı, A. (2017). Linking psycho-environmental comfort factors to tourist satisfaction levels: Application of a psychology theory to tourism research. Journal of Hospitality Marketing & Management, 26(7), 717–734. https://doi.org/10.1080/19368623.2017.1296395
- Clemes, M. D., Gan, C., & Sriwongrat, C. (2013). Consumers’ choice factors of an upscale ethnic restaurant. Journal of Food Products Marketing, 19(5), 413–438. https://doi.org/10.1080/10454446.2013.724364
- Cohen, E., & Avieli, N. (2004). Food in tourism: Attraction and impediment. Annals of Tourism Research, 31(4), 755–778. https://doi.org/10.1016/j.annals.2004.02.003
- Crusco, A. H., & Wetzel, C. G. (1984). The Midas touch: The effects of interpersonal touch on restaurant tipping. Personality & Social Psychology Bulletin, 10(4), 512–517. https://doi.org/10.1177/0146167284104003
- Diamantopoulos, A. (2011). Incorporating formative measures into covariance-based structural equation models. MIS Quarterly, 35(2), 335–358. https://doi.org/10.2307/23044046
- Dijkstra, T. K., & Henseler, J. (2015). Consistent and asymptotically normal PLS estimators for linear structural equations. Computational Statistics & Data Analysis, 81, 10–23. https://doi.org/10.1016/j.csda.2014.07.008
- Ebster, C., & Guist, I. (2005). The role of authenticity in ethnic theme restaurants. Journal of Foodservice Business Research, 7(2), 41–52. https://doi.org/10.1300/J369v07n02_04
- Everett, S., & Aitchison, C. (2008). The role of food tourism in sustaining regional identity: A case study of Cornwall, South West England. Journal of Sustainable Tourism, 16(2), 150–167. https://doi.org/10.2167/jost696.0
- Falk, R. F., & Miller, N. B. (1992). A primer for soft modeling. University of Akron Press.
- Ferreira, B. M. (2019). Packaging texture influences product taste and consumer satisfaction. Journal of Sensory Studies, 34(6), e12532. https://doi.org/10.1111/joss.12532
- Fornell, C., & Larcker, D. F. (1981). Evaluating structural equation models with unobservable variables and measurement error. Journal of Marketing Research, 18(1), 39–50. https://doi.org/10.1177/002224378101800104
- Garlin, F. V., & Owen, K. (2006). Setting the tone with the tune: A meta-analytic review of the effects of background music in retail settings. Journal of Business Research, 59(6), 755–764. https://doi.org/10.1016/j.jbusres.2006.01.013
- Greenwell, T. C., Fink, J. S., & Pastore, D. L. (2002). Assessing the influence of the physical sports facility on customer satisfaction within the context of the service experience. Sport Management Review, 5(2), 129–148. https://doi.org/10.1016/S1441-3523(02)70064-8
- Haase, J., & Wiedmann, K. P. (2018). The sensory perception item set (SPI): An exploratory effort to develop a holistic scale for sensory marketing. Psychology & Marketing, 35(10), 727–739. https://doi.org/10.1002/mar.21130
- Haase, J., & Wiedmann, K. P. (2020). The implicit sensory association test (ISAT): A measurement approach for sensory perception. Journal of Business Research, 109, 236–245. https://doi.org/10.1016/j.jbusres.2019.12.005
- Hair, J., Hollingsworth, C. L., Randolph, A. B., & Chong, A. Y. L. (2017). An updated and expanded assessment of PLS-SEM in information systems research. Industrial Management & Data Systems, 117(3), 442–458. https://doi.org/10.1108/IMDS-04-2016-0130
- Han, H., & Ryu, K. (2009). The roles of the physical environment, price perception, and customer satisfaction in determining customer loyalty in the restaurant industry. Journal of Hospitality & Tourism Research, 33(4), 487–510. https://doi.org/10.1177/1096348009344212
- Henseler, J., Ringle, C. M., & Sarstedt, M. (2015). A new criterion for assessing discriminant validity in variance-based structural equation modeling. Journal of the Academy of Marketing Science, 43(1), 115–135. https://doi.org/10.1007/s11747-014-0403-8
- Heung, V. C., & Quf, H. (2000). Hong Kong as a travel destination: An analysis of Japanese tourists’ satisfaction levels, and the likelihood of them recommending Hong Kong to others. Journal of Travel & Tourism Marketing, 9(1–2), 57–80. https://doi.org/10.1300/J073v09n01_04
- Horng, J. S., & Hsu, H. (2021). Esthetic Dining Experience: The relations among aesthetic stimulation, pleasantness, memorable experience, and behavioral intentions. Journal of Hospitality Marketing & Management, 30(4), 419–437. https://doi.org/10.1080/19368623.2021.1859425
- Huang, S., Weiler, B., & Assaker, G. (2015). Effects of interpretive guiding outcomes on tourist satisfaction and behavioral intention. Journal of Travel Research, 54(3), 344–358. https://doi.org/10.1177/0047287513517426
- Hu, L. T., & Bentler, P. M. (1998). Fit indices in covariance structure modeling: Sensitivity to underparameterized model misspecification. Psychological Methods, 3(4), 424. https://doi.org/10.1037/1082-989X.3.4.424
- Jeong, Y., & Kim, S. (2020). A study of event quality, destination image, perceived value, tourist satisfaction, and destination loyalty among sport tourists. Asia Pacific Journal of Marketing and Logistics, 32(4), 940–960. https://doi.org/10.1108/APJML-02-2019-0101
- Kasiri, L. A., Cheng, K. T. G., Sambasivan, M., & Sidin, S. M. (2017). Integration of standardization and customization: Impact on service quality, customer satisfaction, and loyalty. Journal of Retailing and Consumer Services, 35, 91–97. https://doi.org/10.1016/j.jretconser.2016.11.007
- Kim, W. H., Lee, S. H., & Kim, K. S. (2020). Effects of sensory marketing on customer satisfaction and revisit intention in the hotel industry: The moderating roles of customers’ prior experience and gender. Anatolia, 31(4), 523–535. https://doi.org/10.1080/13032917.2020.1783692
- Krishna, A. (2012). An integrative review of sensory marketing: Engaging the senses to affect perception, judgment and behavior. Journal of Consumer Psychology, 22(3), 332–351. https://doi.org/10.1016/j.jcps.2011.08.003
- Krishna, A., Morrin, M., & Sayin, E. (2014). Smellizing cookies and salivating: A focus on olfactory imagery. The Journal of Consumer Research, 41(1), 18–34. https://doi.org/10.1086/674664
- Lee, Y. K., Park, K. H., Park, D. H., Lee, K. A., & Kwon, Y. J. (2005). The relative impact of service quality on service value, customer satisfaction, and customer loyalty in Korean family restaurant context. International Journal of Hospitality & Tourism Administration, 6(1), 27–51. https://doi.org/10.1300/J149v06n01_03
- Lee, C. J., Wang, Y. C., & Cai, D. C. (2015). Physical factors to evaluate the servicescape of theme restaurants. Journal of Asian Architecture and Building Engineering, 14(1), 97–104. https://doi.org/10.3130/jaabe.14.97
- Lindborg, P. (2015). Psychoacoustic, physical, and perceptual features of restaurants: A field survey in Singapore. Applied Acoustics, 92, 47–60. https://doi.org/10.1016/j.apacoust.2015.01.002
- Liu, Y., & Jang, S. S. (2009). Perceptions of Chinese restaurants in the US: What affects customer satisfaction and behavioral intentions? International Journal of Hospitality Management, 28(3), 338–348. https://doi.org/10.1016/j.ijhm.2008.10.008
- Lv, X., Luo, J., Luo, Z., Cao, X., & Liu, Y. (2022). Attracted by a Song: Image-building and tourist-attracting effects of destination songs. Journal of China Tourism Research, 1–27. https://doi.org/10.1080/19388160.2022.2131672
- Manthiou, A., Kang, J., Chiang, L., & Tang, L. (2016). Investigating the effects of memorable experiences: An extended model of script theory. Journal of Travel & Tourism Marketing, 33(3), 362–379. https://doi.org/10.1080/10548408.2015.1064055
- Michel, C., Velasco, C., Gatti, E., & Spence, C. (2014). A taste of Kandinsky: Assessing the influence of the artistic visual presentation of food on the dining experience. Flavour, 3(1), 1–11. https://doi.org/10.1186/2044-7248-3-7
- Oliver, R. L. (1981). Measurement and evaluation of satisfaction processes in retail settings. Journal of Retailing, 57(3), 25–48.
- Ordanini, A., Parasuraman, A., & Rubera, G. (2014). When the recipe is more important than the ingredients: A qualitative comparative analysis (QCA) of service innovation configurations. Journal of Service Research, 17(2), 134–149. https://doi.org/10.1177/1094670513513337
- Pappas, I. O., & Woodside, A. G. (2021). Fuzzy-set Qualitative Comparative Analysis (fsQCA): Guidelines for research practice in information systems and marketing. International Journal of Information Management, 58, 102310. https://doi.org/10.1016/j.ijinfomgt.2021.102310
- Parker, C., & Mathews, B. P. (2001). Customer satisfaction: Contrasting academic and consumers’ interpretations. Marketing Intelligence & Planning, 9(1), 38–44. https://doi.org/10.1108/02634500110363790
- Pratt, S., Suntikul, W., & Agyeiwaah, E. (2020). Determining the attributes of gastronomic tourism experience: Applying impact‐range performance and asymmetry analyses. International Journal of Tourism Research, 22(5), 564–581. https://doi.org/10.1002/jtr.2356
- Puspita, O. D. (2015). Physical evidence of small theme restaurant in Indonesia: A case study of ramen house. Procedia-Social and Behavioral Sciences, 169, 289–295. https://doi.org/10.1016/j.sbspro.2015.01.312
- Raab, C., Zemke, D. M. V., Hertzman, J. L., & Singh, D. (2013). Restaurant customers’ perceptions of noise and their satisfaction and loyalty behaviors. International Journal of Hospitality & Tourism Administration, 14(4), 398–414. https://doi.org/10.1080/15256480.2013.838090
- Ragin, C. C. (2006). Set relations in social research: Evaluating their consistency and coverage. Political Analysis, 14(3), 291–310. https://doi.org/10.1093/pan/mpj019
- Ryu, K., & Jang, S. S. (2007). The effect of environmental perceptions on behavioral intentions through emotions: The case of upscale restaurants. Journal of Hospitality & Tourism Research, 31(1), 56–72. https://doi.org/10.1177/1096348006295506
- Ryu, K., Lee, H. R., & Kim, W. G. (2012). The influence of the quality of the physical environment, food, and service on restaurant image, customer perceived value, customer satisfaction, and behavioral intentions. International Journal of Contemporary Hospitality Management, 24(2), 200–223. https://doi.org/10.1108/09596111211206141
- Satti, Z. W., Babar, S. F., & Ahmad, H. M. (2021). Exploring mediating role of service quality in the association between sensory marketing and customer satisfaction. Total Quality Management & Business Excellence, 32(7–8), 719–736. https://doi.org/10.1080/14783363.2019.1632185
- Satti, Z. W., Babar, S. F., & Parveen, S. (2022). Role of customer satisfaction as a mediator between sensory marketing and customer loyalty: A case of Pakistani restaurant industry. Journal of International Food & Agribusiness Marketing, 1–23. https://doi.org/10.1080/08974438.2022.2049415
- Shahid, S., Paul, J., Gilal, F. G., & Ansari, S. (2022). The role of sensory marketing and brand experience in building emotional attachment and brand loyalty in luxury retail stores. Psychology & Marketing, 37(7), 1398–1412. https://doi.org/10.1002/mar.21661
- Shokouhyar, S., Shokoohyar, S., & Safari, S. (2020). Research on the influence of after-sales service quality factors on customer satisfaction. Journal of Retailing and Consumer Services, 56, 102139. https://doi.org/10.1016/j.jretconser.2020.102139
- Spence, C., & Shankar, M. U. (2010). The influence of auditory cues on the perception of, and responses to, food and drink. Journal of Sensory Studies, 25(3), 406–430. https://doi.org/10.1111/j.1745-459X.2009.00267.x
- Steffens, J., Wilczek, T., & Weinzierl, S. (2021). Junk food or haute cuisine to the ear?-Investigating the relationship between room acoustics, soundscape, and the perceived quality of restaurants. Frontiers in Built Environment, 7, 74. https://doi.org/10.3389/fbuil.2021.676009
- Turner, L. W., Reisinger, Y. V., & McQuilken, L. (2002). How cultural differences cause dimensions of tourism satisfaction. Journal of Travel & Tourism Marketing, 11(1), 79–101. https://doi.org/10.1300/J073v11n01_05
- Vural, Y., Ferriday, D., & Rogers, P. J. (2023). Consumers’ attitudes towards alternatives to conventional meat products: Expectations about taste and satisfaction, and the role of disgust. Appetite, 181, 106394. https://doi.org/10.1016/j.appet.2022.106394
- Wen, H., Leung, X., & Pongtornphurt, Y. (2020). Exploring the impact of background music on customers’ perceptions of ethnic restaurants: The moderating role of dining companions. Journal of Hospitality and Tourism Management, 43, 71–79. https://doi.org/10.1016/j.jhtm.2020.02.007
- Wijaya, S. (2019). Indonesian food culture mapping: A starter contribution to promote Indonesian culinary tourism. Journal of Ethnic Foods, 6(1), 1–10. https://doi.org/10.1186/s42779-019-0009-3
- Yi, Y., & Nataraajan, R. (2018). Customer satisfaction in Asia. Psychology & Marketing, 35(6), 387–391. https://doi.org/10.1002/mar.21093
- Zha, D., Foroudi, P., Jin, Z., & Melewar, T. C. (2022). Making sense of sensory brand experience: Constructing an integrative framework for future research. International Journal of Management Reviews, 24(1), 130–167. https://doi.org/10.1111/ijmr.12270