
Abstract
This study explores the possibility of using VR as an in-flight entertainment tool. The relationship between flight-related anxiety and attitude toward using in-flight VR is examined. Furthermore, the willingness to buy airline tickets is also explored if in-flight VR entertainment is provided. The primary research model refers to the Virtual Reality Hardware Acceptance model. Flight-related anxiety variables and covariates are used as the antecedents of attitude toward using in-flight VR. In addition, the intention to buy airline tickets is also measured as the dependent variable to explore the influence of attitude toward using in-flight VR. The method of data collection is accomplished purposively by an online survey. Hypotheses testing is done using PLS-SEM. The bootstrap-based multi-group analysis (MGA) is taken to distinguish the significance level between two data groups: high and low anxiety. Perceived enjoyment is the main predictor that significantly affects the passenger’s attitude toward using in-flight VR for passengers with a high level of anxiety. However, price willingness to pay does not influence perceived enjoyment. Attitude toward using in-flight VR influences both groups’ intention to buy airline tickets. The originality of the research:Instead of using VR as a therapy tool, this study explores the possibility of using it as an in-flight entertainment tool for anxious passengers.
1. Introduction
Former studies found that a significant portion of people has trouble flying (Busscher et al., Citation2015; Ferrand et al., Citation2015; Rothbaum et al., Citation2000; Wittfoth et al., Citation2022), and even cause one-third of them to refuse to fly (Busscher et al., Citation2015). Fear of heights, crashes, small spaces, and being away from home are reasons for trouble flying. Wittfoth et al. (Citation2022) indicate that around 50% of the Western population feels uncomfortable with flying. No data was found about the portion of people in Asia that have problems with flying. However, it is estimated that flight-related anxiety affects 10–40% of the world population (Rothbaum et al., Citation2000; van Gerwen & Diekstra, Citation2000, Citation1974 Oakes & Bor, 2010 in Gottlieb et al., Citation2021). Most of them do not take any therapy to overcome the trouble. Moreover, the therapy is only effective for low self-reported anxiety participants (Busscher et al., Citation2015).
Despite the effectiveness of the existing therapy techniques, there are limitations in cost, confidentiality issues, and control of the situation. Recent studies show that Virtual Reality is effective in being used in therapy. It is cheaper, controllable, safer, and can be individualized (Cardo et al., 2017). In addition, previous studies have shown that Virtual Reality Exposure Therapy (VRET) is an effective treatment for overcoming flight-related anxiety (Rothbaum et al., Citation2000; Ferrand et al., Citation2015; Mulcahy et al., Citation2016; Cardo et al., 2017; Gottlieb et al., Citation2021; Meyerbröker et al., Citation2022). In their studies, they proved that Virtual Reality Therapy significantly reduced anxiety. However, the fact that most people with flight anxiety do not take any therapy means the treatment will not become the solution. Therefore, another approach should be taken to help these people.
Studies on how people overcome their flight anxiety show that distraction is the most common method to reduce anxiety, followed by alcohol, relaxation techniques, and cigarettes. Strategies for using distraction and relaxation are correlated, meaning that people use both strategies simultaneously (McIntosh et al., Citation1998). Therefore, using VR to distract and relax during the flight may become one of the solutions. Moreover, gamification as in-flight entertainment effectively minimizes children’s anxiety (Shen et al., Citation2019).
Manis and Choi (Citation2019) develop a model to measure customers’ acceptance, use, and purchase intention of Virtual Reality hardware. They extend the Theory of Acceptance Model (TAM) into the VR hardware acceptance model (VR-HAM). Curiosity and price willingness to pay are two antecedent variables added to the TAM. They also consider the age and past use. The result shows that perceived enjoyment is the strongest predictor of attitude toward using VR compared to perceived usefulness and ease of use. Therefore, VR can be used as a distraction tool and create user relaxation.
This study explores the possibility of using VR as an in-flight entertainment and therapy tool. The relationship between flight-related anxiety and willingness to buy airline tickets is examined if in-flight VR entertainment is available. The research model refers to the Virtual reality hardware acceptance model from Manis and Choi (Citation2019), which is developed from Technology Acceptance Model (TAM) (Davis, Citation1985).
2. Theoretical background
2.1. Virtual reality
Steuer (Citation1992) defines Virtual Reality (VR) as a simulated environment where the user experiences telepresence or a presence in the environment through communication media. Meanwhile, Brooks (Citation1999) defines VR as an encounter where “users are effectively immersed in a responsive virtual world”. This definition categorizes VR not only referring to hardware or information communication technology (ICT) as defined by Berg and Vance (Citation2017) but also covering content and software in general. The implementation of VR technology has proliferated. VR can increase the purchase intentions of a company’s product or service. Lombart et al. (Citation2020) in their study demonstrate that the adoption of VR resulted in the positive impact of using non-immersive and fully immersive virtual stores on fruit and vegetable purchase intentions compared to physical stores.
Nevertheless, the implementation of this technology has pros and cons. Rubo et al. (Citation2021) analyze the impact of using VR on the human source memory system. They found that the user’s memory system of this technology finds it challenging to distinguish between reality and virtual worlds, defined as perceptual proximity, compared to the memory system of the users of the two-dimensional display. On the contrary, this phenomenon has a positive influence as a treatment that studies the negative impact of using Virtual Reality as Exposure Therapy (VRET) for patients with anxiety disorders (Anderson & Molloy, Citation2020). After the treatment, there were no cases of motion sickness, photo-sensitive seizures, or clinical deterioration. Thus, Virtual Reality’s application as in vivo therapy is clinically proven safe and effective.
It is predicted that the use of VR for commercial purposes will increase, creating challenges and opportunities, especially for the service industry, including the tourism and hospitality sectors. For example, the pandemic creates a new virtual reality tourism market. Huang (Citation2023) investigate the relationship between the acceptance and use of technology toward VR and the intention of tourism behavior. Talwar et al. (Citation2022) investigate consumers’ perceptions of the positive impact of virtual tourism on sustainability. On the other hand, in their study, Merkx and Nawijn (Citation2021) explore the negative impact of VR tourism: addiction and isolation.
2.2. Flight-related anxiety
Howard et al. (Citation1983) define the fear of flying as a generalization of at least four primary fear sources; fear of aircraft accidents, heights, confinement, and instability. A study by Van Gerwen et al. (Citation1997) added two different determinants; fear of losing control over the situation and a great need to control the situation. An in vivo experiment was conducted by Busscher et al. (Citation2015) to measure the effect of cognitive-behavioral group therapy (CBGT) on 79 (seventy-nine) participants who experienced a fear of flying. It was found that approximately 37 (thirty-seven) participants experienced fear while in the air, in-flight anxiety, based on the Flight Anxiety Situations (FAS) Questionnaire that measures flight-related anxiety. The FAS questionnaire consists of three indicators that assess anxiety experienced when anticipating a flight (anticipatory anxiety), anxiety experienced during a flight (in-flight anxiety), and anxiety experienced in connection with airplanes in general (generalized flight anxiety). Lower self-reported anxiety during flight exposure showed significant improvements up to 3 years after finishing the therapy. In addition, in the fear of flying sample on specific subscales using the FAS questionnaire (Nousi et al., Citation2008), the 5th percentile for anticipatory flight anxiety = 22, in-flight anxiety = 21, generalized flight anxiety = 7, and the sum score = 62 respectively. Meanwhile, the 95th percentile of non-patients for anticipatory flight anxiety = 24, in-flight anxiety = 26.35, generalized flight anxiety = 10, and the sum score = 67, respectively.
Prior studies (Cardoş et al., Citation2017; Gottlieb et al., Citation2021; Rothbaum et al., Citation2000, Citation2006; Tortella-Feliu et al., Citation2010) have shown the clinical efficacy of virtual reality exposure therapy (VRET) for flight anxiety treatment. Rothbaum et al. (Citation2000) and Cardoş et al. (Citation2017) even advocated the use of virtual reality exposure therapy (VRET) compared to the “in vivo” and “in imago” techniques to treat flight anxiety due to the significant effect of its use for better control over the content and exposure rhythm. Gottlieb et al. (Citation2021) use a large-scale VR system that allows the participants to experience the effect of motion. They also proved the efficacy of VRET.
2.3. Virtual reality hardware acceptance model
The research conducted by Manis and Choi (Citation2019) expands the original TAM variables by including the user’s perceived enjoyment as a belief variable and age, curiosity, past use, and price willingness-to-pay as antecedent variables shown in Figure . The technology acceptance model (TAM) itself is a theory derived from the theory of reasoned action (TRA) proposed by Ajzen and Fishbein (Citation1980). The original TAM model proposes perceived usefulness and perceived ease of use as variables that impact individual attitudes toward the technology’s acceptance and use (Davis, 1986). This model explains that a future purchase intention is determined by usefulness and ease of use.
Figure 1. Virtual reality hardware acceptance structural model (Manis & Choi, Citation2019).
Manis and Choi (Citation2019) adopts the study conducted by Davis et al. (Citation1992) by including the salient belief variable of perceived enjoyment suitable for VR devices. The finding in this study establishes the perceived enjoyment variable as the main predictor that determines the use attitudes. That is in line with the results of research conducted by Bruner and Kumar (Citation2005), Lee et al. (Citation2005), and Won et al. (Citation2023). Perceived enjoyment is defined as the degree to which activity using technology is perceived as enjoyable regardless of the anticipated performance consequences (Davis et al., Citation1992).
2.4. In-flight virtual reality acceptance model framework
The framework model used as the basis for acceptance has minor adjustments to the indicators for measuring the price willingness-to-pay antecedent variable. In addition, the research conducted by Chiambaretto (Citation2021) shows that if airlines want to add a utility related to ancillary service improvement, then the average price those prospective passengers are still willing to pay (WTP) is 34.44€ per utility. This WTP is obtained assuming that the average call price for a return ticket for long-haul flights from Paris to New York in the Economy is 415€. Therefore, the estimated average range of airline ticket fares increased by 8.3% (415€/34.44€ x 100%) after implementing VR technology as an in-flight entertainment system. However, that research clearly states that long-haul airlines often charge additional utility prices higher than the previously determined passenger willingness to pay. Prices that exceed WTP are because ticket prices for airlines that adopt Full-Service Carrier (FSC) services are sensitive to an increase in ticket prices for airlines that adopt Low-Cost Carrier (LCC) services, as shown in research conducted by Avogadro et al. (Citation2021). For airlines that provide in-flight entertainment (FSC) facilities, it is known that the average ticket price increase range is 20.1%, with a minimum value of 4.2% within the range of 30 (thirty) days before departure and a maximum increase of 48.9% within the range of 4 (four) days before departure.
3. Methodology
This research adopts a cross-sectional study design conducted over a time scope. Meanwhile, the data collection method is accomplished purposively by an online survey. The nonprobability snowball sampling technique is carried out considering that international passengers can recommend categories of respondents that are also suitable for analysis in the study because of the specific population and the spread of the population. The virtual reality hardware acceptance model is then adopted as a reference model. The reference model (see Figure ) is adjusted by taking flight-related anxiety as a multi-group potential covariate variable affecting three belief variables. The flight-related anxiety potential covariate variable is measured using the Flight Anxiety Situations (FAS) Questionnaire. The FAS questionnaire consists of three indicators that assess anxiety experienced when anticipating a flight (anticipatory anxiety), anxiety experienced during a flight (in-flight anxiety), and anxiety experienced in connection with airplanes in general (generalized flight anxiety). The reference model is also modified by integrating attitudes toward purchasing and using VR hardware variables into the attitude toward using in-flight VR as a dependent variable. The effect is assessed on the intention to buy airline tickets.
Ten hypothetical tests are obtained alongside three post hoc hypotheses. The hypothesis connects the flight-related anxiety potential covariate variable towards three belief variables and one hypothesis that connects the base model to the intention to buy airline tickets variable, as shown in Table . Each variable is measured using the 5-Likert ordinal scale except for the price willingness-to-pay antecedent variable, which is measured using the 5-Likert interval scale (0–10%). The different scale for the willingness to pay was done to anticipate the price change, especially in the 30 to 4 days before departure. In the meantime, the age variable in a proposed model framework is measured based on a division of age groups or age categories issued by the Ministry of Health of the Republic of Indonesia. The research model and hypotheses can be seen in Figure .
Figure 2. In-flight virtual reality entertainment acceptance model framework.
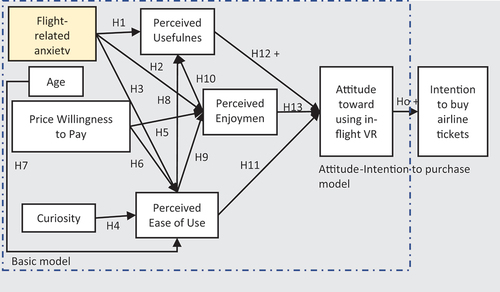
Table 1. Hypotheses of the research model
After an adjusted model is established, preliminary data collection is conducted by having a closed interview with 12 (twelve) Indonesian international passengers via phone calls to validate the formulated problem. The functionality of the design is communicated to the respondents before the interview begins. Subsequently, initial in-flight virtual reality entertainment is designed based on the interviewer’s insights. The in-flight virtual reality entertainment design is proposed by implementing semi-immersive Virtual Reality considering the perceptual proximity factor experienced by users of fully immersive VR. The in-flight VR sketch and its technological functions (Figure ) were shown on the questionnaire.
Figure 3. The proposed in-flight VR and its user interface.
The primary data collection is conducted by distributing a 5-Likert scale questionnaire online. The initial proposed in-flight virtual reality design is communicated in advance alongside its functional requirements. This study uses Indonesian international passengers who have access to the in-flight entertainment system as a sample. The minimum sample size required for data processing is calculated using the 10-times rule and Cohen’s recommendation (Cohen, Citation1992). The proposed model framework shows that the maximum number of arrows pointing at each dependent variable is 4 (four). Thus the minimum sample required is estimated at 40 (forty) according to the 10-times rule. A minimum sample required to be assessed using PLS-SEM is estimated by 53 (fifty-three) according to Cohen’s recommendation for a statistical data power of 80% with a 10% significance level and a minimum R-square of 0.25 (Cohen, Citation1988). At first, data collection is examined by analyzing statistical descriptions. A statistical description comprises frequency per scale, mean, standard deviation, maximum/minimum value, skewness, and kurtosis for each indicator within all constructs of the proposed model.
Data processing is conducted by evaluating the measurement model consisting of reliability and validity measurements. Reliability testing is done by evaluating indicator reliability which measurement is calculated by looking at the outer loading factor, and the composite reliability value calculates internal consistency reliability. Thus, the measurement indicator is consistent if it has both outer loading and composite reliability value of 0.70 or higher. Validity testing is done by evaluating convergent and discriminant validity testing. Indicators on latent variables are valid for measuring tools if they have an Average Variance Extracted (AVE) value greater than or equal to 0.5. Meanwhile, the instrument criteria of discriminant validity are established if the “square root” of the AVE value of each latent variable is greater than the correlation between the latent variables (Hair et al., Citation2022).
Before evaluating the structural model, following Nousi et al. (Citation2008), the primary data group is split into two different classifications: high and low anxiety. The subscales are classified as high-level if the value is more than the fifth standardized 5-Likert scale percentile in the fear of flying sample (1.774 = 22 × 5/[62 (sixty-two) or the sum scores]) for anticipatory anxiety, (1.693 = 21 × 5/[62 (sixty-two) or the sum scores]) for in-flight anxiety, and (0.564 = 7 × 5/[62 (sixty-two) or the sum scores]) for generalized flight anxiety. Meanwhile, the subscales are classified as low-level if the value is less than or equal to the 95th standardized 5-Likert scale percentile of non-patients (1.791 = 24 × 5/[67 (sixty-seven) or the sum scores]) for anticipatory anxiety, (1.966 = 26.35 × 5/[67 (sixty-seven) or the sum scores]) for in-flight anxiety, and (0.746 = 10 × 5/[67 (sixty-seven) or the sum scores]) for generalized flight anxiety respectively. The next step is to evaluate the structural model through predictive accuracy testing using the R-square value, which indicates the percentage of independent variables representing the construct. The R-square value of 0.67, 0.33, and 0.19 are classified as substantial, moderate, and weak sequentially (Hair et al., Citation2022). At the same time, the ƒ-square value indicates the change of the R-square value on the dependent variable when the independent variable is omitted. The ƒ-square values of 0.02, 0.15, and 0.35 indicate small, medium, and large effects. After testing predictive accuracy, predictive relevance testing is then performed to demonstrate the ability of the model to predict. Stone-Geisser’s (Q2) value is an index that shows the ability of the model to predict (Stone, Citation1974; Geisser, Citation1975). The dependent variable’s Q-square value greater than zero indicates good predictive relevance. The standardized (β) path coefficient value is then considered to assess how strong the relationship between the two latent variables is. The value of the standardized path coefficient is within the range of −1 to +1. The closer the value to 1 (one), the stronger the relationship between the two latent variables. The positive and negative values indicate the direction of the relationship between the two variables. The bootstrap-based multi-group analysis (MGA) is conducted to distinguish the statistical difference between high- and low-anxiety data groups. The same approach is then used to evaluate the influence of the base model on the intention to purchase airline tickets. The two empirical models are then proposed based on the evaluation results. Evaluation results are then descriptively and inferentially analyzed to dig deeper into the managerial implications, system improvement proposals, and limitations to consider future technological implementation. System improvements are proposed to improve key predictors affecting the in-flight virtual reality technological acceptance parallel to the main factor influencing passengers’ beliefs on the key predictors. Finally, the research conclusions are drawn based on the findings that answer the problem formulation and research objectives and notes for further research.
4. Results and discussion
In this study, 113 responses were obtained, with 97 of them (85.84%) having accessed in-flight entertainment services. Most respondents are within the young adult category, aged between 17–25 years old, choosing less than 2 (two) percent of airfare increases in the airlines that adopt virtual reality technology. The data in the age construct was slightly not normal due to its positive skewness value (>1 or 1.341), which makes it appropriate to assess using the PLS-SEM technique.,
4.1. Measurement model assessment
The measurement model consists of testing the reliability of indicators by considering the value of outer loadings and testing the reliability of internal consistency by considering the value of composite reliability. In addition, the measurement model is evaluated through convergent validity testing by evaluating Cronbach’s alpha, the average variance extracted (AVE) values, and construct reliability (CR) values. As seen in Table , indicators loadings are in the range of (0.675–0.963), Cronbach’s alphas range between 0.649 and 0.910, CR between 0.803 and 0.943, and AVE between 0.596 and 0.848; thus, it can be confirmed that the convergent validity, the indicator’s reliability, and the reliability of internal consistency has been established for the study.
Table 2. Reflective outer model
Once the convergent validity has been established, the following assessment is on discriminant validity. Discriminant validity is evaluated using three criteria: (i) Fornell-Larcker criterion, (ii) cross-loadings criterion, and (iii) Heterotrait-Monotrait (HTMT) ratio criterion. For the first criterion, from Tables , it can be seen that the “square root” of the AVE value of each latent variable (diagonal value) is greater than the correlations between that latent variable with other latent variables (off-diagonal values); hence discriminant validity has been established according to Fornell-Larcker criterion (Fornell & Larcker, Citation1981Citation1981). For the second criterion, we found that none of the indicator’s outer loading was smaller than its cross-loading on other constructs, meaning that all indicators have a higher correlation with its construct than other constructs; hence discriminant validity has been established. Lastly, Table shows that all HTMT ratios have values less than 0.9, the suggested threshold by Henseler et al. (Citation2015). Hence discriminant validity is established according to this criterion.
Table 3. Discriminant validity: Fornell-larcker criterion (base model)
Table 4. Discriminant validity: Fornell-larcker criterion (attitude – Intention to buy airline tickets model)
Table 5. Discriminant validity assessment: HTMT ratio
4.2. Structural model assessment
Following the assessment of the measurement model, the next step is the evaluation of structural path coefficients (relationships amongst study constructs) and their statistical significance.
The results are presented in Table . The structural model is presented in Figure .
Figure 4. Structural model path coefficient estimates.
Table 6. Direct relationships path coefficient estimation
The assessment of the coefficient of determination (R2), the predictive relevance (Q2), as well as the effect size (ƒ2) of each construct and its relationships with other variables are shown in Table , and the interpretation follows the guidelines provided in Hair et al. (Citation2022). The assessment of predictive accuracy using the R-square value indicates that the independent variables directly linked to perceived enjoyment are less representative due to their R-square being less than the acceptable lower limit (R2 <0.19). The independent variables directly linked to perceived ease of use have low representation (R2 ≥0.19). Meanwhile, the constructs other than perceived ease of use and perceived enjoyment have a moderate representation (R2 ≥0.33). The assessment of predictive relevance using the Q-square value indicates that each construct in the model has an adequate predictive ability (Q2 >0). Meanwhile, the ƒ-square effect size calculation indicates that the elimination of the relationship between flight-related anxiety antecedent variable on perceived enjoyment and perceived ease of use does not significantly affect changes in the coefficient of determination of the dependent variable in question (ƒ2 <0.02), likewise, with the elimination of the relationship between the antecedent variable of age on perceived ease of use and WTP on perceived enjoyment.
Table 7. Coefficient of determination (R2) and effect size (ƒ2)
Furthermore, the bootstrap-based multi-group analysis (MGA) is taken to distinguish the significance level between two data groups: high and low anxiety. This analysis is necessary considering the position of the flight-related anxiety variable in the model framework acts as a covariate variable. The hypotheses testing generates two different categories of an empirical model, as shown in Figure for the data group with high-level anxiety and Figure for the data group with low-level anxiety (only significant paths in at least one group are depicted in the figures).
Figure 5. The empirical model estimates the high-level anxiety data group.
Figure 6. The empirical model estimates the low-level anxiety data group.
The PLS-MGA method is used to distinguish the difference between two group-specific, high, and low anxiety levels that build on PLS-SEM bootstrapping results. Based on the finding, as shown in Table , no significant difference exists between the two data groups’ model estimates (p-Value >0.1). However, the hypotheses testing signifies that there is a difference in the main predictor in both empirical models: the high-level anxiety group has perceived enjoyment as the main predictor (path coefficient 0.449); meanwhile, the low-level anxiety group has perceived usefulness as the main predictor (path coefficient 0.515) that influences attitude toward using virtual reality technology as an in-flight entertainment system. In addition, flight-related anxiety does not significantly affect the belief variable of perceived usefulness within the high-level anxiety group.
Table 8. PLS-Multi-group Analysis (MGA) of the two data groups: high and low anxiety levels
This study uses international passengers as an object because, so far, the research conducted in the aviation industry has focused more on commercial aircraft pilots than space flight crews, such as in the Van Benthem and Herdman (Citation2021) experiments. The experiments aim to analyze the cognitive risk factors possessed by pilots with older age or minimal experience through the help of virtual reality devices. Another research conducted by Mastro et al. (Citation2021) also focuses on running a simulation program that is carried out to study crew behavior when facing an emergency on a space exploration mission. The approach in this study uses in-flight entertainment (IFE) as content because it is the main factor determining passenger satisfaction (Alamdari, Citation1999). However, there are other factors influencing the intention to purchase airline tickets. Nevertheless, the gamification-based IFE using a somatosensory game is more effective in reducing the anxiety of 8–10 years old children (Shen et al., Citation2019).
In the proposed model framework, it is hypothesized that perceived enjoyment serves as a significant predictor, which contradicts the research findings of Childers et al. (Citation2001); Davis et al. (1989); Davis et al. (Citation1992), who state that if the return on investment is the focus in implementing the technology, practitioners should make the technology seems useful to consumers. Nevertheless, the finding in this study stands as a continuation of the proposed clarification results of Manis and Choi’s (Citation2019) research, which was supported by Bruner and Kumar (Citation2005) and Lee et al. (Citation2005). In addition, Holdack et al. (Citation2022) also found a strong relationship between the acceptance of Augmented Reality glasses with enjoyment. In practice, the implementation of technology at the pre-prototyping stage should be done by building consumer trust in the perceived enjoyment as a top priority to attract consumers to buy a technological product and in its development also carried out in line with optimizing aspects of ease and usability of use (Davis & Venkatesh, Citation2004). As Zhou et al. (Citation2022) proved, perceived enjoyment influences perceived ease of use, usefulness, and even intention to use new technology.
The adoption of virtual reality technology as an in-flight entertainment system should be done by targeting first-class flight passengers because the research conducted by Hwang and Lyu (Citation2018) states that if the airline management provides the best service by emphasizing the value of functionality through the provision of different yet exclusive services, it will create a positive impact on the emotional attachment of first-class passengers on first-class flights. Alaska Airlines, Qatar Airways, and British Airways have trialed the in-flight VR for business class customers (Hayward, Citation2021).
Other findings from this study indicate that the antecedent variable of age has no significant effect on perceived ease of use. This finding contradicts the results of Manis and Choi (Citation2019), which indicate a negative and significant effect of the age variable on the perceived ease of use. This contradiction is due to the low representation of respondents in other age categories, which can be explained based on the age-positive skewness in the framework model. Hence, taking a representative sample proportional to the age category is necessary for better generalization. Likewise, the variable of perceived enjoyment cannot be explained based on price willingness-to-pay. This result is presumably due to the influence of other variables that were not examined when viewed based on the predictive accuracy and relevance results. Therefore, it is necessary to identify other external variables that better represent these variables.
The primary limitation to the generalization of these results is that the Flight Anxiety Situations (FAS) Questionnaire used in the flight-related anxiety construct is limited to 3 (three) items that generally assess anticipatory anxiety, in-flight anxiety, and generalized flight anxiety instead of using a 32-item self-report inventory proposed in the original FAS questionnaire by Nousi et al. (Citation2008). Therefore, they are subject to biases and confounding. Furthermore, they may have influenced our model estimates. However, the three-items questionnaire stands as a covariate variable whose presence was not expected to align with the research objective in the first place. This approach is established by prior research, which encourages the use of virtual reality exposure therapy (VRET) compared with the “in vivo” and “in imago” techniques for treating flight anxiety due to its significant use effectiveness for better control over the content and exposure rhythm (Cardoş et al., Citation2017). Therefore, before being implemented commercially, future experiments are needed to test Virtual Reality’s potential effects on passenger anxiety.
There are several limitations of this study. Firstly, at the data collection stage, the way to communicate in-flight VR to respondents is by displaying the design sketch and a description of the technology function. The respondents were asked to imagine using VR glasses during the flight. Therefore, respondents did not directly experience using VR.
Secondly, this study did not consider the influence of VR content. Different content can generate different responses from the users. Input from the therapist can be used to select the right content to reduce anxiety.
5. Conclusion and implications
This study shows that perceived enjoyment is the main predictor that significantly affects the passenger’s attitude toward using in-flight VR, especially for passengers with a high level of anxiety. This attitude positively affects passengers’ intention to buy an airline ticket. Therefore, in-flight VR can be used to minimize anxiety if the passengers experience enjoyment arising from using it. In addition, it can also be explored to present content on in-flight VR, which is designed as therapy for this group of passengers.
Take-off and landing were a perceived source of anxiety for about 40% of respondents, and flight delays for over 50% (MacIntosh et al., Citation1998). Therefore, there is an opportunity to use VR for passengers at the airport during the delay to overcome anxiety. However, further development should be done to explore this possibility. Nevertheless, using in-flight VR to minimize anxiety during take-off and landing is currently not possible due to airlines’ regulation to turn off all electrical devices during those conditions.
Disclosure statement
No potential conflict of interest was reported by the authors.
Additional information
Funding
References
- Ajzen, I., & Fishbein. 1980. Understanding attitudes and predicting social behavior. Prentice-Hall. Englewood Cliffs, N.J. https://doi.org/10.1016/0022-1031(86)90045-4
- Ajzen, I., & Fishbein, M. (1977). Attitude-behavior relations: A theoretical analysis and review of empirical research. Psychological Bulletin, 84(5), 888–20. https://doi.org/10.1037/0033-2909.84.5.888
- Alamdari, F. (1999). Airline in-flight entertainment: The passengers’ perspective. Journal of Air Transport Management, 5(4), 203–209. https://doi.org/10.1016/S0969-6997(99)00014-9
- Anderson, P. L., & Molloy, A. (2020). Maximizing the impact of virtual reality exposure therapy for anxiety disorders. Current Opinion in Psychology, 36, 153–157. https://doi.org/10.1016/j.copsyc.2020.10.001
- Avogadro, N., Malighetti, P., Redondi, R., & Salandi, A. (2021). A tale of airline competition: When full-service carriers undercut low-cost carriers fares. Journal of Air Transport Management, 92, 102027. https://doi.org/10.1016/j.jairtraman.2021.102027
- Berg, L. P., & Vance, J. M. (2017). Industry use of virtual reality in product design and manufacturing: A survey. Virtual Reality, 21(1), 1–17. https://doi.org/10.1007/s10055-016-0293-9
- Brooks, F. P. (1999). What’s real about virtual Reality? IEEE Computer Graphics and Applications, 19(6), 16–27. https://doi.org/10.1109/38.799723
- Bruner, G. C., & Kumar, A. (2005). Explaining consumer acceptance of handheld internet devices. Journal of Business Research, 58(5), 553–558. https://doi.org/10.1016/j.jbusres.2003.08.002
- Busscher, B., Spinhoven, P., & de Geus, E. J. C. (2015). Psychological distress and physiological reactivity during in vivo exposure in people with aviophobia. Psychosomatic Medicine, 77(7), 762–774. https://doi.org/10.1097/PSY.0000000000000209
- Cardoş, R. A. I., David, O. A., & David, D. O. (2017). Virtual reality exposure therapy in-flight anxiety: A quantitative meta-analysis. Computers in Human Behavior, 72, 371–380. https://doi.org/10.1016/j.chb.2017.03.007
- Chiambaretto, P. (2021). Air passengers’ willingness to pay for ancillary services on long-haul flights. Transportation Research Part E: Logistics and Transportation Review, 147, 102234. https://doi.org/10.1016/j.tre.2021.102234
- Childers, T. L., Carr, C. L., Peck, J., & Carson, S. (2001). Hedonic and utilitarian motivations for online retail shopping behavior. Journal of Retailing, 77(4), 511–535. https://doi.org/10.1016/S0022-4359(01)00056-2
- Cohen, J. (1988). Statistical power analysis for the behavioral sciences. Lawrence Erlbaum Associates. https://doi.org/10.4324/9780203771587
- Cohen, J. (1992). A power primer. Psychological Bulletin, 112(1), 155–159. https://doi.org/10.1037/14805-018
- Davis, Fred D. (1985). A technology acceptance model for empirically testing new end-user information systems: Theory and results. Massachusetts Institute of Technology.
- Davis, F. D., Bagozzi, R. P. & Warshaw, P. R. (1992). Extrinsic and Intrinsic Motivation to Use Computers in the Workplace1. J Appl Social Pyschol, 22(14), 1111–1132. https://doi.org/10.1111/j.1559-1816.1992.tb00945.x
- Davis, F. D., & Venkatesh, V. (2004). Toward preprototype user acceptance testing of new information systems: Implications for software project management. IEEE Transactions on Engineering Management, 51(1), 31–46. https://doi.org/10.1109/TEM.2003.822468
- Ferrand, M., Ruffault, A., Tytelman, X., Flahault, C., & Négovanska, V. (2015). A cognitive and virtual reality treatment program for the fear of flying. Aerosp Med Human Perform, 86(8), 723–727. https://doi.org/10.3357/AMHP.4211.2015
- Fornell, C. & Larcker, D. F. (1981). Evaluating Structural Equation Models with Unobservable Variables and Measurement Error. Journal of Marketing Research, 18(1), 39–50. https://doi.org/10.1177/002224378101800104
- Geisser, S. (1975). The predictive sample reuse method with applications. Journal of the American Statistical Association, 70(350), 320–328. https://doi.org/10.1080/01621459.1975.10479865
- Gottlieb, A., Doniger, G. M., Hussein, Y., Noy, S., & Plotnik, M. (2021). The efficacy of a virtual reality exposure therapy treatment for fear of flying: A retrospective study. Frontiers in Psychology, 12. https://doi.org/10.3389/fpsyg.2021.641393
- Hair, J., Hult, G. T. M., Ringle, C. M., & Sarstedt, M. (2022). Primer on partial least squares structural equation modeling (PLS-SEM) (third ed.). SAGE.
- Hayward, J., 2021, Will we ever see VR entertainment on flights? https://simpleflying.com/vr-entertainment-on-flights/, Retrieved February 3, 2023.
- Henseler, J., Ringle, C. M., & Sarstedt, M. (2015). A new criterion for assessing discriminant validity in variance-based structural equation modeling. Journal of the Academy of Marketing Science, 43(1), 115–135. https://doi.org/10.1007/s11747-014-0403-8
- Hirschman, E. C. (1980). Innovativeness, novelty-seeking, and consumer creativity. The Journal of Consumer Research, 7(3), 283. https://doi.org/10.1086/208816
- Holdack, E., Lurie-Stovanov, K., & Fromme, H. F. (2022). The role of perceived enjoyment and perceived informativeness in assessing the acceptance of AR wearables. Journal of Retailing and Consumer Services, 65, 102259. https://doi.org/10.1016/j.jretconser.2020.102259
- Howard, W. A., Murphy, S. M., & Clarke, J. C. (1983). The nature and treatment of fear of flying: A controlled investigation. Behavior Therapy, 14(4), 557–567. https://doi.org/10.1016/S0005-7894(83)80078-1
- Huang, Y. (2023). Integrated concepts of the UTAUT and TPB in virtual reality behavioral intention. Journal of Retailing and Consumer Services, 70, 103127. https://doi.org/10.1016/j.jretconser.2022.103127
- Hwang, J., & Lyu, S. O. (2018). Understanding first-class passengers’ luxury value perceptions in the US airline industry. Tourism Management Perspective, 28, 29–40. https://doi.org/10.1016/j.tmp.2018.07.001
- Ijsselsteijn, W., Nap, H. H., de Kort, Y., & Poels, K., 2007. Digital game design for elderly users. Proceedings of the 2007 conference on future play, pp. 17–22. https://doi.org/10.1145/1328202.1328206
- Lee, M. K. O., Cheung, C. M. K., & Chen, Z. (2005). Acceptance of Internet-based learning medium: The role of extrinsic and intrinsic motivation. Information & Management, 42(8), 1095–1104. https://doi.org/10.1016/j.im.2003.10.007
- Lombart, C., Millan, E., Normand, J. -M., Verhulst, A., Labbé-Pinlon, B., & Moreau, G. (2020). Effects of physical, non-immersive virtual, and immersive virtual store environments on consumers’ perceptions and purchase behavior. Computers in Human Behavior, 110, 106374. https://doi.org/10.1016/j.chb.2020.106374
- Manis, K. T., & Choi, D. (2019). The virtual reality hardware acceptance model (VR-HAM): Extending and individuating the technology acceptance model (TAM) for virtual reality hardware. Journal of Business Research, 100, 503–513. https://doi.org/10.1016/j.jbusres.2018.10.021
- Mastro, A. D., Monaco, F., & Benyoucef, Y. (2021). A multi-user virtual reality experience for space missions. Journal of Space Safety Engineering, 8(2), 134–137. https://doi.org/10.1016/j.jsse.2021.03.002
- McIntosh, I. B., Swanson, V., Power, K. G., Raeside, F. & Dempster, C. (1998). Anxiety and Health Problems Related to Air Travel. J Travel Medicine, 5(4), 198–204. https://doi.org/10.1111/j.1708-8305.1998.tb00507.x
- Merkx, C., & Nawijn, J. (2021). Virtual reality tourism experiences: Addiction and isolation. Tourism Management, 87, 104394. https://doi.org/10.1016/j.tourman.2021.104394
- Meyerbröker, K., Morina, N., Kerkhof, G. A., & Emmelkamp, P. M. G. (2022). Potential predictors of virtual reality exposure therapy for fear of flying: Anxiety sensitivity, self-efficacy and the therapeutic alliance. Cognitive Therapy and Research, 46(3), 646–654. https://doi.org/10.1007/s10608-021-10269-7
- Muk, A., & Chung, C. (2015). Applying the technology acceptance model in a two-country study of SMS advertising. Journal of Business Research, 68(1), 1–6. https://doi.org/10.1016/j.jbusres.2014.06.001
- Mulcahy, R. A., Blue, R. S., Vardiman, J. L., Castleberry, T. L., & Vanderploeg, J. M. (2016). Screening and mitigation of layperson anxiety in aerospace environments. Aerosp Med Hum Perform, 87(10), 882–889. https://doi.org/10.3357/AMHP.4536.2016
- Nousi, A., van Gerwen, L., & Spinhoven, P. (2008). The flight anxiety situations questionnaire and the flight anxiety modality questionnaire: Norms for people with the fear of flying. Travel Medicine and Infectious Disease, 6(5), 305–310. https://doi.org/10.1016/j.tmaid.2008.06.001
- Oh, H., Jeong, M., & Baloglu, S. (2013). Tourists’ adoption of self-service technologies at resort hotels. Journal of Business Research, 66(6), 692–699. https://doi.org/10.1016/j.jbusres.2011.09.005
- Pfeil, U., Arjan, R., & Zaphiris, P. (2009). Age differences in online social networking — a study of user profiles and the social capital divide among teenagers and older users in MySpace. Computers in Human Behavior, 25(3), 643–654. https://doi.org/10.1016/j.chb.2008.08.015
- Rothbaum, B. O., Anderson, P., Zimand, E., Hodges, L., Lang, D., & Wilson, J. (2006). Virtual reality exposure therapy and standard (in vivo) exposure therapy in the treatment of fear of flying. Behavior Therapy, 37(1), 80–90. https://doi.org/10.1016/j.beth.2005.04.004
- Rothbaum, B. O., Hodges, L., Smith, S., Lee, J. H., & Price, L. (2000). A controlled study of virtual reality exposure therapy for the fear of flying. Journal of Consulting and Clinical Psychology, 68(6), 1020–1026. https://doi.org/10.1037/0022-006X.68.6.1020
- Rubo, M., Messerli, N., & Munsch, S. (2021). The human source memory system struggles to distinguish between virtual reality and reality. Computers in Human Behavior Reports, 4, 100111. https://doi.org/10.1016/j.chbr.2021.100111
- Shen, T., Weng, Y., & Han, T. (2019). Gamification of In-Flight Entertainment (IFE) to motivate people to relax: A case design. s.L. Springer. https://doi.org/10.1007/978-3-030-22602-2_31
- Steuer, J. (1992). Defining virtual reality: Dimensions determining telepresence. Journal of Communication, 42(4), 73–93. https://doi.org/10.1111/j.1460-2466.1992.tb00812.x
- Stone, M. (1974). Cross validatory choice and assessment of statistical predictions. Journal of the Royal Statistical Society, 36(2), 111–147. https://doi.org/10.1111/j.2517-6161.1974.tb00994.x
- Talwar, S., Kaur, P., Escobar, O., & Lan, S. (2022). Virtual reality tourism to satisfy wanderlust without wandering: An unconventional innovation to promote sustainability. Journal of Business Research, 152, 128–143. https://doi.org/10.1016/j.jbusres.2022.07.032
- Tortella-Feliu, M., Botella, C., Llabres, J., Breton-Lopez, J. M., Amo, A. R., Gelabert, J. M., & Gelabert, J. M. (2010). Virtual reality versus computer-aided exposure treatments for fear of flying. Behavior Modification, 35(1), 3–30. https://doi.org/10.1177/0145445510390801
- Van Benthem, K., & Herdman, C. M. (2021). A virtual reality cognitive health screening tool for aviation: Managing accident risk for older pilots. International Journal of Industrial Ergonomics, 85, 103169. https://doi.org/10.1016/j.ergon.2021.103169
- Van Gerwen, L. J., & Diekstra, R. (2000). Fear of flying treatment programs for passengers: An international review. Aviation, Space, and Environmental Medicine, 71(4), 430–437.
- Van Gerwen, L. J., Spinhoven, P., Diekstra, R. F. W., & Van Dyck, R. (1997). People who seek help for fear of flying: Typology of flying phobics. Behavior Therapy, 28(2), 237–251. https://doi.org/10.1016/S0005-7894(97)80045-7
- Wittfoth, D., Beise, J., Manuel, J., Bohne, M., & Wittfoth, M. (2022). Bifocal emotion regulation through acupoint tapping in fear of flying. NeuroImage: Clinical, 34, 102996. https://doi.org/10.1016/j.nicl.2022.102996
- Won, D., Chiu, W. & Byun, H. (2023). Factors influencing consumer use of a sport-branded app: the technology acceptance model integrating app quality and perceived enjoyment. APJML, 35(5), 1112–1133. https://doi.org/10.1108/APJML-09-2021-0709
- Zhou, L., Xue, S., & Li, R. (2022). Extending the technology acceptance model to explore students’ intention to use an online education platform at a university in China ttOpsI://1d0o.i.1o1rg7/71/02.1157872/241450824241028251208559. Sage Open.