
 ?Mathematical formulae have been encoded as MathML and are displayed in this HTML version using MathJax in order to improve their display. Uncheck the box to turn MathJax off. This feature requires Javascript. Click on a formula to zoom.
Abstract
This paper investigates the impact of the COVID-19 pandemic on the adoption and evolution of delivery services in Oman. While the pandemic has presented new opportunities for delivery companies and related apps, there is a lack of research specifically focused on the Omani context. To address this gap, our study develops an integrated model based on the Technology Acceptance Model (TAM) and Theory of Planned Behavior (TPB), incorporating additional variables to examine the role of customer satisfaction, trust, and service quality in the adoption of delivery services. Using a quantitative approach, we conducted a study involving systematic random sampling to collect responses from individuals with experience in using online purchase and delivery services. The model was evaluated using in-sample and out-of-sample prediction techniques, as well as measurement and structural analysis employing PLS-SEM. Our proposed model demonstrated strong predictive power and validity. The findings emphasize the significant contributions of service quality and trust to customer satisfaction. Furthermore, social influence emerged as a crucial factor influencing the intention to accept and adopt delivery services after experiencing satisfaction. The inclusion of PLSpredict analysis enhanced the reliability of our conducted analyses. This study provides original insights into the lessons learned from the global impact of COVID-19 and represents the first of its kind conducted in the Gulf Cooperation Council countries. Our research encourages further investigation of these topics in other GCC countries based on our findings. The study concludes by acknowledging its limitations, discussing theoretical and managerial contributions, and suggesting potential avenues for future research.
1. Introduction
1.1. Business opportunities and challenges: the role of delivery services in meeting customer needs during the Covid-19 pandemic
Some research scholars reveal that e-commerce is growing at a rate of 20% annually, and retail is rapidly shifting towards the online mode (Lorente-Martínez et al., Citation2020). Additionally, some scholars confidently believe that e-commerce is the future for retail SMEs (Khaskheli et al., Citation2017; Lal & Chavan, Citation2019). On the other hand, retail SMEs are predominantly local and should capitalize on their proximity to customers (Lorente-Martínez et al., Citation2020). In other words, physical shops will continue to play a vital role in the future of shopping (Vojvodić, Citation2019). With the advent of the novel Coronavirus, traditional views have dramatically changed, and what was once an option before the Covid-19 pandemic—online shopping—has become a necessity and a swift phenomenon, leading to a significant increase in the demand for delivery services and related applications.
At the outset of the Covid-19 pandemic, Oman, as one of the Gulf Cooperation Council (GCC) countries, implemented a series of emergency rules and measures to protect people and facilitate their daily errands in response to the dynamic and unforeseen developments of the virus. The lockdown and the newly imposed regulations, including social distancing measures, worsened the economic situation in all countries, and Oman was no exception (Alzaidi & Agag, Citation2022). The Covid-19 pandemic has globally changed the way of life to which we were accustomed, forcing business entities and individuals to adapt to emergent challenges and modify their behavior based on the new regulations imposed by governments (Alzaidi & Agag, Citation2022; Taufiq Hail, Citation2020; Taufiq-Hail, Sarea et al., Citation2021). For individuals, these difficulties ranged from self-isolation to searching for essential items (Meher et al., Citation2020). In essence, the burden and responsibilities significantly increased during the Covid-19 pandemic, as the time allowed to be outside the home was limited, making it challenging and stressful to acquire necessities. Another significant challenge faced by people was the delivery of purchased items to their doorstep, as many found themselves grappling with conflicting issues, such as meeting obligations to survive while adhering to imposed regulations. Therefore, finding a solution to mitigate the impact of these issues became a necessity for everyone. On the other hand, numerous business opportunities arose, and new services emerged, such as the delivery services for online purchases or placing telephone orders with restaurants and other public or commercial entities that catered to the needs of the public. During the lockdown, these delivery services, as part of the purchasing activities, were offered directly by online stores or other entities, or they were outsourced to third parties through different applications. Additionally, the cost of delivery services was covered by e-retailers or, in some cases, by the purchaser. With such opportunities available, people found themselves inclined to engage in online purchases and utilize delivery services offered by online shops, restaurants, and various public and private entities.
1.2. Proposed factors as antecedents of acceptance in delivery service companies and related applications in the Omani context
The emergent event of Covid-19 has encouraged people to try (use) and evaluate the quality of such services and their applications in various aspects of life. The ease and usefulness of the services offered through applications or websites are expected to be factors driving the intention to use these services. Additionally, the experiences of friends, family, or individuals within one’s social circle with delivery service companies or related applications are expected to have an impact, either positively or negatively, on their decision to use such services. Therefore, studying ease of use and perceived usefulness, which are two pillars of the Technology Acceptance Model (TAM; Davis, Citation1989), along with social influence, are expected to influence customers’ intention to use these services, as previous studies in various fields have demonstrated their role (Hamid et al., Citation2016; Kim et al., Citation2010; Olasina, Citation2019; Sangeeta & Tandon, Citation2021; Singh et al., Citation2020; Tahar et al., Citation2020; Y. Wang et al., Citation2020). Moreover, satisfaction is a key factor that influences customers’ acceptance or intention to continue using services or applications, as emphasized in previous research (Mahmoud et al., Citation2018; Ranaweera & Prabhu, Citation2003). Therefore, customer satisfaction is another factor included in the proposed model of this study to evaluate the acceptance of delivery services and related applications in the Omani context. Furthermore, it is predicted that satisfaction is driven by the customer’s trust and the quality of the delivered services. Hence, these three factors are added to the proposed model to provide a comprehensive understanding of the antecedents of satisfaction that ultimately lead to the acceptance and adoption of delivery services and related applications in the Omani context.
1.3. Beyond descriptive analysis: advancing analytical techniques in e-commerce, business, and management with plspredict
As the final objective of this research, it is important to acknowledge that research in the fields of e-commerce, business, and management often relies on basic analytical techniques, such as descriptive analysis and basic PLS-SEM and CB-SEM techniques, without exploring more advanced analytical techniques. While variance-based analysis, like PLS-SEM, is commonly employed in these studies, there is a lack of extensive analysis and predictive procedures in areas such as marketing, business, and social sciences (Shmueli et al., Citation2019). Despite the evident relevance of prediction and predictive assessment in the field, the application of PLSpredict remains limited, likely due to its recent development and the need for clear guidance on its usage (Svensson et al., Citation2018). To address this gap, this study aims to provide empirical evidence supporting the use of PLSpredict and pioneer the inclusion of these advanced techniques, thereby increasing researchers’ familiarity with this procedure. By offering a real-world example and contributing to academic literature, this research endeavors to fill the void. While conducting more in-depth and extensive analyses may require additional effort, it is crucial to employ such methods in order to bridge this existing gap and aid researchers in developing comprehensive analytical reports. This approach can enhance the authenticity and reliability of the results derived from the basic analysis procedures.
All the issues elucidated in the above sub-sections have been taken into consideration to investigate the factors that affect the usage, acceptance, and adoption of delivery services and related applications in Oman during the Covid-19 lockdown. Consequently, the study aims to achieve the following research objectives:
To find out and validate a model that can explain the main drivers of the customers’ usage, acceptance, and adoption of the delivery service companies and related applications in Oman in order to help them cope with Covid-19 lockdown procedures and meet their wants and expectations in receiving their online purchased orders.
To perform an advanced and comprehensive analysis utilizing state-of-the-art prediction analysis methods, specifically employing the latest advancements in PLSpredict for conducting sophisticated analyses.
To assess the role of customer intention to use, accept, and adopt the delivery service companies and related applications in Omani context in order to help them cope with Covid-19 lockdown procedures in receiving their online purchased orders.
To investigate the key role played by the influence of customer satisfaction on the customers’ usage, acceptance, and adoption of the delivery service companies and related applications in Oman in order to help them cope with Covid-19 curfew procedures and meet their wants and expectations in receiving their online purchased orders.
To probe the influence of customer trust and quality of service of delivered services as antecedents of customer satisfaction in the model suggested.
To analyze the vital role of social influence in bringing the intention of others (e.g., friends, colleagues, relatives, and family members) towards customers’ usage, acceptance, and adoption of the delivery service companies and related applications in Oman in order to meet their needs and expectations in receiving their online purchased orders.
To achieve the objectives of the study, a quantitative research approach was employed, utilizing a survey instrument distributed to customers who have experience with delivery services companies in the Omani context. The subsequent sections are organized as follows: Firstly, the literature review focuses on the study model, underpinning theories, and their limitations in explaining the adoption process of delivery services. Additionally, pivotal factors that can contribute to achieving the study’s objective are explicated. Next, the importance of delivery services companies in the Omani context is explained, providing context for the subsequent analysis. Hypothesis development is then presented, highlighting the underlying theories and key constructs that influence the usage, acceptance, and adoption of delivery services and related applications. Following that, the research methodology is explained, detailing the approach taken in data collection and analysis. Moreover, the analysis and discussions section provides the interpretation of PLS-SEM (Partial Least Squares-Sequential Equation Modeling) results, along with relevant discussions. Furthermore, theoretical and managerial implications, as well as the methodological contribution, are discussed. The limitations of the study and directions for future research are also addressed. Finally, the conclusion is drawn based on the results obtained and the objectives of the study.
2. Literature review and hypotheses development
This section provides background on the underpinning theories, defines the main dependent (endogenous) construct of the research—the usage, acceptance, and adoption of the delivery services and related applications—as well as explains the influencing factors of the exogenous constructs on the endogenous construct, i.e., perceived ease of use, perceived usefulness, customer behavior intention, customer satisfaction, customer trust, and quality of services of the delivered items/orders/services. In addition, the hypotheses were developed and highlighted.
2.1. The study model and underpinning theories
2.1.1. TAM and TPB in explaining adoption of delivery services behaviors and their limitations
TAM is a relatively simple theory that proposes that perceived usefulness and perceived ease of use are two factors that influence an individual’s intention to use a technology. On the other hand, TPB is a more complex theory that suggests an individual’s intention to engage in a behavior is influenced by three factors: attitude, subjective norms, and perceived behavioral control. Both TAM and TPB have demonstrated effectiveness in explaining adoption behaviors in various contexts. However, it is important to acknowledge that these theories are not without limitations. They have been criticized for their perceived simplicity and for not adequately considering the role of social context in the adoption process.
Figure illustrates both theories. In their article, Davis et al. (Citation1989) critique TAM for its simplicity and its failure to consider the influence of social context on IT adoption. They argue that TAM overlooks factors like peer pressure, social norms, and organizational culture in the adoption process. While TAM is valuable for understanding the factors that influence user acceptance of computer technology, it falls short as a complete explanation. According to them, other factors, including social context, also play a significant role in the adoption process. They emphasize the importance of considering these additional factors when devising strategies to enhance user acceptance.
Figure 1. TAM and TPB Theoretical Frameworks.
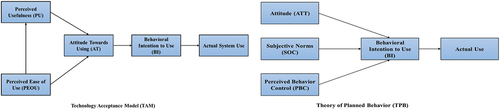
Rogers (Citation2003) posits that the adoption of new technologies is a complex process influenced by multiple factors, including social context. Given the limitations of TAM, this study integrates the theory of planned behavior (TPB; Fishbein & Ajzen, Citation1975) to address this gap. TPB, as a more comprehensive model of human behavior, encompasses a broader range of factors, including social context. However, it is essential to note that TPB is not a flawless model of human behavior, and individuals may still exhibit behavior inconsistent with their intentions, particularly when examining the adoption of delivery services. Thus, this study incorporates the perceived ease of use and perceived usefulness from TAM to represent attitude, while also considering subjective norms (i.e., social influence) to compensate for the limitations of TAM. Furthermore, the adoption of delivery services may be influenced by additional factors such as trust in the delivery service provider, customer perception of service quality, and satisfaction. Therefore, it is more plausible and justifiable to include these three factors in the study.
2.1.2. Pivotal factors influencing the adoption of online delivery services applications
In the internet age, TAM and TPB can be used to explain the adoption of delivery services in a number of ways. In the theory of technology acceptance model (TAM), perceived ease of use and perceived usefulness are the main pillars of the intention (Davis, Citation1989). The researchers argue that perceived usefulness of delivery services is likely to be high. Delivery services can save people time and effort, and they can also provide access to goods and services that are not available locally. Second, the perceived ease of use of delivery services is also likely to be high. Delivery services are typically easy to use, and they often offer a variety of features that make them convenient for users. Third, Ajzen and Fishbein (Citation1980) in the Theory of Planned Behavior (TPB) contended that the more perceived important referents think that others should engage in a specific behavior, the higher the inclination and motivation to perform the behavior. Therefore, in TPB, social influence is considered one of the vital constituents of the behavior intention that significantly and positively correlates with intention; hence, inclusion of the social norms is warranted in the suggested model of the current research.
Moreover, various studies examined the relationship between perceived of use and perceived usefulness with behavior intention and empirical evidence was established (Kayali & Alaaraj, Citation2020; S. K. Sharma, Citation2019). Hence, the inclusion of these two constructs is justified to evaluate the relationships postulated and to achieve the objectives of the study. Also, in various contexts in literature, there are proliferation of studies that evaluate the relationship between subjective norms or social influence and behavioral intention. Although there are discrepancies in the findings (Taufiq-Hail, Mohd Yusof et al., Citation2021) in this regard, majority of research have established empirically that social influence construct is a key element in predicting individuals’ purchase/use intentions in abundance of contexts (Al-Swidi et al., Citation2014; Rehman et al., Citation2022; Taufiq-Hail & Ibrahim, Citation2018; Yousaf et al., Citation2015).
In addition to TAM and TPB, other variables such as trust (Julfikar Ali et al., Citation2023), satisfaction (Ryu et al., Citation2012), and quality of service utilized to explain the adoption of delivery services (Saad, Citation2020). For example, social influence can elucidate how new delivery services are adopted over time. If individuals within a customer’s social circle have a positive impression of an e-retailer, it is plausible that others would be influenced to do the same, especially considering the social nature and collectivist culture prevalent in Oman.
Trust, as found in the literature (Julfikar Ali et al., Citation2023), is another influential factor in the adoption of technology and system usage. In the context of delivery services, trust in the service provider is essential. Customers need to have confidence in the reliability, security, and privacy of their personal information and transactions. A trustworthy delivery service creates a sense of assurance and reduces perceived risks, thereby encouraging adoption.
Additionally, customer satisfaction also plays a vital role in determining the rate of adoption of delivery services (Ryu et al., Citation2012). When customers are satisfied with the overall experience, including the timeliness, accuracy, and condition of their delivered goods, they are more likely to continue using the service and recommend it to others. Satisfied customers serve as positive influencers, driving adoption through word-of-mouth recommendations and social sharing.
Furthermore, the quality of services offered by delivery providers significantly impacts the adoption process (Saad, Citation2020). Customers expect reliable and efficient delivery, responsive customer support, and hassle-free returns or exchanges. High-quality service enhances the overall user experience and fosters positive attitudes towards adopting and utilizing delivery services.
By incorporating trust, satisfaction, and quality of service into the existing TAM and TPB frameworks, a more comprehensive understanding of the factors driving the adoption of delivery services can be achieved. These additional factors provide valuable insights into the dynamics of consumer decision-making and help in formulating strategies to enhance adoption rates. Based on the above explicated review and justifications, the model suggested by the current research is theoretically established and supported by TAM and TPB, while extended by other constructs of satisfactions, trust, and quality of services to serve achieving the objectives of the study.
2.2. Importance of online delivery services companies in Oman
In principle, for a small population country like Oman, online delivery holds significant importance compared to physical deliveries of online-purchased goods and commodities. Oman’s relatively small population and limited number of retail stores, compared to other GCC countries like Saudi Arabia and the United Arab Emirates, make online delivery a crucial aspect of accessing a wide range of goods and services. Online delivery services overcome the challenges posed by limited local availability by providing access to a broader range of products and services. Customers can conveniently browse and order goods from various online platforms and have them delivered directly to their doorstep. This convenience factor is especially appealing in today’s fast-paced lifestyle, where customers seek time-saving solutions. The global emergence of online ordering and delivery services is a response to the increasing availability of the internet and the demands of busy lifestyles (Saad, Citation2020). Businesses have recognized the growing desire for convenient doorstep delivery, and online delivery services have become a significant sector in the market. Therefore, gaining a deeper understanding of the consumer landscape and the factors influencing the adoption of delivery services is crucial for unlocking the full potential of business opportunities, improving outcomes, and enhancing people’s quality of life. By acknowledging the unique characteristics and requirements of a small country like Oman, policymakers and businesses can tailor their strategies to maximize the benefits of online delivery services and address the specific needs of the population.
2.3. Acceptance and adoption of delivery services and applications (ACDS)
When a consumer requests information about a product or service, places an order, or pays via the Internet, they already hold preconceived notions about the target products or services. They proceed with the transaction only after evaluating the perceived value in terms of benefits, quality, timeliness, costs, and other factors. In this context, user acceptance and adoption of delivery services and related applications entail the process of accepting and adopting these services and applications based on their prior perceptions of their value. Consequently, user acceptance serves as a reliable indicator and a proxy for predicting actual behavior. As such, user acceptance can be categorized into acceptance of products and services, as well as acceptance of online offerings.
2.4. The relationship between customer behavior intention to use delivery services (CUSBI) and acceptance of delivery services and applications (ACDS)
The primary predictor of a behavior in question is considered to be the individual’s intention, as it indicates the individual’s relative ability to perform the desired behavior (Shin, Citation2013). Behavior intention refers to the “indications of how hard people are willing to try, of how much of an effort they are planning to exert, in order to perform the behavior” (Ajzen, Citation1991, p. 181). Based on the logic of the theory of reasoned actions or TRA by Ajzen (Citation1985), the greater user-positive feelings toward the services delivered, the greater propensity to utilize the services and applications of delivery service companies and related applications.
In the current research, CSUBI is defined as the customer’s ability to perform an online purchase that is accompanied by using delivery services and related applications offered by the online store or third-party delivery services agent to get the customer’s fixed orders. It is worth noting that behavioral intention has been widely employed in the literature across various contexts and models, demonstrating its robustness as a significant predictor of the adoption process and acceptance of specific services or technologies (Arkorful et al., Citation2021; Dong et al., Citation2017; Groß, Citation2018; Kayali & Alaaraj, Citation2020; Rehman et al., Citation2022; Taufiq-Hail, Rheal et al., Citation2021). Moreover, numerous models and theories incorporate behavioral intention into their frameworks, such as the Theory of Reasoned Action (TRA; Ajzen & Fishbein, Citation1977), Technology acceptance model (TAM; Davis, Citation1989), and theory of planned behavior (TPB; Ajzen, Citation1991). All of these theories emphasize the pivotal role of behavioral intention as a driver of behavior, acceptance, or adoption of a system, innovative technology, or services. Building upon this background, the researchers posit the following hypotheses:
H1. CUSBI exerts a statistically significant and positive role on adopting and accepting the services (ACDS) offered by the delivery services companies and related applications.
2.5. The relationship between perceived ease of use (PEOU) and customer behavior intention (CUSBI)
Perceived ease of use (PEOU) is defined as “the degree to which a person believes that using a particular system would be free of effort” (Davis, Citation1989, p. 320). In the context of the current research, PEOU is defined as the extent to which the customer believes that using and adopting the services offered by the delivery services company (either offered by the online store or by a third-party agent) and its related application would facilitate the delivery process of purchased items or products and would be effortless, helpful, and complying with the imposed regulations of curfew during period of Covid-19 lockdown.
In the original model of TAM, the main pillars of the behavior intention are perceived ease of use and perceived usefulness. Interestingly, in the original model attitude mediated the relationship between perceived usefulness and ease of use toward behavior intention. In later models, the attitude is omitted from the model (Venkatesh & Bala, Citation2008; Venkatesh & Davis, Citation2000). The rationale behind that could be referred to the weakness of the mediating role of the attitude in the relationship between perceived usefulness and PEOU with behavior intention (Y. Wang et al., Citation2020). Also, Venkatesh (Citation2000) suggested that the simplified version of TAM may expose more predictive power than the original TAM. Reviewing the previous works in literature, the theoretical foundation is established (Venkatesh & Bala, Citation2008; Venkatesh & Davis, Citation2000) and empirically a wide area of research confirm the positive and statistically significant relationship between perceived ease of use and behavior intention in different disciplines (Hamid et al., Citation2016; Kim et al., Citation2010; Ray et al., Citation2019; Singh et al., Citation2020; Tahar et al., Citation2020; Y. Wang et al., Citation2020). Taking into account the aforementioned considerations, the researchers assume the following hypothesis:
H2. PEOU has a significant and positive relationship with customer’s behavior intention (CUSBI) to use, accepts, and adopt the services offered by delivery services companies and related applications.
2.6. The relationship between perceived usefulness (PU) and customer behavior intention (CUSBI)
Perceived usefulness is described as, “the degree to which a person believes that using a particular system would enhance his or her job performance” (Davis, Citation1989, p. 320). In another context, perceived usefulness is defined as the consumer’s perception of how well mobile services integrate into their daily activities (Park & Chen, Citation2007). In the context of the current study, it is defined as the extent to which customers believe that using delivery services and related applications would facilitate their shopping behavior and seamlessly integrate into their daily purchase and shopping activities, particularly during critical periods such as the Covid-19 curfew.
It has been suggested that one of the primary reasons for the slow diffusion and acceptance of innovative technologies is the failure to clearly communicate the potential benefits to users (i.e., demonstrating the usefulness of the technology; X. Chen et al., Citation2019). Therefore, a comprehensive understanding of the benefits is crucial. Additionally, existing literature indicates that perceived usefulness significantly impacts individuals’ intention to adopt technological innovations, subsequently influencing their actual usage (Singh et al., Citation2020).
Furthermore, the theoretical foundation of Technology Acceptance Model (TAM) proposed by Davis (Citation1989) highlights the significance of perceived usefulness (PU) and perceived ease of use (PEOU) in determining user acceptance of technology and behavior. TAM posits that individuals’ technology usage is influenced by these two cognitive factors (Brandon-Jones & Kauppi, Citation2018). Previous studies have consistently underscored the pivotal role of perceived usefulness in shaping users’ intentions to adopt or utilize a particular service or technology. For instance, Kim et al. (Citation2010) conducted a study on the adoption behavior of mobile payment services and found a positive and statistically significant relationship between perceived usefulness and intention to use. Similarly, a study in the context of mobile commerce (m-commerce) concluded that the adoption of m-commerce is linked to the tangible benefits it offers, particularly in terms of convenience, which subsequently increases consumer adoption rates (Faqih & Jaradat, Citation2015). Another investigation by Brandon-Jones and Kauppi (Citation2018), focusing on factors influencing the acceptance of e-procurement, identified perceived usefulness as a critical determinant of online banking adoption. In the same vein, Pikkarainen et al. (Citation2004) found empirical evidence supporting the crucial role of perceived usefulness in influencing consumers’ intentions to use online banking services in Finland.
Furthermore, a recent work of X. Chen et al. (Citation2019) emphasizes the importance of perceived usefulness in the acceptance of mobile community applications, as well as other technologies and services. According to the study, users need to perceive that the application provides sufficient utility to facilitate their participation in online communities. X. Chen et al. (Citation2019) further posit that perceived usefulness has a direct impact on users’ responses to applications, influencing their attitudes and willingness to engage with them. This underscores the critical role of perceived usefulness in stimulating users’ willingness, which, in turn, drives their intention to use or adopt the respective system or technology. Moreover, Çelik (Citation2008) conducted a web-based survey to investigate the adoption of online banking among Turkish users. The findings of this study confirm the significant role of perceived usefulness in influencing Turkish users’ intentions to adopt online banking services. Drawing from both empirical and theoretical support, we propose that higher levels of perceived usefulness associated with delivery services and their applications will correspond to higher intentions to adopt and accept the service and its associated system. Based on this rationale, the following hypothesis is suggested:
H3. PU has a significant and positive relationship with customer’s behavior intention (CUSBI) to use, accept, and adopt the services offered by delivery services companies and its related applications.
2.7. The relationship between customer social influence (SOC) and customer behavior intention (CUSBI)
Social influence is defined as, “the extent to which consumers perceive that important others (e.g., family and friends) believe they should use a particular technology” (Venkatesh et al., Citation2012, p. 159). By reviewing the literature, some former works classify the social influence into two types: the interpersonal influence (i.e., typically resulted by social networks such as family members, peers, colleagues, friends, and superiors) and the mass media influence (e.g., magazines, radio, TV, newspapers, the internet and other relevant mediums; Hew et al., Citation2015). On the other hand, other scholars view social influence with two basic factors: 1) the normative beliefs where an individual associates with the referents and 2) the propensity to comply with the referent’s desires in performing an action or complying with their wants or needs (Purani et al., Citation2019). In the context of the current study, SOC is defined as the extent to which customers perceive the important others (e.g., family members, friends, and/or others in the social circle) believe that using the delivery services and applications offered by the online stores or any third-party is essential and sometimes a must especially during Covid-19 lockdown.
Reviewing the literature, there are studies that underpin the significant role of social influence in many areas of research. For instance, the role of social influence on the adoption and usage process is confirmed in many previous works (M.-C. Lee, Citation2009; Olasina, Citation2019; Sangeeta & Tandon, Citation2021; Tseng et al., Citation2022; Verkijika, Citation2018). Other works view SOC as an influencer to behavior intention (Abu-Taieh et al., Citation2022; Kulviwat et al., Citation2009; Rehman et al., Citation2022; Sareen & Jain, Citation2014). For example, social pressure by friends, colleagues, and relatives has been identified in many areas of research to influence the behavior intention of customers (Abu-Taieh et al., Citation2022; Kayali & Alaaraj, Citation2020; Kulviwat et al., Citation2009; Rehman et al., Citation2022; Sareen & Jain, Citation2014) and in e-commerce online purchase context as people tend to be influenced by relatives, colleagues, or friends recommending a product, approving the e-shopping, or an online store services (Sareen & Jain, Citation2014). Also, the work of Kulviwat et al. (Citation2009) has proven the significant and positive relationship between SOC and behavior intention to adopt high-tech innovations. Moreover, Rehman et al. (Citation2022) in a recent research show that social influence affects the opinions of customers in taking action to buy or deal with a product, service, or company as exchanging experience and knowledge become handy especially with the advent and proliferation of social media networks. Furthermore, the role of SOC was proven to be significant and positively influencing behavior intention of customers to use m-banking services, especially during COVID-19 pandemic lockdown procedures (Abu-Taieh et al., Citation2022). However, there were other studies that contradicted the previous findings and they did not find any effect of SOC on the behavior intention (Chopdar et al., Citation2018; Hew et al., Citation2015). Tseng et al. (Citation2022) resonated the contradicting findings to the variety of research conducted in different settings. Away from that and according to social influence theory, social groups can impose normative influence by using compliance mechanisms to persuade group members to use or adopt a specific behavior. In other words, SOC can be considered as the capacity to conform to another’s positive expectations and the propensity to accept information obtained from another as proof of reality (Deutsch & Gerard, Citation1955). According Hofstede et al. (Citation2010), collectivist cultures are socially oriented and place a higher premium on group opinion than on individual opinion. The Omani culture is under this classification and is socially connected with strong bonds among different society figures. This is due to the strong Arab values and religion teachings that advocate and formulized the culture; hence, this justifies the inclusion of SOC in the model suggested.
Moreover, since the delivery services companies with related application were the only means to use and get the essentials and purchased goods during Covid-19 curfew, the researchers assume that it is more likely and plausible that the users would develop an intention, either positively or negatively, based on the experiences and perceptions of the social influencer and form their behavior towards the acceptance and adoption of delivery services provided and related applications. Consequently, the following hypothesis is postulated:
H4. There is a statistically significant and positive relationship between social influence (SOC) and customer’s behavior intention (CUSBI) to use, accept, and adopt delivery services and its related applications.
2.8. The relationship between customer satisfaction (CSAT) and acceptance and adoption of delivery services and related applications (ACDS)
Satisfaction is a key element in business continuity. Some scholars define it as the difference between the expectations of customers before their purchase and the evaluation after purchase (Rodríguez et al., Citation2020). Other scholars perceive satisfaction as the degree of interaction between the service providers and those seeking their services (Arkorful et al., Citation2021). Another definition is stated by M.-T. Tsai et al. (Citation2010) where they define customer satisfaction as “an expression of pleasure or dissatisfaction as a result of a comparison of perceived and expected product function/effect.” This means that the reaction of customers could be positive or negative depending on how the customer expectations are after their experience compared with pre-experience of a certain service/product. Therefore, in the current study customer satisfaction is defined as the pleasure or disappointment felt/perceived by the customers as well as the difference between their expectations before using the delivery services and related applications and their evaluation after using such services. Based on this definition, it could be said that during Covid-19 lockdown if those who used the delivery services and related applications formed a positive experience and are satisfied, it is more likely that others will be encouraged to do so especially those within one's social circle. Hence, understanding the relationship between satisfaction of the service delivery and related applications and the actual usage and adoption is crucial as new delivery service companies and agents emerged during Covid-19 lockdown in the Sultanate of Oman to cope with the sudden change and way to deal and manage life effectively. On the other hand, customer retention is a crucial factor to continue business success and ensures that customer–retailer relationship continues in a win–win relationship. Besides, customers’ retention is reflected by their satisfaction and proliferation of studies in literature show that satisfaction is a vital element in retaining customer to continue shopping from their preferred entities (Mahmoud et al., Citation2018; Ranaweera & Prabhu, Citation2003). This means that if there is a high level of satisfaction, it is plausible to assume that customer retention is high and therefore this leads to the adoption, acceptance, and continual online purchase behavior that is aligned by delivery of purchased items. Furthermore, it is argued in previous works that customer satisfaction has been proven to be a major influencer on behavioral intentions; as the more satisfaction the people have on a product or services, the more likely that they will retain using it, be loyal, and spread positive word of mouth among people around them (Sharabati et al., Citation2022) and eventually leading to the adoption and usage of such product or service. Also, a recent study on the usage of health insurance systems underscores the significant and positive role of satisfaction on the behavior intention (Arkorful et al., Citation2021). Further, there is a consensus among scholars that behavior intention is a key driver of behavior, usage, and adoption. The same logic holds here, and researchers assume that satisfaction affect behavior directly. Based on these arguments, the researchers pose the following hypothesis:
H5. There is a statistically significant and positive relationship between customer satisfaction (CSAT) and using, accepting, and adopting delivery services and related applications (ACDS) during Covid-19 pandemic.
2.9. The relationship between customer trust (CUSTR) and customer satisfaction CSAT)
In previous work, trust has been defined as “the expectations held by the consumer that the service provider is dependable and can be relied on to deliver on its promises” (Sirdeshmukh et al., Citation2002, p. 17). Similarly, in the context of e-retailers, trust is defined as the ability of the e-retailer to fulfill its obligations and establish a reliable business relationship with the customer (S.-C. Chen, Citation2012). For the purposes of the current study, customer trust (CUSTR) is defined as the delivery services company’s ability to fulfill its obligations, demonstrate dependability and reliability, and meet customer expectations by delivering items or orders in excellent condition, on time, and to the correct location. Furthermore, the delivery services company should provide customers with a tracking system, typically through an application, to keep them updated on the status of their items.
The literature review reveals that customer behavior is highly influenced by trust (Morgan & Hunt, Citation1994), and trust plays a crucial role in shaping online purchase intentions (Schlosser et al., Citation2006). Previous studies have shown that trust in an online retailer leads to increased willingness to make purchases (Luarn & Lin, Citation2003) and that trust in an e-service provider fosters greater customer loyalty (Cyr et al., Citation2007). The presence or absence of trust can have a significant psychological impact on customers, either motivating them to adopt and utilize services or hindering them from doing so. Moreover, earlier research recognizes customer trust as a critical driver of customer satisfaction (Bahadur et al., Citation2020; Santa et al., Citation2019; Tran & Vu, Citation2019), with a positive association observed between the two (Bahadur et al., Citation2020). Bahadur et al. (Citation2020) also found that the growth of customers’ trust in service employees is linked to their satisfaction with the services offered by those employees. Trust is considered a vital and indispensable factor in electronic commerce, as it helps cultivate loyal and highly satisfied customers. Additionally, an increased level of trust is believed to directly and positively impact customer satisfaction, facilitating the establishment of bilateral relationships that lead to user adoption and utilization of the offered services and applications. This perspective is in line with various studies that position trust as an antecedent of satisfaction (Armstrong & Yee, Citation2001; Dehghanpouri et al., Citation2020; Liu & Leach, Citation2001; Loeser et al., Citation2017; Santa et al., Citation2019; Tran & Vu, Citation2019; Wetzels et al., Citation2009; Wibowo et al., Citation2019). Furthermore, scholars such as Morgan and Hunt (Citation1994) characterize trust as confidence in an exchange partner’s reliability and integrity, as well as a willingness to rely on that confidence (Moorman et al., Citation1993). Consequently, trust is regarded as a vital component for establishing satisfying interactions between customers and sellers (Armstrong & Yee, Citation2001), and it is postulated that trust leads to satisfaction in customer-seller exchange relationships (Armstrong & Yee, Citation2001). Given the aforementioned explanation, the following hypothesis is postulated:
H6. Consumers’ perceived trust (CUSTR) of services offered by delivery services companies and related applications would positively and significantly influence the customer’s satisfaction (CSAT) to use, accept, and adopt these services offered and their applications.
2.10. The relationship between quality of service of delivery services (QSDSC) and customer satisfaction (CSAT)
In the realm of business, the intention to utilize a service is intricately tied to the provision of standardized, high-quality service. Extensive research has been conducted to explore this concept, and numerous theories and models have been put forth to address its multifaceted nature. While various definitions and measures of service quality have been proposed in the literature, there is no universally accepted definition of this concept (Al-Nawafleh et al., Citation2019). A service is a distinctive type of product that is characterized by its intangible nature (Hai et al., Citation2017). From a narrower perspective, quality has been recognized as the paramount strategic factor for attaining competitive advantage and improving services and products within organizations (Qutaishat et al., Citation2012). Service quality is defined as the difference between customer expectations regarding products/services and their level of awareness, and their feelings after using the products/services they purchased (Al-Nawafleh et al., Citation2019). In other words, service quality encapsulates the variance between the anticipated quality prior to the purchase process and the actual quality perceived by the consumer after the purchase has been made (Al-Nawafleh et al., Citation2019). Within the context of this study, service quality is delineated as the gap between customer expectations regarding the delivered products/services and their awareness, as well as their sentiments subsequent to receiving the products or experiencing the delivery services.
Parasuraman et al. (Citation1988) developed a comprehensive 22-item instrument to assess service quality, encompassing ten dimensions: tangibles, reliability, responsiveness, communication, credibility, competency, courtesy, security, access, and understanding/knowledge of the customer. This instrument is used to evaluate customer expectations and perceptions of service quality in both service and retail organizations. Previous research has demonstrated the effectiveness of service quality in determining the success of information systems (Kettinger & Lee, Citation1994; Watson et al., Citation1998). Furthermore, service quality has been found to influence consumer willingness to engage in online shopping (Liao & Cheung, Citation2001). During the Covid-19 pandemic lockdown, customers searching for products or services became concerned about the delivery process. Having a delivery service that meets their needs, perceptions, and expectations encourages customers to make online purchases from stores, malls, restaurants, and other establishments that offer delivery services, either directly or through a third-party delivery service company. Numerous studies in the literature highlight the positive and significant relationship between service quality and customer satisfaction across various research domains (Chiu et al., Citation2007; Dehghanpouri et al., Citation2020; Kasiri et al., Citation2017; S. Lee & Kim, Citation2017; Lien et al., Citation2017; Zheng et al., Citation2013). The present research aligns with this line of research by establishing the relationship between QADSC and CSAT. Hence, in this extended model proposed in the current study, the researchers posit the following hypothesis:
H7. Consumers’ perceived tangible quality of services (QSDSC) offered by delivery services companies and related applications would positively and significantly impact the customer’s satisfaction (CSAT) to use, accept, and adopt these services offered and their applications.
3. Methodology
3.1. Sampling method and data collection procedures
The current study employed a quantitative survey instrument utilizing probability systematic random sampling techniques to collect data. A web-based Google Forms survey instrument was employed to gather online responses. Data collection took place over a period of four weeks, starting from the early days of March 2022, targeting individuals who had utilized delivery services during the pandemic. To determine the minimum sample size for the current research, considering the presence of seven exogenous constructs (i.e., independent variables), the G*power software analytical tool (Faul et al., Citation2009) was utilized. The analysis yielded a minimum required sample size of 103, with a power of 0.80, alpha error probability of 0.05, and a medium effect size of 0.15 (Hair et al., Citation2014). A total of 321 valid responses were obtained after eliminating 35 incomplete responses, resulting in a response rate of 90%. It is important to note that the sampling unit for this study is individuals who engaged in online purchases during the Covid-19 lockdown, specifically utilizing delivery services companies and related services.
3.2. Survey design, survey items and scale
The original version of the questionnaire was in English; however, to fulfill the objectives of the study and target a wider audience, the researchers decided to translate the survey into Arabic. Both versions of the questionnaire were included in the same survey to ensure inclusivity. A back-to-back translation approach was employed, and face validity was conducted to ensure consistency and accuracy. The survey instrument was then presented to five academicians and experts in questionnaire development. Their feedback was sought on various aspects including content, wording, question suitability, presentation, ease of understanding, and coverage of construct dimensions as perceived by the researchers. This expert feedback was crucial in refining the questionnaire. The study followed a three-stage process in building the questionnaire, starting with the adaptation of questions from relevant literature. The first stage involved a pre-test with five undergraduate students and five adult volunteers to assess the initial version of the questionnaire. In the second stage, a pilot test was conducted with 30 respondents from the target population. Based on the feedback received from these stages, revisions were made to the final definitive draft of the questionnaire. The final survey questionnaire, incorporating the necessary adjustments, was then distributed to respondents using a Google Forms link. The survey comprised two main parts: the first part focused on capturing the demographic profile of the respondents, while the second part addressed the hypotheses under investigation. In the demographic part, respondents were asked to provide the following data: age, gender, educational level, whether they have ever used delivery service applications or not, and if they are regular users of delivery service applications. To ensure research consistency, only those who had used delivery service applications were included for analysis, while others were eliminated.
For the second part of the questionnaire, a five-point Likert scale ranging from (1) strongly disagree to (5) strongly agree was utilized for all items in the model. The ACDS construct comprised five items adapted from existing literature (Renda Dos Santos & Okazaki, Citation2016; Taufiq-Hail, Rheal et al., Citation2021). The CUSBI construct consisted of five items adapted from previous works (Davis, Citation1989; Taufiq-Hail, Rheal et al., Citation2021; Venkatesh & Davis, Citation2000; Y.-S. Wang, Citation2008). CSAT (CSAT1-CSAT11) included 11 items adopted from established works (Idemudia et al., Citation2018; Khan et al., Citation2019; Vakulenko et al., Citation2019; Y.-S. Wang, Citation2008). CUSTR (CUSTR1–CUSTR7) composed of 7 items adapted from H.-T. Tsai et al. (Citation2006). On the other hand, three constructs—PU (PU1-PU4), PEOU (PEOU1-PEOU4), and SOC (SOC1-SOC4)—each comprised four items and were adapted from sources such as Liébana-Cabanillas et al. (Citation2018), Taufiq-Hail, Mohd Yusof et al. (Citation2021), Rehman et al. (Citation2022), and Venkatesh and Davis (Citation2000).
To evaluate the survey items and test the postulated hypotheses, Smart PLS 4 (Ringle et al., Citation2022), a Partial Least Squares-Structural Equation Modeling (PLS-SEM) software package, was utilized. A total of 48 items, along with the demographic section, successfully passed the evaluation process. Further details regarding the measurement model can be found in the Results and Discussion section.
3.3. Common method bias test
In the current research, the full collinearity VIFs, as proposed by Kock and Lynn (Citation2012) and following the work of (Purani et al., Citation2019), was used as a post-hoc analyses to screen for common method bias of the data collected. This test of full collinearity examines the existence of possible collinearity issues between all variables in the model regardless of their location (Kock & Lynn, Citation2012). It has been noted that full collinearity VIFs for common method bias tests are more stable and more advanced than the conventional exploratory factor analysis test (Purani et al., Citation2019). A rule of thumb holds that a full collinearity VIF < 5 indicates no common method bias (Hair et al., Citation2011). The full collinearly VIFs presented in Table imply that there are no significant concerns of common method bias issues.
4. Data analysis and discussion
4.1. Respondents’ profile
The questionnaire included demographic information such as gender, age, and educational level. As shown in Table , the results for gender indicate that female participants accounted for 79% of the sample, while male participants represented 21%. The age of the participants fell into two categories, with 21% in the first category (18–27) and the majority, 79%, in the second category (28–37). Regarding educational level, participants with a high-school education or below accounted for 21% of the sample, followed by those with a general diploma (17%), bachelor’s degree (58%), master’s degree (2%), and PhD or above (1%). The results suggest that individuals with a bachelor’s degree are the most active users of delivery services, indicating that the younger generation is highly motivated to utilize technology for their shopping needs, thus contributing to this dominant ratio. In terms of differentiating between regular and experienced users of delivery service applications and non-experienced users, the results indicate that 56% of the respondents are experienced users, while 47% are non-regular users of these applications (refer to Figure ). For more detailed information, refer to Table .
Figure 2. Regular experienced users and non-regular users.
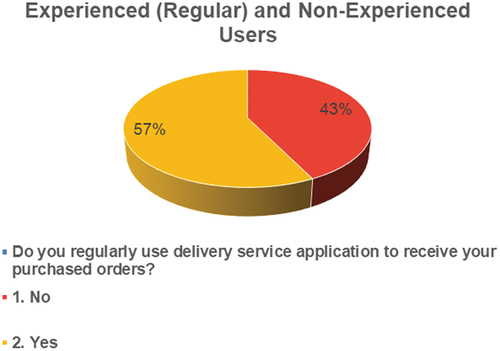
Table 1. Respondents’ demographics
It is worth noting that only respondents who used delivery service applications were included in the analysis, while others were excluded. Additionally, Figure illustrates the categorization of users into regular and non-regular users of these apps.
4.2. Measurement model evaluation
4.2.1. Convergent validity
Two types of constructs, reflective and formative, exist in this research. For this study, the reflective measurement construct is employed. The development of path models is based on two theories: the measurement theory and the structural theory (Hair et al., Citation2016, Citation2011). In the analysis phase, the first step involves evaluating the measurement model. Before hypotheses testing or the evaluation of the structural model takes place, there are a few preliminary procedures that need to be checked in PLS-SEM. Convergent validity is assessed to determine the extent to which the measures converge on a common construct. It is measured by evaluating the outer loadings, which should be greater than 0.7, and the average variance extracted (AVE), which should be equal to or greater than 0.7. Several considerations need to be taken into account during this test. Outer loadings equal to or above the cut-off value of 0.7 are considered acceptable and indicate that the items share a significant amount of variance with the same construct (Hair et al., Citation2017). Previous literature suggests that outer loadings ranging from 0.5 (Hair et al., Citation2010) to 0.7 or higher (Hair et al., Citation2017; Henseler & Chin, Citation2010) are acceptable and meet the thresholds for reliability and validity. Upon examining the values presented in Table , it is evident that there are no violations of this criterion. Specifically, in terms of the evaluation of construct convergent validity, the standardized indicator’s outer loading is obtained for all indicators, and all values surpass the cut-off threshold of 0.7. The obtained results indicate values ranging from 0.75 to 0.91, aligning with the recommended thresholds (Hair et al., Citation2016). Additionally, the AVE values show no violation of the cut-off values for all latent constructs, ranging from 0.62 to 0.79 (see Table for details).
Table 2. Internal consistency and reliability and convergent validity
It is important to note that in the reflective model, any item that falls below the aforementioned thresholds or whose removal would enhance the composite reliability/AVE of the related construct can be removed (Hair et al., Citation2016). In the tested model, no such measures were necessary as all values meet the criteria.
4.2.2. Internal consistency and reliability
The assessment of internal consistency and reliability in this study includes evaluating Composite Reliability (CR), the coefficient ρA, and Cronbach’s Alpha. Acceptable cut-off values for these measures fall within the range of 0.6–0.9 (Hair et al., Citation2016). Moreover, in exploratory research like the present study, acceptable cut-off values for item loadings range from 0.6 to 0.7, while values between 0.7 and 0.95 are considered satisfactory. Values below 0.6 indicate a lack of internal consistency reliability, while values above 0.95 are not desirable (Hair et al., Citation2016). Considering the aforementioned findings, the proposed model meets the criteria for internal consistency and reliability, as well as construct convergent validity.
4.2.3. Discriminant validity assessment
In evaluating discriminant validity, the indicators of each construct are examined to ensure that they are loaded only in their intended construct. This evaluation involves conducting cross-loading validation and applying the Fornell and Larcker criterion (Hair et al., Citation2016). Cross-loading validation involves assessing the loadings of items intended for one construct against loadings with other constructs. The results indicate that the criterion is met, as none of the items load higher in other constructs than in their own intended construct. The second test utilizes the Fornell and Larker (Citation1981) criterion to assess different constructs. The results demonstrate that the square root of the Average Variance Extracted (AVE) for each construct on the diagonal is higher than all correlations with other constructs in the corresponding row and column of the table (Fornell & Larker, Citation1981). The obtained results are presented in Table and Table . In conclusion, the results presented in this section establish the discriminant validity of all constructs based on the Fornell and Larcker criterion and cross-loadings.
Table 3. Discriminant validity with Fornell-Larker criterion analysis
Table 4. Cross-loading analysis in discriminant validity evaluation
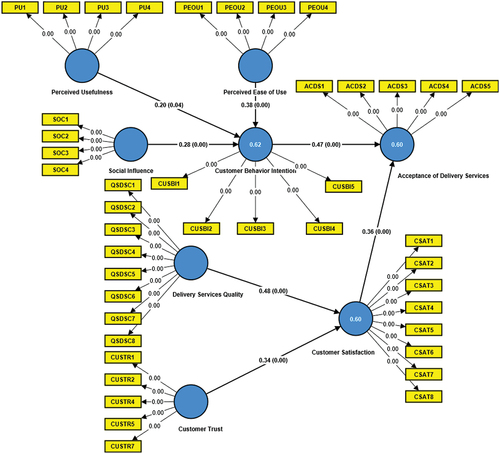
The final step in the analyses of the discriminant validity is to investigate the Heterotrait-Monotrait (HTMT inference) after running the complete bootstrapping with bias-corrected (BCa) confidence interval in SmartPLS 4. It is worth mentioning that the earlier two methods, i.e., the Fornell-Larker or cross-loading procedures, followed to evaluate the discriminant validity have drawbacks that lead to new methods to further investigate the discriminant validity of constructs. This new method is highly recommended by different scholars in literature (Hair et al., Citation2014, Citation2016; Henseler et al., Citation2015). This criteria include three procedures, the liberal two methods (HTMT.90 and HTMTinference) and one more conservative (HTMT.85; Henseler et al., Citation2015). In the current research, the HTMTinference is adopted, where it is used if two constructs are highly correlated—this is applicable in the current research—with values close to 1.0, specifically when (a) the loadings are high or (b) the sample size is large (Henseler et al., Citation2015). The guideline is that there should be no value of 1 in the two confidence interval boundaries (i.e., lower limit 2.5% and upper limit 97.5% CI) in all relationships after running the complete bootstrapping routine with BCa. The results obtained show no violations of this criterion and Table gives more evidence in achieving the criterion of discriminant validity for all constructs. Hence, the three measures to establish the discriminant validity are met and going to the second level of evaluation of the structural model (i.e., the hypotheses testing) is warranted. Furthermore, for demonstrative purposes, Figure illustrates the measurement model output as generated from the SmartPLS 4 (Ringle et al., Citation2022) analytical package.
Figure 3. Measurement model analyses.

Table 5. Discriminant validity with Heterotrait–Monotrait Ratio analysis
4.3. Structural model assessment
4.3.1. Collinearity assessment
In the earlier sections, the evaluation focused on the measurement model and now it is the second step to evaluate the structural model (the hypotheses testing) or the inner model. First of all, in evaluation of the structural model is to investigate the collinearity of the model through checking the threshold of VIF (Variance Inflation Factor) that should be ≤5 to avoid collinearity issues of the constructs. Each set of the predictor constructs are examined against their outcome constructs (Hair et al., Citation2016). As can be seen in Table , all predictors meet the criterion in having a VIF value ≤5, so the researchers proceed to the next step of the evaluation process.
Table 6. Collinearity assessment of the latent constructs with VIF values
4.3.2. Structural model path coefficients assessment
The estimates for the hypothesized relationships of the structural model are obtained by running the PLS algorithm, which is the standardized values of path coefficients. To estimate the significance of the path coefficients bootstrapping routine is run, which computes the t and p values in addition to confidence intervals. Further, statistical significance is accomplished when the t values are larger than a threshold, which are for the two-tailed tests: 1.65 (at significance level of 10%), 1.96 (at significant level of 5%), and 2.57 (at significance level of 1%). On the other hand, the one tail critical values are 1.28 (at significant level of 10%), 1.65 (at significant level of 5%), and 2.33 (at significant level of 1%). Besides, the 95% confidence interval (CI) provides information about the significance of the path coefficients. If the range of CI obtained does not include a zero value in the two bonds, this indicates the statistical significance of the value under consideration. Therefore, the setting used in SmartPLS 4 to reveal the significance of the hypotheses are as follows: 5000 subsamples, confidence interval with bias-corrected and accelerated bootstrap, and with two-tailed and significant level of 0.05.
4.3.2.1. Relationship CUSBI → ACDS
By referring to Table , the relationship CUSBI → ACDS appeared to be positively and statistically significant (β = 0.47, p < 0.05, t = 6.43). While inspecting the 95% confidence interval (CI) with bias-corrected and accelerated (BCa) settings, the results augment the significant effect of CUSBI on ACDS. That is, both boundaries of CI, the lower 2.5% and the upper 97.5% boundaries, do not include zero in its range [0.32–0.60]. Hence, H1 is empirically supported in the model postulated. To interpret the results, the path coefficient’s value (β = 0.47) combined with the moderate effect size (f2 = 0.14) (refer to Table for effect size values f2) demonstrates the critical significance of CUSBI in influencing ACDS. Thus, the findings offer added insights on the critical role of CUSIB in modeling and developing users’ behavior in utilizing and using the services and applications of the delivery services companies. These services are facilitated through the application that is within the fingertips. Additionally, the study’s findings indicate that end-users who responded to the survey have a significant preference of the delivery services and applications, which results in the technology’s acceptance and utilization of the service delivery application. Not surprisingly, the results correspond to prior research on the utilization the technology (Arkorful et al., Citation2021; Dong et al., Citation2017; Groß, Citation2018; Hassan et al., Citation2015; Kayali & Alaaraj, Citation2020; Rehman et al., Citation2022; Taufiq-Hail, Rheal et al., Citation2021). To summarize, the findings are consistent with previous works in addition to theories such as TRA (Rogers, Citation1983), TAM (Davis et al., Citation1989), and TPB (Ajzen, Citation1985).
Table 7. Structural model significance results—path coefficient
Table 8. Coefficients of determination R2 and effect size f2
4.3.2.2. Relationship PEOU → CUSBI
As seen in Table , the results show that PEOU has a direct impact on CUSBI with a positive pronounced value of β = 0.38, which is statistically significant (p < 0.05, t = 4.62). The confidence interval values support the significant effect of PEOU as no zero exists in its range [0.22–0.54]. Therefore, H2 is supported. To explain the findings, the path coefficient’s value (β = 0.38) combined with almost moderate effect size (f2 = 0.13) underscore that the critical and significant role of PEOU in influencing the interest of customers using the delivery services and related applications. The perceived easiness created a positive inclination that eventually drove their intention to use the delivery services and related applications in their shopping orders at the critical times of Covid-19 lockdown. This relationship is supported in previous works that studied the role of PEOU on the behavior intention (Faqih & Jaradat, Citation2015; Hamid et al., Citation2016; Kim et al., Citation2010; Singh et al., Citation2020; Tahar et al., Citation2020; Y. Wang et al., Citation2020). In addition, the easier the application and the way to communicate or deal with the delivery services’ company and related applications, the more likely the intention is driven towards the adoption, usage, utilization, or acceptance of the services offered by the delivery services’ companies and related applications.
4.3.2.3. Relationship PU → CUSBI
Table shows that PU is positively and significantly correlated with CUSIB (β = 0.20, p < 0.05, t = 2.01) and the confidence interval values [0.00–0.39] are aligned with these findings. Therefore, H3 is supported. The results revealed stress the significant role of the PU on driving the intention of the customers to use, utilize, adopt, or accept the services offered by the delivery services’ companies and related application during the curfew of Covid-19. In other words, it is clear that the participant customers have positive feelings towards these services and their perception positively reflects the positive and thorough understanding of the tangible benefits of such services during the lockdown. To sum up, the more useful and tangible benefits of the services perceived, the more likely are the customers to develop the intention to adopt and accept the services offered by the delivery services’ companies and related applications. Moreover, this finding is congruent with former works that studied the role of PU on the intention process to develop a behavior (Brandon-Jones & Kauppi, Citation2018; Çelik, Citation2008; Faqih & Jaradat, Citation2015; Kim et al., Citation2010; Pikkarainen et al., Citation2004; Smith, Citation2008).
4.3.2.4. Relationship SOC → CUSBI
Table demonstrates the positive and significant correlation of SOC with CUSIB (β = 0.28, p < 0.05, t = 3.80). The confidence interval values [0.14–0.43] are congruent with these findings. Therefore, H4 is supported. The findings confirm the significant role of the social influence in the Omani context on driving the intention of the customers to use, utilize, adopt, or accept the delivery services applications during the curfew of Covid-19. In other words, within the social circle of customers who used the delivery services, there is a strong social influencer to provoke the intention of the friends, family members, or relatives to use or adopt the delivery services and related applications based on their positive perception and experience as well as the tangible benefits, usefulness, and compliance with the emergent rules and regulations during Covid-19 pandemic. This is aligned with the arguments of Chaouali et al. (Citation2016) where they debate that when an individual considers referents in her/his social circle thinking that the adoption of new technology has positive outcomes, this would eventually lead her/him to be more motivated and persuaded to adopt her/his opinion and share the same conviction (Chaouali et al., Citation2016). In other words, the social impact is found to be one of the critical factors that drives the customers’ intention to use and adopt the delivery services applications in the Omani context. The more socially connected environment—as is the case in the Omani culture—the more likely the customers would develop a positive intention toward the adoption and acceptance of the delivery services’ companies and related application during the critical times if the experience and feedback is expressed are positively held by the social influencers. This finding is consistent with former works that studied the role of social bounds and social influence on the intention process to develop a positive behavior that leads to the usage and adoption (Abu-Taieh et al., Citation2022; Groß, Citation2018; Kayali & Alaaraj, Citation2020; Kulviwat et al., Citation2009; Rehman et al., Citation2022; Sareen & Jain, Citation2014).
4.3.2.5. Relationship CSAT → ACDS
As seen in Table , the results reveal that CSAT has a direct effect on ACDS with a positive pronounced value of β = 0.36, which is significant (p < 0.05, t = 4.98). The results are supported by the confidence interval values with bias-corrected and accelerated (BCa) settings, where no zero exists in its range [0.22–0.50]. Therefore, H5 is supported. To explain the results, the findings offer more understanding of the critical role of CSAT in influencing users’ behavior in utilizing and using the delivery services and related applications of the delivery services companies. Additionally, the study’s findings indicate that end-users’ satisfaction is a key factor in the adoption process and acceptance of such services. This is aligned the views of Groß (Citation2018) who argues that if expectation are met or even exceeded, this would most likely lead to make consumers re-engage in the same m-shopping activities and not discontinuing to do so (Groß, Citation2018). That is to say, if users are satisfied with the services offered or provided, it is more likely to drive them to adopt and accept such services that lead to suffice their needs and preferences. Besides, the findings of the current research are aligned with the previous works that show the positive and statistically significant correlation between satisfaction and the adoption or acceptance (Groß, Citation2018; Mahmoud et al., Citation2018; Ranaweera & Prabhu, Citation2003).
4.3.2.6. Relationship CUSTR → CSAT
The findings in Table show the positive and significant correlation between CUSTR and CSAT (β = 0.29, p < 0.05, t = 3.56) and the confidence interval values are aligned with these findings [0.15–0.52], where no zero-value appearing in the range. Hence, H6 is supported. The findings appear to support the significant role of the customer trust in building a good communication channel between the customer using the services and the delivery services’ company as well as to endure the effective business relationship between them. This trust significantly boosts and drives the customer’s satisfaction that in turn encourages the customer to adopt or accept the delivery services and related applications in the daily shopping orders in Omani context during the period of Covid-19 pandemic. To explain, if the customer perceives confidence and has established a positive feeling in meeting her/his aimed services based on established conditions between her/him and the delivery services company, it is more likely that this would increase her/his satisfaction that eventually leads to the adoption and acceptance of the services offered/provided by the delivery services companies and related applications. Reviewing the literature confirms the relationship between CUSTR and CSAT in many works (Armstrong & Yee, Citation2001; Dehghanpouri et al., Citation2020; Liu & Leach, Citation2001; Tran & Vu, Citation2019; Wibowo et al., Citation2019). Moreover, CUSTR exerts a strong correlation with CSAT and that leads the researchers to highlight its significant role in the adoption and acceptance process.
4.3.2.7. Relationship QSDSC → CSAT
Table shows that QSDSC is positively and significantly associated with CSAT (β = 0.48, p < 0.05, t = 5.13) and the confidence interval values [0.29–0.66] are aligned with these findings. Therefore, H7 is supported. The findings assert the significant role of the quality of services in driving the customer’s satisfaction that in turn encourages the customer to adopt or accept the delivery services company and related applications in the daily shopping orders in Omani context during the period of Covid-19 pandemic. To explain, if the customer perceives the quality of services as high and tangible, it is more likely that this would increase her/his satisfaction that in turn leads to the adoption or acceptance of the delivery services companies and related applications. Reviewing the literature confirms the relationship between QSDSC and CSAT (Chiu et al., Citation2007; Dehghanpouri et al., Citation2020; Kasiri et al., Citation2017; Kettinger & Lee, Citation1994; S. Lee & Kim, Citation2017; Lien et al., Citation2017; Watson et al., Citation1998; Zheng et al., Citation2013). Also, it can be inferred from the results gained that there is a significant role of the quality of services in the adoption and acceptance process of any service or application. Moreover, QSDSC exerts a strong correlation with CSAT and that leads the researchers to highlight its role in the adoption and acceptance process.
To summarize all of the above structural relationships and their related statistics, refer to Figure .
Figure 4. Structural model results.
4.3.3. Coefficient of determination (R2) and effect size assessment (f2)
The coefficient of determination or R2 is very important to evaluate the model and testing the hypotheses. It is the amount of the combined effects of all independent constructs on the dependent construct. R2 represents the in-sample predictive accuracy (Rigdon, Citation2012; Sarstedt et al., Citation2014) and the suggested cut-off values by Chin (Citation1998), which are widely used in reporting R2, are 0.19 (weak), 0.33 (moderate), and 0.67 (substantiate). Therefore, these values are adopted in the current research. Referring to Table , the values of R2 range are almost in the substantial category; hence, the researchers assume that the model accomplishes the required predictive accuracy power of the model conceptualized.
To complete the analysis, the effect size f2 of each independent construct is to be evaluated. This is to ensure whether the effect of the independent constructs is substantive on the considered dependent construct (Hair et al., Citation2017). The following EquationEquation 1(1)
(1) is used to calculate the f2 effect size (Hair et al., Citation2017):
where, R2included: Refers to R2 value of the dependent construct when the selected independent construct is included in the model estimated.
R2excluded: Refers to R2 value of the specific dependent construct when the independent construct is excluded from the model estimated.
Actually, there are two existing guidelines for evaluating f2 size of R2, one is taken from Hair et al. (Citation2017) in which the values of 0.02, 0.15, and 0.35 represent small, medium, and large. The other guideline of the effect size values is explained as follows: f2 (.02), which is considered small, (.13) is medium, and (.26) is large effect size (Loeser et al., Citation2017; Wetzels et al., Citation2009). Consequently, values less than 0.01 indicate that there is no effect of a specific independent construct on a specific dependent construct. In the current study, the second guidelines are considered. Fortunately, Smart PLS 4 calculates the effect size automatically and the results are shown in Table . To explain, the f2 effect size of CSAT on ACDS (f2CSAT—ACDS) and CUSBI on ACDS (f2CUSBI—ACDS) are medium and almost high effect size (0.13 and 0.23, respectively). Additionally, the effect sizes of PU (f2PU—CUSBI) is weak with 0.03 effect size, while SOC (f2SOC—CUSBI) is approaching the moderate effect size on CUSBI with a value of (0.09). On the other hand, the effect size of PEOU on CUSBI (f2PEOU—CUSBI) has a value (0.13), which is a moderate. Additionally, QSDSC effect on CSAT (f2QSDSC—CSAT) has a pronounced medium effect (0.19). On the other hand, CUSTR is approaching the moderate effect size (0.10) on CSAT (f2CUSTR—CSAT).
4.4. Out of sample predictive power
To proceed with the analysis, this research took into consideration to use PLSpredict with 10 folds with special focus on the key construct ACDS. However, reporting other prediction statistics of the other endogenous’ items is shown for illustrative purposes. In principle, reporting the out-of-sample predictive power has been further enhanced by latest literature (P. N. Sharma et al., Citation2021; Shmueli et al., Citation2019). In former literature (Hair et al., Citation2014) the predictive relevance (Q2) evaluation regarding each of the endogenous constructs represents how well the path model can predict the originally observed values. The recommended value ranges between zero and one (Hair et al., Citation2014). Furthermore, the effect sizes q2 are evaluated to further augment the results of Q2. However, with the new advancement of PLS-SEM tools, PLSpredict is used to calculate Q2predict to predict how PLS model can predict new observations out-of-sample instead of in-sample predication. The use of this method is followed in the recent research, although still not used at high scale. In the first step, the focus is paid on if the indicators of the endogenous constructs outperform those of the naïve benchmark of the indicators’ mean of the training set of the sample. There are certain rules to be followed: 1) values of Q2predict ≤ 0 indicate that the model does not outperform the naïve benchmark of the training model (i.e., linear regression of model or LM). 2) values of Q2predict > 0 are interpreted based on the comparison of PLS root-mean-square error (RMSE) or mean absolute error (MAE) and the naïve benchmark of LM. Actually, there are three conditions which must hold for Q2predict > 0 to consider the predictive power: first, if RMSE or MAE of PLS prediction errors are less than LM for all the indicators, this suggests that the model has high prediction power. Second, if RMSE or MAE of PLS prediction errors are lower than those produced by LM for a majority of endogenous indictors, this suggests a moderate predictive power of PLS model. Third, if PLS predictive errors are less than those produced by the naïve benchmark LM of the training set for the minority of the items, this means a low predictive power. On the other hand, if none of the endogenous’ indicators achieves PLS < LM, this means lack of predictive power (Shmueli et al., Citation2019).
Looking at Table , the comparison of the values obtained from PLS-SEM and LM shows promising results. In general, the indicators demonstrate lower values in PLS-SEM compared to LM, indicating a strong predictive power of the model. However, it should be noted that CAST4 has an equal value, which does not violate the criteria. For instance, when using PLS-SEM for model estimation, the values for ACDS1, ACDS2, ACDS3, ACDS4, and ACDSC5 are 0.69, 0.65, 0.52, 0.52, and 0.56, respectively. On the other hand, the naïve benchmark linear regression model or LM yields values of 0.70, 0.70, 0.56, 0.55, and 0.59 for the same indicators, respectively. Additionally, the visual inspection of the prediction error distribution indicates an almost symmetrical pattern for all indicators, suggesting the use of RMSE as the basis for analysis. Furthermore, when comparing the histograms of items produced by PLS-SEM and LM, a general correspondence can be observed. However, PLS-SEM prediction errors appear to follow a multimodal distribution, likely caused by the mediating constructs of CSAT and CUSBI. In contrast, LM directly connects all constructs to the key construct, ACDS, in the calculation of the linear regression model. In summary, PLS-SEM demonstrates a high predictive power compared to LM.
Table 9. Predictive power
To gain further insights, Figure illustrates the various diagrams generated by SmartPLS software version 4.
Figure 5. Comparison between PLS-SEM and LM histogram of the key construct ACDS indicators.
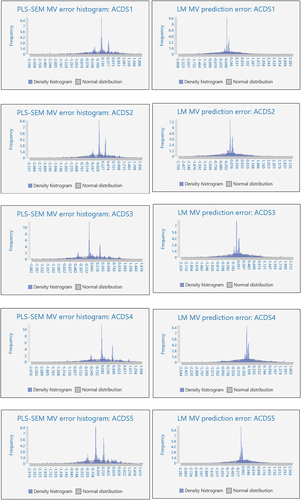
To conclude this section, Table summarizes all hypotheses in the model postulated.
Table 10. Summary of hypotheses testing
4.5. Theoretical contribution
The extended model presented in this research paper makes significant theoretical contributions to academic literature. Firstly, it employs comprehensive analytical techniques, utilizing the most up-to-date version of SmartPLS 4.0.8.2, to thoroughly investigate the research questions. The model demonstrates high predictive performance, accuracy, and successfully fulfills the critical investigative procedures. Consequently, it is validated as a valuable framework for future research in predicting and forecasting the intention of online customers towards the adoption and usage of delivery services. Secondly, the proposed model builds upon the key constructs of TAM and TPB, namely PU, PEOU, and SOC, to examine their relationships with the intention to use delivery services. The model expands these relationships by incorporating SOC towards CUSBI, as well as including CUSTR and CSAT as predictors of CSAT. These additional constructs have exhibited statistical significance and demonstrate a suitable measurement model, meeting the criteria for construct validity, internal consistency and reliability, and discriminant validity. Consequently, they contribute to the advancement of both TAM and TPB in the context of this research. Based on the findings, the research model can be applied in future studies that explore the role of service quality (QSDSC) in customer acceptance, usage, or adoption, as well as the influence of SOC in persuading others to engage with a particular service. Furthermore, the study reveals a significant relationship between CSAT and ACDS, highlighting the importance of customer satisfaction in driving acceptance and usage of delivery services. As a result, future studies investigating the impact of CSAT on the targeted behavior can utilize a validated model such as the proposed and validated research model presented in this study.
4.6. Managerial implications
Given the significant role of social influence (SOC) as a predictor of customer’s intention to use delivery services (CUSBI), it is essential for online retailers and delivery services companies to prioritize advertising the benefits of their services. These benefits may include time savings, convenience, and cost-effectiveness compared to personally retrieving purchased items. By promoting these advantages through various social media platforms, online customers are more likely to be inclined to use and adopt such services for all their purchase activities. The study results have demonstrated that SOC is a significant predictor of CUSBI, indicating that online customers value the opinions of others within their social circle, including friends, colleagues, and relatives. To leverage this influence, online retailers and delivery services companies can encourage regular customers to register their personal information by providing incentives such as points or rewards. This, in turn, can motivate individuals within their social circle to utilize these services, particularly when additional benefits such as vouchers or gifts are offered.
Considering that quality of service of delivery services (QSDSC) has been identified as the strongest predictor of acceptance and adoption of delivery services and related applications (ADSC), it is crucial for online retailers and delivery services companies to place greater emphasis on enhancing service quality. This focus on service quality will contribute to customer satisfaction, which in turn leads to increased acceptance of their services and ultimately promotes revenue growth. Consumers consider service quality as a critical factor in their decision to continue engaging with a delivery service provider or retailer. Therefore, it is advisable for companies to regularly conduct surveys or customer interviews in public places or malls to gather feedback and improve the quality of their services. Additionally, establishing effective communication channels with online customers to solicit their feedback on the provided services is another vital approach. This fosters a mutually beneficial relationship between the customer and the service provider or retailer, creating a win–win situation.
4.7. Methodological contributions
Although the use of PLSpredict, an advanced predictive assessment method, is still limited in current research (Rasoolimanesh & Ali, Citation2018), this study supports its application. By highlighting the methodological contribution of utilizing PLSpredict and addressing the lack of comprehensive utilization of these advanced techniques, this research aims to bridge the gap in the literature and facilitate the effective use of advanced analytical techniques in the field of e-retailer business and management studies as well as paves the way for future research in this area. Specifically, this study makes the following methodological contributions:
It provides a real-world example of how PLSpredict can be used to conduct extensive analysis and prediction in the field of e-business and management studies.
It offers researchers and practitioners the necessary knowledge to effectively assess, report, and interpret PLS-SEM results.
It contributes to upholding the rigor of e-business and management studies utilizing PLS-SEM advance analytical tools.
4.8. Limitations and future directions
This research contributes to the growing body of global research by examining the significant role of Covid-19 in introducing new services and understanding the perceived intention towards these services. As such, this work is considered a pioneering study in the GCC countries within the context of the current research. However, it is important to acknowledge certain limitations of the study. Firstly, the research focuses solely on users of delivery services and overlooks non-users in the context of online purchases. Additionally, the study did not analyze statistical differences between regular users (experienced) and non-regular users. These limitations restrict the generalizability of the findings. Moreover, the use of cross-sectional data is a drawback as it limits the ability to draw causal inferences. To enhance the study’s validity, it is recommended to collect more data over longer periods of time in future research.
Furthermore, this study examines data from both genders collectively without exploring potential gender differences. Future research should consider gender diversity and examine its potential impact on the relationships proposed in the current research. Exploring demographic factors such as age groups and educational achievements as potential moderating or mediating variables is also a significant avenue for future investigation.
To the best of the researchers’ knowledge, there has been limited research conducted on this topic in the GCC countries, particularly within the Omani context, specifically in terms of quantitative research. Therefore, this research is considered one of the pioneering studies in the GCC countries in this field. Further research on the proposed model in other GCC countries or different cultural settings is expected to yield additional insights. Additionally, the authors believe that further exploration of the research topic will contribute to our understanding of the Covid-19 phenomenon, its impacts, and the opportunities it presents. This ongoing research will help in learning valuable lessons and mitigating the consequences of such critical events, while also uncovering new opportunities for individuals and business entities across different scales.
5. Conclusion
The model proposed in the current research has demonstrated high predictive performance power, both in terms of out-of-sample prediction and in-sample prediction. This is evidenced by the coefficient of determination R2, which explains 60% of the ACDS variance, and the predictive relevance of Q2predict, which stands at 67%. Importantly, the cohesive and comprehensive analyses of out-of-sample prediction further enhance the model’s performance. As a result, the model is validated, successfully meeting the first and second objectives. Furthermore, the direct relationship between CUSBI and ACDS supports the hypothesized hypothesis, highlighting the crucial role of CUSBI in influencing the intention to engage in the perceived behavior. This achievement fulfills the third objective.
Regarding the fourth objective, which focuses on investigating the role of CSAT in achieving customer acceptance of delivery services (ACDS), the results confirm its significance. Additionally, the thorough examination of CUSTR and QSDSC in the current research reveals their positive impact on CSAT, thereby influencing the acceptance, adoption, and usage of delivery services. The results strongly support the significant role of CSAT in shaping ACDS, successfully accomplishing the fifth objective. The final objective of the study revolves around studying the vital role of social influence (SOC) on the customer’s intention towards CUSBI. The results confirm a positive and significant effect of SOC on CUSBI, further emphasizing its importance in shaping customer behavior. Despite the exploratory nature of the current study, it successfully achieves its objectives and contributes to the body of knowledge by providing empirical support for the hypothesized relationships in the Omani context. This research is particularly valuable as it sheds light on the impact of the emergent catastrophic event of Covid-19 and the subsequent rise of new delivery services during the lockdown and beyond.
Additional information
Funding
References
- Abu-Taieh, E. M., AlHadid, I., Abu-Tayeh, S., Masa’deh, R., Alkhawaldeh, R. S., Khwaldeh, S., & Alrowwad, A. (2022). continued intention to use of m-banking in Jordan by integrating UTAUT, TPB, TAM and service quality with ML. Journal of Open Innovation: Technology, Market, and Complexity, 8(3), 120. https://doi.org/10.3390/joitmc8030120
- Ajzen, I. (1985). From intentions to actions: A theory of planned behavior. In Action Control J. Kuhl & J. Beckmann. Eds. Springer. 11–39. https://doi.org/10.1007/978-3-642-69746-3_2
- Ajzen, I. (1991). The theory of planned behavior. Organizational Behavior and Human Decision Processes, 50(2), 179–211. https://doi.org/10.1016/0749-5978(91)90020-T
- Ajzen, I., & Fishbein, M. (1977). Attitude-behavior relations: A theoretical analysis and review of empirical research. Psychological Bulletin, 84(5), 888–918. https://doi.org/10.1037/0033-2909.84.5.888
- Ajzen, I., & Fishbein, M. (1980). Understanding attitudes and predicting social behavior. Prentice-Hall.
- Al-Nawafleh, E. A., Alsheikh, G. A. A., Abdulllah, A. A., & Tambi, A. M. (2019). Review of the impact of service quality and subjective norms in TAM among telecommunication customers in Jordan. International Journal of Ethics and Systems, 35(1), 148–158. https://doi.org/10.1108/IJOES-07-2018-0101
- Al-Swidi, A., Mohammed Rafiul Huque, S., Haroon Hafeez, M., & Noor Mohd Shariff, M. (2014). The role of subjective norms in theory of planned behavior in the context of organic food consumption. British Food Journal, 116(10), 1561–1580. https://doi.org/10.1108/BFJ-05-2013-0105
- Alzaidi, M. S., & Agag, G. (2022). The role of trust and privacy concerns in using social media for e-retail services: The moderating role of Covid-19. Journal of Retailing and Consumer Services, 68, 103042. https://doi.org/10.1016/j.jretconser.2022.103042
- Arkorful, V. E., Lugu, B. K., Hammond, A., Basiru, I., Afriyie, F. A., & Mohajan, B. (2021). Examining quality, value, satisfaction and trust dimensions: An empirical lens to understand health insurance systems actual usage. Public Organization Review, 21(3), 471–489. https://doi.org/10.1007/s11115-020-00498-x
- Armstrong, R. W., & Yee, S. M. (2001). Do Chinese trust Chinese? A study of Chinese buyers and sellers in Malaysia. Journal of International Marketing, 9(3), 63–86. https://doi.org/10.1509/jimk.9.3.63.19925
- Bahadur, W., Khan, A. N., Ali, A., & Usman, M. (2020). Investigating the effect of employee empathy on service loyalty: The mediating role of trust in and satisfaction with a service employee. Journal of Relationship Marketing, 19(3), 229–252. https://doi.org/10.1080/15332667.2019.1688598
- Brandon-Jones, A., & Kauppi, K. (2018). Examining the antecedents of the technology acceptance model within e-procurement. International Journal of Operations & Production Management, 38(1), 22–42. https://doi.org/10.1108/IJOPM-06-2015-0346
- Çelik, H. (2008). What determines Turkish customers’ acceptance of internet banking? International Journal of Bank Marketing, 26(5), 353–370. https://doi.org/10.1108/02652320810894406
- Chaouali, W., Ben Yahia, I., & Souiden, N. (2016). The interplay of counter-conformity motivation, social influence, and trust in customers’ intention to adopt internet banking services: The case of an emerging country. Journal of Retailing and Consumer Services, 28, 209–218. https://doi.org/10.1016/j.jretconser.2015.10.007
- Chen, S.-C. (2012). The customer satisfaction–loyalty relation in an interactive e-service setting: The mediators. Journal of Retailing and Consumer Services, 19(2), 202–210. https://doi.org/10.1016/j.jretconser.2012.01.001
- Chen, X., Tao, D., & Zhou, Z. (2019). Factors affecting reposting behaviour using a mobile phone-based user-generated-content online community application among Chinese young adults. Behaviour & Information Technology, 38(2), 120–131. https://doi.org/10.1080/0144929X.2018.1515985
- Chin, W. W. (1998). The partial least squares approach to structural equation modeling. In G. A. Marcoulides (Ed.), Modern methods for business research (pp. 295–336). Erlbaum.
- Chiu, C.-M., Chiu, C.-S., & Chang, H.-C. (2007). Examining the integrated influence of fairness and quality on learners’ satisfaction and Web-based learning continuance intention. Information Systems Journal, 17(3), 271–287. https://doi.org/10.1111/j.1365-2575.2007.00238.x
- Chopdar, P. K., Korfiatis, N., Sivakumar, V. J., & Lytras, M. D. (2018). Mobile shopping apps adoption and perceived risks: A cross-country perspective utilizing the unified theory of acceptance and use of technology. Computers in Human Behavior, 86, 109–128. https://doi.org/10.1016/j.chb.2018.04.017
- Cyr, D., Hassanein, K., Head, M., & Ivanov, A. (2007). The role of social presence in establishing loyalty in e-Service environments. Interacting with Computers, 19(1), 43–56. https://doi.org/10.1016/j.intcom.2006.07.010
- Davis, F. D. (1989). Perceived usefulness, perceived ease of use, and user acceptance of information technology. MIS Quarterly, 13(3), 319. https://doi.org/10.2307/249008
- Davis, F. D., Bagozzi, R. P., & Warshaw, P. R. (1989). User acceptance of computer technology: A comparison of two theoretical models. Management Science, 35(8), 982–1003. https://doi.org/10.1287/mnsc.35.8.982
- Dehghanpouri, H., Soltani, Z., & Rostamzadeh, R. (2020). The impact of trust, privacy and quality of service on the success of E-CRM: The mediating role of customer satisfaction. Journal of Business & Industrial Marketing, 35(11), 1831–1847. https://doi.org/10.1108/JBIM-07-2019-0325
- Deutsch, M., & Gerard, H. B. (1955). A study of normative and informational social influences upon individual judgment. The Journal of Abnormal and Social Psychology, 51(3), 629–636. https://doi.org/10.1037/h0046408
- Dong, X., Chang, Y., Wang, Y., & Yan, J. (2017). Understanding usage of internet of things (IoT) systems in China: Cognitive experience and affect experience as moderator. Information Technology & People, 30(1), 117–138. https://doi.org/10.1108/ITP-11-2015-0272
- Faqih, K. M. S., & Jaradat, M.-I. R. M. (2015). Assessing the moderating effect of gender differences and individualism-collectivism at individual-level on the adoption of mobile commerce technology: TAM3 perspective. Journal of Retailing and Consumer Services, 22, 37–52. https://doi.org/10.1016/j.jretconser.2014.09.006
- Faul, F., Erdfelder, E., Buchner, A., & Lang, A.-G. (2009). Statistical power analyses using G*Power 3.1: Tests for correlation and regression analyses. Behavior Research Methods, 41(4), 1149–1160. https://doi.org/10.3758/BRM.41.4.1149
- Fishbein, M., & Ajzen, I. (1975). Belief, attitude, intention, and behavior: An introduction to theory and research. Addison-Wesley Publishing Company.
- Fornell, C., & Larker, D. F. (1981). Evaluating structural equation models with unobservable variables and measurement error. Journal of Marketing Research, 18(1), 39–50. https://doi.org/10.2307/3151312
- Groß, M. (2018). Heterogeneity in consumers’ mobile shopping acceptance: A finite mixture partial least squares modelling approach for exploring and characterising different shopper segments. Journal of Retailing and Consumer Services, 40, 8–18. https://doi.org/10.1016/j.jretconser.2017.09.002
- Hai, P. T., Duc Toan, L., Viet Tam, V., & Thi Thuong, M. (2017). Factors affecting customer satisfaction with the quality of services: Empirical evidence at Da Nang international airport, Vietnam. Asian Journal of Empirical Research, 7(3), 61–74. https://doi.org/10.18488/journal.1007/2017.7.3/1007.3.61.74
- Hair, J. F., Black, W. C., Babin, B. J., & Anderson, R. E. (Eds.). (2010). Multivariate data analysis: A global perspective (7. ed., global) ed.). Pearson.
- Hair, J. F., Hult, G. T. M., Ringle, C. M., & Sarstedt, M. (2014). A primer on partial least squares structural equation modeling (PLS-SEM). SAGE Publications, Inc.
- Hair, J. F., Hult, G. T. M., Ringle, C. M., & Sarstedt, M. (2016). A primer on partial least squares structural equation modeling (PLS-SEM) (2nd) ed.). SAGE Publications, Inc.
- Hair, J. F., Hult, G. T. M., Ringle, C. M., & Sarstedt, M. (2017). A primer on partial least squares structural equation modeling (PLS-SEM) (2nd) ed.). SAGE Publications, Inc.
- Hair, J. F., Ringle, C. M., & Sarstedt, M. (2011). PLS-SEM: Indeed a silver bullet. The Journal of Marketing Theory and Practice, 19(2), 139–152. https://doi.org/10.2753/MTP1069-6679190202
- Hamid, A. A., Razak, F. Z. A., Bakar, A. A., & Abdullah, W. S. W. (2016). The effects of perceived usefulness and perceived ease of use on continuance intention to use e-government. Procedia Economics and Finance, 35, 644–649. https://doi.org/10.1016/S2212-5671(16)00079-4
- Hassan, S., Rashid, R., & Li, F. (2015). Utilising modified UTAUT to understand students’ online shopping behaviour: A case of e-retail co-operative website in Malaysia. Journal of Electronic Commerce in Organizations, 13(4), 74–90. https://doi.org/10.4018/JECO.2015100104
- Henseler, J., & Chin, W. W. (2010). A comparison of approaches for the analysis of interaction effects between latent variables using partial least squares path modeling. Structural Equation Modeling: A Multidisciplinary Journal, 17(1), 82–109. https://doi.org/10.1080/10705510903439003
- Henseler, J., Ringle, C. M., & Sarstedt, M. (2015). A new criterion for assessing discriminant validity in variance-based structural equation modeling. Journal of the Academy of Marketing Science, 43(1), 115–135. https://doi.org/10.1007/s11747-014-0403-8
- Hew, -J.-J., Lee, V.-H., Ooi, K.-B., & Wei, J. (2015). What catalyses mobile apps usage intention: An empirical analysis. Industrial Management & Data Systems, 115(7), 1269–1291. https://doi.org/10.1108/IMDS-01-2015-0028
- Hofstede, G., Hofstede, G. J., & Minkov, M. (2010). Cultures and organizations: Software of the mind ; intercultural cooperation and its importance for survival (Rev. and expanded 3.) ed.). McGraw-Hill.
- Idemudia, E. C., Raisinghani, M. S., & Samuel-Ojo, O. (2018). The contributing factors of continuance usage of social media: An empirical analysis. Information Systems Frontiers, 20(6), 1267–1280. https://doi.org/10.1007/s10796-016-9721-3
- Julfikar Ali, M., Atikur Rahaman, M., Bin Latif, W., Ahammad, I., & Mobarak Karim, M. (2023). Determinants of consumer motivation to use online food delivery apps: An empirical investigation of Bangladesh. Innovative Marketing, 19(2), 63–72. https://doi.org/10.21511/im.19(2).2023.06
- Kasiri, L. A., Guan Cheng, K. T., Sambasivan, M., & Sidin, S. M. (2017). Integration of standardization and customization: Impact on service quality, customer satisfaction, and loyalty. Journal of Retailing and Consumer Services, 35, 91–97. https://doi.org/10.1016/j.jretconser.2016.11.007
- Kayali, M., & Alaaraj, S. (2020). Adoption of cloud based e-learning in developing countries: A combination of DOI, TAM and UTAUT. International Journal of Contemporary Management and Information Technology, 1(1), 8. https://ijcmit.com/wp-content/uploads/2020/11/Kayali-Alaaraj-2020-1d59ab79.pdf
- Kettinger, W. J., & Lee, C. C. (1994). Perceived service quality and user satisfaction with the information services function. Decision Sciences, 25(5–6), 737–766. https://doi.org/10.1111/j.1540-5915.1994.tb01868.x
- Khan, M. A., Zubair, S. S., & Malik, M. (2019). An assessment of e-service quality, e-satisfaction and e-loyalty: Case of online shopping in Pakistan. South Asian Journal of Business Studies, 8(3), 283–302. https://doi.org/10.1108/SAJBS-01-2019-0016
- Khaskheli, A., Jun, Y., & Ahmed Bhuiyan, M. (2017). M-commerce and mobile apps: Opportunities for SMEs in developing countries. Journal of International Business Research and Marketing, 2(2), 20–23. https://doi.org/10.18775/jibrm.1849-8558.2015.22.3003
- Kim, C., Mirusmonov, M., & Lee, I. (2010). An empirical examination of factors influencing the intention to use mobile payment. Computers in Human Behavior, 26(3), 310–322. https://doi.org/10.1016/j.chb.2009.10.013
- Kock, N., & Lynn, G. (2012). Lateral collinearity and misleading results in variance-based SEM: An illustration and recommendations. Journal of the Association for Information Systems, 13(7), 546–580. https://doi.org/10.17705/1jais.00302
- Kulviwat, S., Bruner, G. C., & Al-Shuridah, O. (2009). The role of social influence on adoption of high tech innovations: The moderating effect of public/private consumption. Journal of Business Research, 62(7), 706–712. https://doi.org/10.1016/j.jbusres.2007.04.014
- Lal, B., & Chavan, C. (2019). A road map: E-commerce to world wide web growth of business world. Global Journal of Management and Business Research: A Administration and Management, 19(11), 32–42. https://globaljournals.org/GJMBR_Volume19/5-A-Road-Map-E-Commerce-to-World.pdf
- Lee, M.-C. (2009). Factors influencing the adoption of internet banking: An integration of TAM and TPB with perceived risk and perceived benefit. Electronic Commerce Research and Applications, 8(3), 130–141. https://doi.org/10.1016/j.elerap.2008.11.006
- Lee, S., & Kim, B. G. (2017). The impact of qualities of social network service on the continuance usage intention. Management Decision, 55(4), 701–729. https://doi.org/10.1108/MD-10-2016-0731
- Liao, Z., & Cheung, M. T. (2001). Internet-based e-shopping and consumer attitudes: An empirical study. Information & Management, 38(5), 299–306. https://doi.org/10.1016/S0378-7206(00)00072-0
- Liébana-Cabanillas, F., Marinkovic, V., Ramos de Luna, I., & Kalinic, Z. (2018). Predicting the determinants of mobile payment acceptance: A hybrid SEM-neural network approach. Technological Forecasting and Social Change, 129, 117–130. https://doi.org/10.1016/j.techfore.2017.12.015
- Lien, C.-H., Cao, Y., & Zhou, X. (2017). Service quality, satisfaction, stickiness, and usage intentions: An exploratory evaluation in the context of WeChat services. Computers in Human Behavior, 68, 403–410. https://doi.org/10.1016/j.chb.2016.11.061
- Liu, A. H., & Leach, M. P. (2001). Developing loyal customers with a value-adding sales force: Examining customer satisfaction and the perceived credibility of consultative salespeople. Journal of Personal Selling & Sales Management, 21(2), 147–156. https://doi.org/10.1080/08853134.2001.10754265
- Loeser, F., Recker, J., Brocke, J. V., Molla, A., & Zarnekow, R. (2017). How IT executives create organizational benefits by translating environmental strategies into green IS initiatives: Organizational benefits of green IS strategies and practices. Information Systems Journal, 27(4), 503–553. https://doi.org/10.1111/isj.12136
- Lorente-Martínez, J., Navío-Marco, J., & Rodrigo-Moya, B. (2020). Analysis of the adoption of customer facing InStore technologies in retail SMEs. Journal of Retailing and Consumer Services, 57, 102225. https://doi.org/10.1016/j.jretconser.2020.102225
- Luarn, P., & Lin, -H.-H. (2003). A customer loyalty model for e-service context. Journal of Electronic Commerce Research, 4(4), 156–167. http://www.jecr.org/node/244
- Mahmoud, M. A., Hinson, R. E., & Adika, M. K. (2018). The effect of trust, commitment, and conflict handling on customer retention: The mediating role of customer satisfaction. Journal of Relationship Marketing, 17(4), 257–276. https://doi.org/10.1080/15332667.2018.1440146
- Meher, B. K., Hawaldar, I. T., Mohapatra, L., & Sarea, A. M. (2020). The impact of COVID-19 on price volatility of crude oil and natural gas listed on multi commodity exchange of India. International Journal of Energy Economics and Policy, 10(5), 422–431. https://doi.org/10.32479/ijeep.10047
- Moorman, C., Deshpandé, R., & Zaltman, G. (1993). Factors affecting trust in market research relationships. Journal of Marketing, 57(1), 81–101. https://doi.org/10.1177/002224299305700106
- Morgan, R. M., & Hunt, S. D. (1994). The commitment-trust theory of relationship marketing. Journal of Marketing, 58(3), 20–38. https://doi.org/10.1177/1356766710391135
- Olasina, G. (2019). Human and social factors affecting the decision of students to accept e-learning. Interactive Learning Environments, 27(3), 363–376. https://doi.org/10.1080/10494820.2018.1474233
- Parasuraman, S., Zeithaml, V. A., & Berry, L. L. (1988). SERVQUAL: A multiple-item scale for measuring consumer perceptions of service quality. Journal of Retailing, 64(1), 12–40. https://www.researchgate.net/publication/225083802_SERVQUAL_A_multiple-_Item_Scale_for_measuring_consumer_perceptions_of_service_quality
- Park, Y., & Chen, J. V. (2007). Acceptance and adoption of the innovative use of smartphone. Industrial Management & Data Systems, 107(9), 1349–1365. https://doi.org/10.1108/02635570710834009
- Pikkarainen, T., Pikkarainen, K., Karjaluoto, H., & Pahnila, S. (2004). Consumer acceptance of online banking: An extension of the technology acceptance model. Internet Research, 14(3), 224–235. https://doi.org/10.1108/10662240410542652
- Purani, K., Kumar, D. S., & Sahadev, S. (2019). e-Loyalty among millennials: Personal characteristics and social influences. Journal of Retailing and Consumer Services, 48, 215–223. https://doi.org/10.1016/j.jretconser.2019.02.006
- Qutaishat, F. T., Khattab, S. A., Abu Zaid, M. K. S., & Al-Manasra, E. A. (2012). The effect of ERP successful implementation on employees’ productivity, service quality and innovation: An empirical study in telecommunication sector in Jordan. International Journal of Business and Management, 7(19), 45. https://doi.org/10.5539/IJBM.V7N19P45
- Ranaweera, C., & Prabhu, J. (2003). The influence of satisfaction, trust and switching barriers on customer retention in a continuous purchasing setting. International Journal of Service Industry Management, 14(4), 374–395. https://doi.org/10.1108/09564230310489231
- Rasoolimanesh, S. M., & Ali, F. (2018). Partial least squares-structural equation modeling in hospitality and tourism. Journal of Hospitality and Tourism Technology, 9(3), 238–248. https://doi.org/10.1108/JHTT-10-2018-142
- Ray, A., Dhir, A., Bala, P. K., & Kaur, P. (2019). Why do people use food delivery apps (FDA)? A uses and gratification theory perspective. Journal of Retailing and Consumer Services, 51, 221–230. https://doi.org/10.1016/j.jretconser.2019.05.025
- Rehman, A. U., Bashir, S., Mahmood, A., Karim, H., Nawaz, Z., & Mahmoud, A. B. (2022). Does e-shopping service quality enhance customers’ e-shopping adoption? An extended perspective of unified theory of acceptance and use of technology. PLOS ONE, 17(2), e0263652. https://doi.org/10.1371/journal.pone.0263652
- Renda Dos Santos, L. M., & Okazaki, S. (2016). Planned e-learning adoption and occupational socialisation in Brazilian higher education. Studies in Higher Education, 41(11), 1974–1994. https://doi.org/10.1080/03075079.2015.1007940
- Rigdon, E. E. (2012). Rethinking partial least squares path modeling: In praise of simple methods. Long Range Plann, 45(5–6), 341–358. https://doi.org/10.1016/j.lrp.2012.09.010
- Ringle, C. M., Wende, S., & Becker, J. M. (2022). Smart PLS (Version 4). SmartPLS GmbH. http://www.smartpls.com
- Rodríguez, P. G., Villarreal, R., Valiño, P. C., & Blozis, S. (2020). A PLS-SEM approach to understanding E-SQ, E-satisfaction and E-loyalty for fashion E-retailers in Spain. Journal of Retailing and Consumer Services, 57, 102201. https://doi.org/10.1016/j.jretconser.2020.102201
- Rogers, E. M. (1983). Diffusion of innovations (3rd) ed.). Free Press A division of Macmillan Publishing Co., Inc.
- Rogers, E. M. (2003). Diffusion of innovations (5th) ed.). Free Press A division of Macmillan Publishing Co., Inc.
- Ryu, K., Lee, H., & Gon Kim, W. (2012). The influence of the quality of the physical environment, food, and service on restaurant image, customer perceived value, customer satisfaction, and behavioral intentions. International Journal of Contemporary Hospitality Management, 24(2), 200–223. https://doi.org/10.1108/09596111211206141
- Saad, A. T. (2020). Factors affecting online food delivery service in Bangladesh: An empirical study. British Food Journal, 123(2), 535–550. https://doi.org/10.1108/BFJ-05-2020-0449
- Sangeeta, & Tandon, U. (2021). Factors influencing adoption of online teaching by school teachers: A study during COVID −19 pandemic. Journal of Public Affairs, 21(4). https://doi.org/10.1002/pa.2503
- Santa, R., MacDonald, J. B., & Ferrer, M. (2019). The role of trust in e-Government effectiveness, operational effectiveness and user satisfaction: Lessons from Saudi Arabia in e-G2B. Government Information Quarterly, 36(1), 39–50. https://doi.org/10.1016/j.giq.2018.10.007
- Sareen, M., & Jain, A. (2014). The role of social influence and consumer’s effort expectancy on online shopping: An empirical study of India. International Journal of Management Research and Business Strategy, 3(2), 138–158. https://citeseerx.ist.psu.edu/document?repid=rep1&type=pdf&doi=5530a4413ca7c1c462150059565b157a3b7768fc
- Sarstedt, M., Ringle, C. M., Smith, D., Reams, R., & Hair, J. F. (2014). Partial least squares structural equation modeling (PLS-SEM): A useful tool for family business researchers. Journal of Family Business Strategy, 5(1), 105–115. https://doi.org/10.1016/j.jfbs.2014.01.002
- Schlosser, A. E., White, T. B., & Lloyd, S. M. (2006). Converting web site visitors into buyers: How web site investment increases consumer trusting beliefs and online purchase intentions. Journal of Marketing, 70(2), 133–148. https://doi.org/10.1509/jmkg.70.2.133
- Sharabati, -A.-A.-A., Al-Haddad, S., Al-Khasawneh, M., Nababteh, N., Mohammad, M., & Abu Ghoush, Q. (2022). The impact of tiktok user satisfaction on continuous intention to use the application. Journal of Open Innovation: Technology, Market, and Complexity, 8(3), 125. https://doi.org/10.3390/joitmc8030125
- Sharma, S. K. (2019). Integrating cognitive antecedents into TAM to explain mobile banking behavioral intention: A SEM-neural network modeling. Information Systems Frontiers, 21(4), 815–827. https://doi.org/10.1007/s10796-017-9775-x
- Sharma, P. N., Shmueli, G., Sarstedt, M., Danks, N., & Ray, S. (2021). Prediction‐oriented model selection in partial least squares path modeling. Decision Sciences, 52(3), 567–607. https://doi.org/10.1111/deci.12329
- Shin, D. H. (2013). User centric cloud service model in public sectors: Policy implications of cloud services. Government Information Quarterly, 30(2), 194–203. https://doi.org/10.1016/j.giq.2012.06.012
- Shmueli, G., Sarstedt, M., Hair, J. F., Cheah, J.-H., Ting, H., Vaithilingam, S., & Ringle, C. M. (2019). Predictive model assessment in PLS-SEM: Guidelines for using PLSpredict. European Journal of Marketing, 53(11), 2322–2347. https://doi.org/10.1108/EJM-02-2019-0189
- Singh, S., Sahni, M. M., & Kovid, R. K. (2020). What drives FinTech adoption? A multi-method evaluation using an adapted technology acceptance model. Management Decision, 58(8), 1675–1697. https://doi.org/10.1108/MD-09-2019-1318
- Sirdeshmukh, D., Singh, J., & Sabol, B. (2002). Consumer trust, value, and loyalty in relational exchanges. Journal of Marketing, 66(1), 15–37. https://doi.org/10.1509/jmkg.66.1.15.18449
- Smith, T. J. (2008). Senior citizens and e-commerce websites: The role of perceived usefulness, perceived ease of use, and web site usability. Informing Science: The International Journal of an Emerging Transdiscipline, 11, 59–83. https://doi.org/10.28945/440
- Svensson, G., Ferro, C., Høgevold, N., Padin, C., Carlos Sosa Varela, J., & Sarstedt, M. (2018). Framing the triple bottom line approach: Direct and mediation effects between economic, social and environmental elements. Journal of Cleaner Production, 197, 972–991. https://doi.org/10.1016/j.jclepro.2018.06.226
- Tahar, A., Riyadh, H. A., Sofyani, H., & Purnomo, W. E. (2020). Perceived ease of use, perceived usefulness, perceived security and intention to use e-filing: The role of technology readiness. The Journal of Asian Finance, Economics and Business, 7(9), 537–547. https://doi.org/10.13106/JAFEB.2020.VOL7.NO9.537
- Taufiq Hail, G. A. (2020). Educational learning and teaching methods’ challenges during covid-19 outbreak and a sudden transformation towards totally digitizing education. International Journal of Education and Science, 3(2). https://doi.org/10.26697/ijes.2020.2.39
- Taufiq-Hail, G. A., & Ibrahim, H. (2018). Environmental & Green IT practices’ awareness role on driving users towards adopting SaaS cloud computing services: A Malaysian university context. Journal of Telecommunication, Electronic and Computer Engineering, 10(1–10), 99–102. https://jtec.utem.edu.my/jtec/article/view/3798/2690
- Taufiq-Hail, G. A., Mohd Yusof, S., Alsaidi, R. A. M., Alanazi, S. R., & Sarea, A. M. (2021). Collaborative and social media SaaS (software as a service) cloud computing services’ adoption and acceptance model on the millennials: Conceptual model. In A. Hamdan, A. E. Hassanien, A. Razzaque, & B. Alareeni (Eds.), The fourth industrial revolution: implementation of artificial intelligence for growing business success (Vol. 935, pp. 111–131). Springer International Publishing. https://doi.org/10.1007/978-3-030-62796-6_6
- Taufiq-Hail, G. A., Rheal, A., Alanzi, A. A., Mohd Yusof, S., & M Alruwaili, M. (2021). Software as a service (SaaS) cloud computing: An empirical investigation on university students’ perception. Interdisciplinary Journal of Information, Knowledge, and Management, 16, 213–253. https://doi.org/10.28945/4740
- Taufiq-Hail, G. A., Sarea, A., & Hawaldar, I. T. (2021). The impact of self-efficacy on feelings and task performance of academic and teaching staff in Bahrain during covid-19: Analysis by SEM and ANN. Journal of Open Innovation: Technology, Market, and Complexity, 7(4), 224. https://doi.org/10.3390/joitmc7040224
- Tran, V.-D., & Vu, Q. H. (2019). Inspecting the relationship among e-service quality, e-trust, e-customer satisfaction and behavioral intentions of online shopping customers. Global Business Finance Review, 24(3), 29–42. https://doi.org/10.17549/gbfr.2019.24.3.29
- Tsai, H.-T., Huang, H.-C., Jaw, Y.-L., & Chen, W.-K. (2006). Why on-line customers remain with a particular e-retailer: An integrative model and empirical evidence. Psychology and Marketing, 23(5), 447–464. https://doi.org/10.1002/mar.20121
- Tsai, M.-T., Tsai, C.-L., & Chang, H.-C. (2010). The effect of customer value, customer satisfaction, and switching costs on customer loyalty: An empirical study of hypermarkets in Taiwan. Social Behavior and Personality: An International Journal, 38(6), 729–740. https://doi.org/10.2224/sbp.2010.38.6.729
- Tseng, T. H., Lin, S., Wang, Y.-S., & Liu, H.-X. (2022). Investigating teachers’ adoption of MOOCs: The perspective of UTAUT2. Interactive Learning Environments, 30(4), 635–650. https://doi.org/10.1080/10494820.2019.1674888
- Vakulenko, Y., Shams, P., Hellström, D., & Hjort, K. (2019). Online retail experience and customer satisfaction: The mediating role of last mile delivery. The International Review of Retail, Distribution and Consumer Research, 29(3), 306–320. https://doi.org/10.1080/09593969.2019.1598466
- Venkatesh, V. (2000). Determinants of perceived ease of use: Integrating control, intrinsic motivation, and emotion into the technology acceptance model. Information Systems Research, 11(4), 342–365. https://doi.org/10.1287/isre.11.4.342.11872
- Venkatesh, V., & Bala, H. (2008). Technology acceptance model 3 and a research agenda on interventions. Decision Sciences, 39(2), 273–315. https://doi.org/10.1111/j.1540-5915.2008.00192.x
- Venkatesh, V., & Davis, F. D. (2000). A theoretical extension of the technology acceptance model: Four longitudinal field studies. Management Science, 46(2), 186–204. https://doi.org/10.1287/mnsc.46.2.186.11926
- Venkatesh, V., Thong, J. Y., & Xu, X. (2012). Consumer acceptance and use of information technology: Extending the unified theory of acceptance and use of technology. MIS Quarterly, 36(1), 157–178. https://doi.org/10.2307/41410412
- Verkijika, S. F. (2018). Factors influencing the adoption of mobile commerce applications in Cameroon. Telematics and Informatics, 35(6), 1665–1674. https://doi.org/10.1016/j.tele.2018.04.012
- Vojvodić, K. (2019). Brick-and-mortar retailers: Becoming smarter with innovative technologies. Strategic Management, 24(2), 3–11. https://doi.org/10.5937/StraMan1902003V
- Wang, Y.-S. (2008). Assessing e-commerce systems success: A respecification and validation of the DeLone and McLean model of IS success. Information Systems Journal, 18(5), 529–557. https://doi.org/10.1111/j.1365-2575.2007.00268.x
- Wang, Y., Wang, S., Wang, J., Wei, J., & Wang, C. (2020). An empirical study of consumers’ intention to use ride-sharing services: Using an extended technology acceptance model. Transportation, 47(1), 397–415. https://doi.org/10.1007/s11116-018-9893-4
- Watson, R. T., Pitt, L. F., & Kavan, C. B. (1998). Measuring information systems service quality: Lessons from two longitudinal case studies. MIS Quarterly, 22(1), 61. https://doi.org/10.2307/249678
- Wetzels, M., Odekerken-Schröder, G., & van Oppen, C. (2009). Using PLS path modeling for assessing hierarchical construct models: Guidelines and empirical illustration. MIS Quarterly, 33(1), 177–195. https://doi.org/10.2307/20650284
- Wibowo, H. A., Wahid, F., & Nafiudin., (2019). The influences of website design on formation of e-trust, e-satisfaction and e-loyalty of bukalapak.com consumers: Relationship marketing revisited. Proceedings of the 2019 International Conference on Organizational Innovation (ICOI 2019). https://doi.org/10.2991/icoi-19.2019.62
- Yousaf, U., Shamim, A., Siddiqui, H., & Raina, M. (2015). Studying the influence of entrepreneurial attributes, subjective norms and perceived desirability on entrepreneurial intentions. Journal of Entrepreneurship in Emerging Economies, 7(1), 23–34. https://doi.org/10.1108/JEEE-03-2014-0005
- Zheng, Y., Zhao, K., & Stylianou, A. (2013). The impacts of information quality and system quality on users’ continuance intention in information-exchange virtual communities: An empirical investigation. Decision Support Systems, 56, 513–524. https://doi.org/10.1016/j.dss.2012.11.008