
 ?Mathematical formulae have been encoded as MathML and are displayed in this HTML version using MathJax in order to improve their display. Uncheck the box to turn MathJax off. This feature requires Javascript. Click on a formula to zoom.
Abstract
The main aim of the study is to improve the quality of bias tyres, reduce manufacturing waste, and increase the yield of the tyre manufacturing process in a leading tyre manufacturing company in South India. This paper aims to show how Lean Six Sigma tools can be used to address and tackle non-valued added activities. It is of concern to the top management that non-value-added activities in the value stream are increasing and affecting the financial performance of the business. One of the authors, who is pursuing research on identifying success factors of implementing lean in process industries in India, as part of his field study had interacted with people of different hierarchical levels of the company to unravel the main causes of the non-value added activities in the production process. Lean Six Sigma methodology (LSS) was applied and the problem was evaluated by the DMAIC method (Define, Measure, Analyze, Improve, and Control). The LSS Methodology was coupled with Analytic Hierarchy Process (AHP) to prioritize the causes of the waste. The actual name of the company is disguised for confidentiality, and the case is devised based on the initial findings of the study in a tyre-manufacturing firm. This paper provides some key insights into the adoption of Lean Six Sigma practices in an Indian tyre-manufacturing environment. Lean Six Sigma practices are still in the developing stages in tyre manufacturing environments, and this study is an attempt to apply these practices successfully in such manufacturing environments.
PUBLIC INTEREST STATEMENT
This paper discusses how Lean Six Sigma tools can be used to improve the quality of bias tyres. Furthermore, this paper examines how a company within a developing economy can reduce manufacturing waste and increase yields in tyre manufacturing. The study focuses on tackling non-value-added activities that increase financial costs and affect company performance. The authors applied the DMAIC method (Define, Measure, Analyze, Improve, and Control) coupled with the Analytic Hierarchy Process (AHP) to identify the main causes of waste and prioritize them. The study provides key insights into the adoption of Lean Six Sigma practices within an Indian tyre-manufacturing environment. Since Lean Six Sigma practices are still developing in tyre manufacturing, this is particularly pertinent to the industry. This study aims to maximize output, reduce waste, and enhance the quality of tyres in an emerging economy.
1. Introduction
The Lean Six Sigma methodology is widely recognized for its ability to improve quality and reduce waste in the value stream. This approach combines the principles of Lean and Six Sigma to achieve continuous improvement within organizations. Lean focuses on eliminating waste through problem-solving tools, visual management, and standardization, while Six Sigma aims to reduce variations in production processes to enhance quality and meet customer expectations (Bass & Lawton, Citation2009).
Lean manufacturing is based on the idea of identifying waste in any system and removing it to create a value stream for customers (Mahadevan, Citation2015). The lean philosophy originated from the Toyota Production System, which emphasizes the use of fewer resources compared to mass production (Womack et al., Citation1990). The lean philosophy is based on a five-phase approach:
Identify value from the customer’s perspective.
Measure the value stream.
Pull based on customer demand.
Create flow.
Achieve perfection.
Six Sigma is a business strategy and science that aims to reduce manufacturing and service costs, leading to significant improvements in customer satisfaction and bottom-line savings. This methodology often uses statistical and business process methodologies for process, product, and service improvement. Customer focus is the top priority for Six Sigma, and any improvements are measured by their impact on customer satisfaction and value (Pande & Holpp, Citation2002). The Six Sigma approach follows a five-phase DMAIC methodology to tackle specific problems and achieve six sigma levels of performance (Breyfogle, Citation2003; Thomas et al., Citation2018).
DMAIC is a problem-solving methodology that is commonly used in Lean Six Sigma projects. It stands for Define, Measure, Analyze, Improve, and Control, and it consists of the following five stages:
Define: In this stage, the problem is defined and the project goals are established. The team creates a problem statement, identifies the stakeholders, and defines the scope of the project.
Measure: In this stage, the current performance of the process is measured using data. The team collects data on the process, creates a process map, and identifies key process metrics.
Analyze: In this stage, the team analyzes the data collected in the previous stage to identify the root cause of the problem. The team uses statistical analysis tools such as Pareto charts, fishbone diagrams, and histograms to identify the underlying causes of the problem.
Improve: In this stage, the team identifies and implements solutions to address the root cause of the problem. The team develops a plan to implement the solutions, tests the solutions, and evaluates the results.
Control: In this stage, the team establishes a control plan to ensure that the improvements made are sustained over time. The team identifies key performance indicators (KPIs) to monitor the process and establishes a plan to monitor and maintain the process improvements.
The DMAIC methodology is a structured approach to problem-solving that helps organizations to identify and address the root causes of problems and to implement solutions that lead to sustained process improvement.
2. Literature review
Lean Six Sigma is a process improvement methodology that combines the principles of Lean Manufacturing and Six Sigma. Lean Manufacturing aims to reduce waste and increase efficiency in manufacturing processes, while Six Sigma aims to reduce defects and variability in products and processes. The application of Lean Six Sigma in manufacturing environments has been widely studied and has been shown to improve quality, reduce costs, and increase customer satisfaction.
In the context of a bias tyre manufacturing environment, the application of Lean Six Sigma can be used to reduce waste in the production process. Bias tyre manufacturing is a complex process that involves several stages, including mixing, extrusion, calendering, and curing. Each stage of the process can generate waste, including scrap material, rejected products, and rework. Waste reduction is a critical aspect of improving efficiency and reducing costs in bias tyre manufacturing.
In summary, the literature shows that the application of Lean Six Sigma in tyre manufacturing can result in significant improvements in quality, efficiency, and waste reduction. While there are some variations in the results of different studies, the overall trend suggests that Lean Six Sigma can be a powerful tool for improving the production process and reducing waste in bias tyre manufacturing environments.
The application of Lean Six Sigma in the manufacturing industry has been widely researched and has been shown to improve process efficiency, reduce costs, and increase customer satisfaction. In the context of bias tyre manufacturing, waste reduction is a critical aspect of improving efficiency and reducing costs.
Recent studies have shown that the application of Lean Six Sigma in bias tyre manufacturing environments can lead to significant waste reduction. For example, a study by Gopalakrishnan and Sundar (Citation2020) applied Lean Six Sigma to a tyre manufacturing plant and found that it resulted in a 37% reduction in waste and a 23% reduction in cycle time. The study also reported a significant improvement in product quality, with a 32% reduction in defects.
Another recent study by Aydin et al. (Citation2021) applied Lean Six Sigma to a tyre manufacturing plant and found that it resulted in a 46% reduction in waste and a 21% reduction in production time. The study also reported improvements in product quality, with a 43% reduction in defects and a 20% increase in customer satisfaction.
In addition to the application of Lean Six Sigma in the manufacturing process, recent studies have also explored the use of Lean Six Sigma in supply chain management in the tyre manufacturing industry. For example, a study by Gomes et al. (Citation2021) applied Lean Six Sigma to the tyre supply chain and found that it resulted in a 20% reduction in lead time and a 15% reduction in inventory.
The literature suggests that the application of Lean Six Sigma in bias tyre manufacturing environments can lead to significant improvements in process efficiency, waste reduction, and product quality. Recent studies have shown that the methodology can also be applied in supply chain management to further improve efficiency and reduce costs. The results of these studies are shown below.
The studies presented in the table demonstrate the effectiveness of Lean Six Sigma in various aspects of manufacturing processes, specifically in the context of bias tire manufacturing. The results show consistent improvements in process efficiency, waste reduction, and product quality across the different studies. They suggest that applying Lean Six Sigma to the bias tire manufacturing process can lead to an average waste reduction of around 38.67% (considering only the studies that provided waste reduction percentages). As for the increase in the yield of the tire manufacturing process, there isn’t a direct percentage provided in the studies. However, the studies do indicate that Lean Six Sigma contributes to significant improvements in productivity and efficiency, which can be associated with higher yields in the tire manufacturing process. For instance, Ogunnaike and Adeleye (Citation2014) reported a 30% increase in productivity, and Aydin et al. (Citation2021) found a 20% increase in customer satisfaction. To conclude, the relation between the study results and previous studies presented in the literature review table is that they consistently demonstrate the positive impact of Lean Six Sigma in bias tire manufacturing environments, leading to improvements in efficiency, waste reduction, and product quality. The methodology can also be applied in supply chain management to further improve efficiency and reduce costs.
There are still some research gaps to be addressed, such as limited studies on the application of Lean Six Sigma in specific stages of the tyre manufacturing process, lack of studies on the impact of Lean Six Sigma on environmental sustainability, limited studies on the application of Lean Six Sigma in emerging tyre manufacturing technologies, and lack of studies on the impact of cultural differences on the application of Lean Six Sigma. These gaps present opportunities for further research in this field.
3. Research objective and novelty
The study aims to address non-value-added activities in the production process of a leading tyre manufacturing company in South India, which is affecting the financial performance of the business. According to Shah et al. (Citation2013), reducing manufacturing waste and increasing yield is a key challenge faced by many companies in the manufacturing sector, and Lean Six Sigma practices can be applied to address this issue.
Mishra and Shah (Citation2016) state that Lean Six Sigma practices are still in the developing stages in the Indian manufacturing industry, and there is a need to demonstrate their successful application in different contexts. Similarly, S. Singh et al. (Citation2018) state that there is a lack of literature on the application of Lean Six Sigma practices in the Indian context, and there is a need to explore its effectiveness in
Yadav et al., (Citation2018) state that prioritizing the causes of waste is an essential step in implementing Lean Six Sigma practices, and a structured approach is required to achieve this. The study couples the LSS methodology with Analytic Hierarchy Process (AHP) to prioritize the causes of waste. This implies that there is a need for a structured approach to prioritize the causes of waste, and the study aims to fill this gap by combining the LSS methodology with AHP.
The research gap and novelty of the work lie in the application of Lean Six Sigma practices in a tyre-manufacturing environment in India, and the use of a structured approach to prioritize the causes of waste in the production process. The study aims to fill these gaps by demonstrating the successful application of these practices in such an environment.
Firstly, the study focuses on the adoption of Lean Six Sigma practices in a tyre-manufacturing environment in India. While Lean Six Sigma has been widely applied in various industries worldwide, its application in the Indian context, particularly in the tyre manufacturing industry, is relatively new and not well documented. Therefore, this study adds to the literature by providing insights into the adoption of Lean Six Sigma practices in this particular context.
Secondly, the study uses the DMAIC (Define, Measure, Analyze, Improve, Control) methodology, which is a structured problem-solving approach commonly used in Six Sigma projects. The application of DMAIC in the context of tyre manufacturing in India is another novelty of this work.
Thirdly, the study combines the LSS methodology with Analytic Hierarchy Process (AHP) to prioritize the causes of waste. This combination of methods is a unique approach to identifying the main causes of non-value-added activities in the production process.
Fourthly, the study addresses the need to reduce manufacturing waste and increase the yield of the tyre manufacturing process. This is a significant issue faced by many companies in the manufacturing sector, and the study provides valuable insights into how Lean Six Sigma practices can be applied to address this issue.
While there is a growing body of literature on the application of Lean Six Sigma for waste reduction in bias tyre manufacturing environments, there are still several research gaps that could be addressed in future studies. Some of these gaps include:
Limited studies on the application of Lean Six Sigma in specific stages of the tyre manufacturing process: While many studies have focused on the overall application of Lean Six Sigma in tyre manufacturing, there are limited studies that have examined the application of Lean Six Sigma in specific stages of the manufacturing process, such as mixing or curing. Future studies could focus on applying Lean Six Sigma to specific stages of the tyre manufacturing process to identify opportunities for waste reduction and process improvement. Müller and Kettunen (Citation2015)
Kannan and Khodaverdi (Citation2013) highlight that while many studies have focused on the economic benefits of applying Lean Six Sigma in tyre manufacturing, there is a lack of studies that have examined the impact of Lean Six Sigma on environmental sustainability. Future studies could focus on the environmental impact of waste reduction through the application of Lean Six Sigma in tyre manufacturing.
According to Gupta et al. (Citation2018) with the emergence of new tyre manufacturing technologies, such as 3D printing and additive manufacturing, there is a need for studies that explore the application of Lean Six Sigma in these emerging technologies.
Shaw et al. (Citation2016) note that many studies have examined the application of Lean Six Sigma in different manufacturing environments, however there is a lack of studies that examine the impact of cultural differences on the application of Lean Six Sigma in tyre manufacturing.
The novelty of the work lies in the combination of the application of Lean Six Sigma practices in the Indian context, the use of a structured problem-solving approach, the combination of LSS methodology with AHP, and the focus on reducing manufacturing waste and increasing yield.
4. Company background
Compaq Tyres was established in the early 1970s. Their 1st plant was established in 1972 at Thrissur, Kerala, in the southern region of India. This was followed by the 2nd plant in Gujarat, India, in 1991. The company acquired Primax tyres in 1995, which was its third plant based in Kerala. Subsequently, they started a new plant in Chennai, Tamil Nadu. Initially, the company was selling two-wheelers to the Indian market, however by 1995 it had expanded its operations to Africa, Germany, and the Netherlands. Compaq Tyres is ranked 17th among the top tyre manufacturers across the globe *with annual consolidated revenues of Rs 140.53 billion (US$2.18 billion). It gets 69% of its revenues from India, 26% from Europe, and 5% from other geographies. Despite the company’s promising presence in the market, several unending issues are lying unsolved. The company was facing complaints from their OEM customers regularly regarding the failure of tyres in use. This was one of the main reasons for customer dissatisfaction among customers and resulted in affecting customer goodwill to a great extent. The top management realized the importance of eliminating process inefficiencies and wastes from the manufacturing process, thereby retaining its OEM customers. The goal of the firm was to lower non-value-added activities in the value stream and thus find means to improve the efficiency of the process. Due to these issues, the top management requested the support of the external team led by the authors of the paper to discover opportunities for improvement.
5. Research methodology
The research methodology involves an analysis of a tyre manufacturing company located in South India, with a focus on understanding the production process. The approach used is a DMAIC approach, which is a data-driven improvement framework that aims to address the main problems faced by the company and achieve the information required for improvement in bias tyre manufacturing companies. The approach is based on Statistics, Lean, Six Sigma-related concepts, and the methods proposed by Furterer and Elshennawy (Citation2005), Kumar et al. (Citation2006), Thomas et al. (Citation2008), Vinod et al. (Citation2011) and Guerrero et al. (Citation2017). The study was conducted to improve the quality of the company’s products and strengthen its competitive position in the market. The different stages of the proposed approach are explained in the following sections.
The first phase of the methodology involves an analysis of the tyre manufacturing company located in South India by understanding the production process. A DMAIC approach is proposed, which is a data driven improvement framework. This framework addresses the main problems faced by the company and achieves the information required for improvement in bias tyre manufacturing companies. A Lean Six Sigma approach was developed based on Statistics, Lean, Six Sigma related concepts, and the methods proposed by Furterer and Elshennawy (Citation2005), Kumar et al. (Citation2006), Thomas et al. (Citation2008), Vinod et al. (Citation2011) and Guerrero et al. (Citation2017) (Figure ). The study was conducted in the company due to the need for quality improvement as reported by the management and to strengthen the company’s competitive position in the market. The stages of the proposed approach are explained in the following sections.
Figure 1. Proposed framework for Lean Six Sigma implementation in the Tyre manufacturing company.
5.1. Define stage
The main goal of this stage is to understand the critical problems in the manufacturing process and the scope for improvement in the process. The team involved in the project exercise those tools essential to gauge the degree of improvement opportunity in the particular tyre manufacturing process, the resources necessary and a detailed plan for solving the crucial existing problem. In this stage, the tasks involved were to identify the customers, selecting the project area, defining the goal, scope, and resources required for the project. A project team was formed which included the external consulting team, in-house quality control team and the authors of the paper. During this stage, the problems were expressed in terms of quantifiable metrics and the aspects which were crucial for ensuring quality were identified.
5.1.1. Management Initiatives
A meeting was organized by the top management which included senior managers, engineers from various departments of the case organization and operators from the shop floor. The main agenda of the meeting was to evoke about the current practices for lowering the wastes and to improve customer goodwill. The participants were communicated with successes and the challenges faced while implementing the Lean Six Sigma framework. This gave them a sense of confidence to initiate Lean Six Sigma project in the company. A cross-functional team was created comprising operators, engineers from, production, production planning, industrial engineering and quality assurance department, senior managers, and the authors. The team spent many hours on the shop floor, in order to collect data and understand the different processes associated with the tyre manufacturing process.
5.1.2. Problem definition
A series of brainstorming sessions of team members were carried out to identify the type of wastes which were prevalent in the tyre manufacturing process based on their experience and the feedback from the customers. During the meeting the severity of the wastes and their impact on the final performance of tyre was discussed among the team members. The goal of the team members was to identify the root cause of these wastes and to lower these wastes.
5.1.3. Process mapping
The consulting team along with the authors visited the manufacturing plant and the various activities involved in tyre production were studied. This helped in comprehending the process of bias tyre manufacturing in detail. The repeated interaction with the workers assisted in collecting actual information about different wastes present in the system. Frequent plant visits also exposed some key issues that were neglected and not documented.
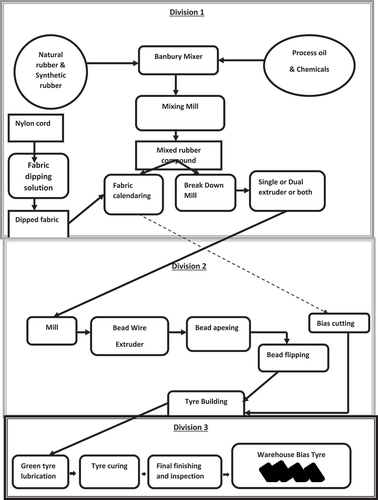
The team started with process mapping the entire tyre manufacturing process (Figure ). There are six processes involved in the manufacture of bias tyres:
Compounding and Mixing: This is the process of bring all the raw materials natural rubber, carbon black, process oil, and other chemicals under specified temperature and time. The mixing is done in a Banbury mixer. The mixing is done to ensure that the compounds are mixed with chemicals in equal proportions.
Component preparation: This process involves three stages: Calendaring, extrusion, and bead building. After mixing the rubber it is passed through the Extruder, calendaring, and bead building machines. The extruder material forms the treads, side walls, and the ply, which are important components of the tyre. Calendaring or fabric calendaring is the process of coating both sides of the dipped fabric using rubber compound. This is accomplished by a four roll calendar. After calendaring, coated cooled fabrics are wound in cotton liners in order to prevent sticking. In the bead building process, several wires (cotton coated steel wires) are passed through the head of the bead extruder and are coated with rubber compound.
Tyre Building: This is the process of assembling all the components onto a tyre building drum. It includes a two-stage operation, where the inner liners, body plies, and side walls are wrapped around the drug as part of the first stage. The second stage involves fixing the tread and results in green tyres.
Curing: Curing is the process of applying pressure to the green tyre in a mould in order to give a final shape and applying heat to stimulate a chemical reaction between rubber and other chemicals. The rubber compound gets vulcanized during curing and becomes tough and elastic and provides all the desired properties in the tyre.
Post cure inflation: The tyre placed is positioned in the post cure inflator (PCI) and will hold the tyre fully inflated till it cools.
Final finishing and Inspection: The tyres are then inspected for visual defects. The tyres are also statistically sampled, tested for conformance to specification and then warehoused.
Figure 2. Process mapping-bias tyre manufacturing.
5.2. Measure Stage
The aim of this stage is to understand the non-valued added activities in the bias tyre manufacturing process. A series of in-depth discussions were conducted with experts from various departments of firm.
5.2.1. Data collection
The relevant data related to bias tyre manufacturing was collected for the period of April 2016 to October 2017. This stage mainly focused on data collected during repeated interactions with the senior/middle level managers and workers at the shop floor level of Compaq tyres. The date pertaining to key performance indicators of the firm namely overall equipment effectiveness, inventory levels, defects and scrap level, manpower availability were collected and are summarized in the following section.
5.2.2. Overall equipment effectiveness
As mentioned in the earlier section of the paper, Bias tyre manufacturing process involves mainly six processes namely a) Mixing b) Extrusion c) Calendaring d) Bead e) Tyre Building and f) Curing. The machine availability for each process is shown in Figure .
Figure 3. Machine availability.
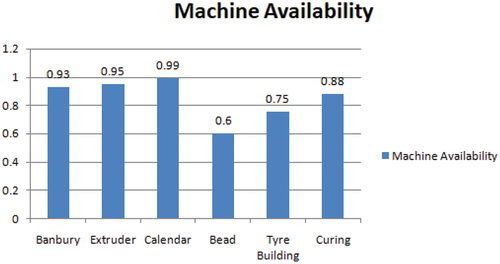
It can be seen the machine availability of Bead building machine, Tyre building machine, and curing press are 0.60 and 0.75 and 0.88, which is very low. A lean firm always targets at a machine availability of 90% or more.
Overall Equipment Effectiveness (OEE) is one of the most widespread measures to gauge effectiveness of equipment performance. OEE is the product of three factors namely Availability, Performance efficiency, and rate of quality (King, Citation2009; Gopalakrishnan, Citation2010; Devadasan et al., Citation2012). OEE is computed by the following equations:
OEE = Machine_Availability × Performance_Efficiency × Quality_Rate
Availability takes into account breakdown losses and setup and adjustment losses. Availability is calculated by the following formula.
Machine Availability = Machine Availability (Banbury) × Machine Availability (Bead) Machine Availability (Calendar) × Machine Availability (Curing) × Machine Availability (Tyre Building) × Machine Availability (Extrusion)
Machine Availability = 0.93 × 0.6 × 0.99 × 0.88 × 0.75 × 0.95 = 0.34
Performance efficiency: It refers to the efficiency way a machine runs to produce the components and products. The formula for performance efficiency is presented below.
Performance efficiency = Average cycle time × No of good units made/Loading time.
The average cycle time is calculated by the following equation (King, Citation2009; Devadasan et al., Citation2012)
Average Cycle time = Available time/Demand rate
Available time = Loading time – setup time – downtime
Loading time = No of days scheduled × Time available = 28 × 24 = 672 hrs
Setup time = 11.25 hrs
Downtime = Preventive maintenance+ Breakdown maintenance
= 8 + 32 = 40 hrs
Available time = 672 – 11.25 – 8 – 32 = 620.5 hrs = 621 hrs (approx)
Therefore Average Cycle time = 621/2114 = 0.29 hrs/MT.
No of good units made = 2276 MT
Performance efficiency = (0.29 × 2276)/672 = 0.98
Quality rate: Quality rate indicates the fraction of the acceptable components and products produced with reference to the total number of components and products produced. The formula for computing quality rate is given below.
Quality rate = (Total units produced during the specific period-Number of units rejected during the specific period) × 100/Total units produced during the specific period
Total units produced during the specific period = 2403 MT
Number of units rejected during the specific period = 124.3 MT
Quality rate = (2403–124.3)/2403 = 0.948
OEE = 0.34 × 0.98 × 0.948 = 0.322
It can be seen the machine availability of Bead building machine, Tyre building machine, and curing press are 0.60 and 0.75 and 0.88, which is very low. A lean firm always targets at a machine availability of 90% or more. This is one of primary reasons which accounts for the firm’s lower Overall Equipment Effectiveness (OEE).
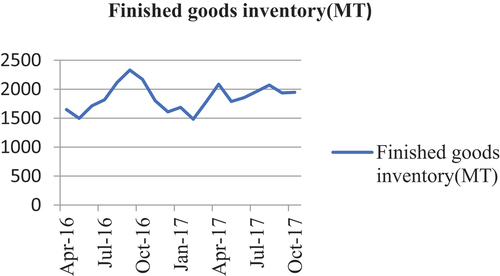
5.2.2.1. Inventory
Any retention of product/service/information in excess of customer/process requirements is a waste. The inventory includes raw materials, in-process inventory, and finished goods. Figure indicates the amount of finished goods inventory in metric tons (MT) maintained by the organization. Usually, firm wants to maintain a finished goods stock of 25–30 days. According to lean manufacturing philosophy, it is advisable to keep minimum inventory across all stages of the production process. However, the more the inventory, more will be the inventory carrying costs and blockage of capital.
Figure 4. Monthly stock of finished goods inventory (MT) (2016–2017).
5.2.2.1.1. Defects and scraps
Due to the complexity of process design of bias tyre manufacturing process, controlling the level of defects and scraps is one of the challenges faced by tyre manufacturing companies. Drastic measures are taken by tyre companies to maintain quality and to reduce the level of defects and scraps. Since the bias tyre manufacturing process is highly labour intensive, most of defects are due to the mistakes committed by the operators or workers. Operator control error, insufficient training, inadequate tools, and equipment used, and high in-process inventory levels have been cited as the main causes. Trimming and inspection of tyres follow tyre curing. During the inspection phase, the inspectors classify the tyres into two categories: “scraps” and “defects”. Scraps are those which cannot be repaired or reworked. They are sent to a scrap yard. Defective tyres are repaired at the tyre repair stage. The monthly defective tyres in metric tons for the period 2016 to 2017 are shown in Figure . This provides an insight into the level of defect in the organization under study.
Figure 5. Monthly defective tyres (in metric tons ((MT) (2016–2017).
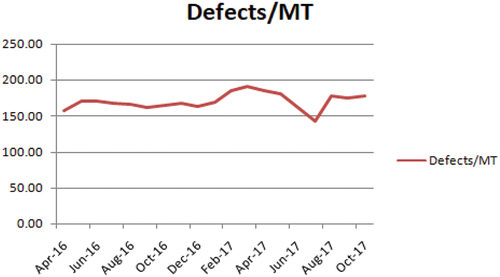
The defects coming out after curing stage are about 150 MT and account for 5–6% of the total cured tyres. This figure is not an alarming one, but a company which aims to be a lean firm should always try to bring defect % close to 0%.
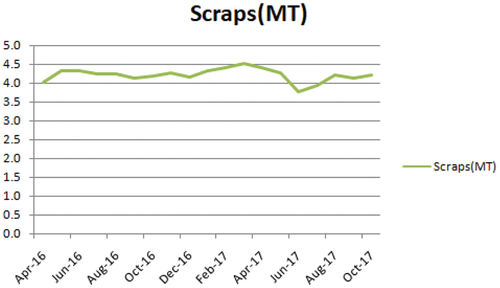
Figure points out the level of scraps that exists in the case firm and these levels of wastes cannot be repaired. This results in loss to the company. Figure shows the average monthly scraps for bias tyre are about 4.5 MT, which is around 0.2% of the total production. This indicates that necessary steps have been taken by the company to keep the scraps under control.
Figure 6. Monthly scrap (in metric tons (M/T)) (2016–2017).
The wastes in bias tyre manufacturing was identified and mapped with standard wastes defined in lean manufacturing philosophy. This was done with the help of repeated interactions with experts from the various departments of bias tyre manufacturing division of the company.
5.2.2.1.2. Manpower availability
One of the critical issues which affect the firm’s performance with respect to production is the high level of absenteeism which is prevalent in the shop floor. The firm works on three shifts in a day and there is a great fluctuation of attendance of employees at the operator level. The average manpower availability for each process across three shifts is presented in Figure .
Figure 7. Manpower availability.
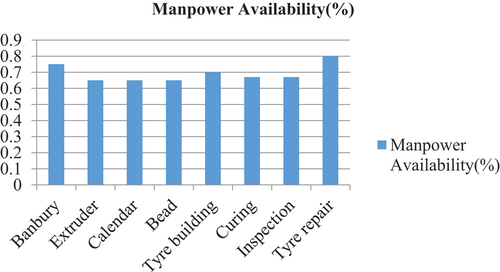
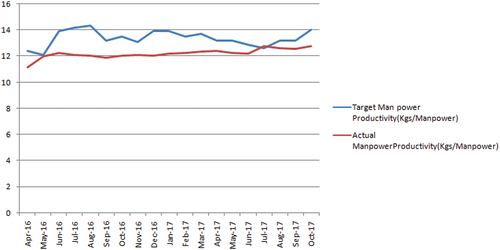
It can be seen that there is high rate of absenteeism in every process. A lean firm should always target a man power availability close to 100%. This is not the case in the current firm. The bias tyre manufacturing process requires lot of labour and hence labour involvement in improving the process is highly essential. Due to high rate of absenteeism among semi-skilled contract workers, often skilled labour do jobs such as handling or moving in process components which warrant only the services of semi-skilled workers. This results in poor morale among skilled workers. Figure shows the gap between the target manpower productivity (kg/hr) and actual manpower productivity (kg/hr) during the period 2016 to 2017. It has been seen that gap between the target and actual manpower productivity is quite high. Hence, it is a serious concern for the company.
Figure 8. Monthly manpower productivity (in kg/hr).
5.2.3. Six Sigma level calculations
The capability of the process is judged by the process to produce defect-free products. One such metric which is used to measure process capability is the First Time Yield (FTY). The probability that a product will go through a process defect-free is called FTY (Gupta, Citation2007; Arthur, Citation2007; Bass & Lawton, Citation2009). FTY is obtained using the following formula in the SD model.
FTY = EXP (− DPU)
DPU is defects per unit and is ratio of the number of defects found to the total number of units of products produced (Bass & Lawton, Citation2009). Defects per unit (DPU) is the defects per unit which is obtained by the following equation.
DPU = Defects/Inspected Tyres
The defects per unit are on an average is 6%, which means the
FTY = EXP (− 0.06) = 0.94176 = 94.176 %
The current status of the production process indicates a sigma level of 3.
5.3. Analyze stage
The wastes in bias tyre manufacturing was identified and was a result of repeated interactions and brain storming sessions with experts from the various departments of bias tyre manufacturing division of the firm namely mechanical engineering, production, production planning and control, quality assurance, and industrial engineering. The experience of the experts ranged from 14 years to 22 years. The main causes of the wastes were depicted with help of a fishbone diagram. The Analytic network process which belongs to the class of multi criteria decision making (MCDM) techniques is used for prioritizing the criticality of the different types of wastes Fishbone diagram: The fishbone diagram is a widely used tool in quality control and problem-solving in various industries, including tyre manufacturing. According to Bhat and Shetty (Citation2021), the fishbone diagram helps in identifying the root causes of defects or issues and provides a visual representation of the possible causes and their interrelationships. It is an effective tool for understanding the cause-and-effect relationship and prioritizing corrective actions.
5.3.1. Fishbone diagram
A cause and effect diagram or the fishbone diagram was constructed to analyze the root causes of non-value added activities in the manufacturing process (Figure ). This would give a better picture to identify the areas for improvement in the manufacturing process.
Figure 9. Fishbone diagram of factors leading to non-value added activities.
5.3.2. AHP model
The Analytic Hierarchy Process (AHP) is a theory of measurement through pairwise comparisons and relies on the judgements of experts to derive priority scales (Saaty, Citation2008). Analytic Hierarchy process is used to prioritize the main wastes in bias tyre manufacturing process. Based on the main factors considered in the fishbone diagram namely Men, Machine, Environment, Method, and Material form the basis for AHP model. A total of six stakeholders from major departments of the case firm namely Raw materials stores, Human resource department, Production department, Production planning, Industrial engineering, and Quality assurance participated in the study. The questionnaire was devised based on the Saaty’s Rating Scale. The questionnaire considers a rating scale from 1 to 9, for 1 being the equal importance or influence and 9 being extreme importance or influence. The AHP technique makes use of pairwise comparison results of causes with respect to the goal (in this case, the waste prevalent in the bias tyre manufacturing process) is presented in Figure . The pairwise comparison matrix of causes with respect to the goal is presented in Table .
Figure 10. Pareto chart.
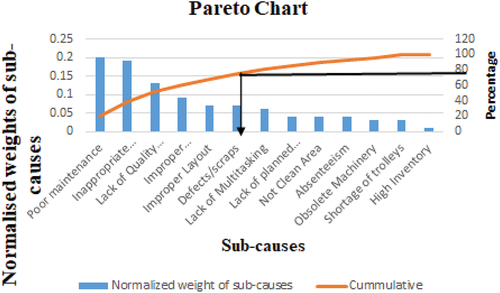
Table 1. Pairwise comparison matrix of causes with respect to the goal
The respective normalised weights and priority vectors are presented in Tables .
Table 2. Normalised matrix of the factors with respect to the goal
Table 3. Priority vectors/weights of factors with respect to the goal
In order to find out the consistencies of the expert’s judgements, the consistency ratios (CR) of the comparison matrices are calculated using the following formula
CI = (λmax – n)/(n-1)
where CI = consistency index
λmax is the principal eigen value
n = the order of the matrix or the number of criteria considered
If CI = 0, means expert’s judgement satisfy consistency
If CI > 0, means the experts have conflicting judgements
If CI ≤ 0.1, means there is reasonable level of consistency (Boateng, Citation2014)
CR = CI/RI
where RI is the random consistency index which is obtained from the following table
When CR ≤ 0.1 (10 %), it indicates the expert’s judgment satisfy consistency.
First, we find the consistency ratio for pairwise comparison Matrix
The principal eigen value λmax for the criteria is obtained by using the formula:
where n = Number of criteria (n = 5) (Table )
Tj = Total of the relative importance values in the column corresponding to the jth criterion
PVj = Priority index of the jth criterion in the priority vector of the criteria.
Therefore, the principal eigen value λmax for the criteria is computed as follows.
λmax = 3.17 × 0.32 + 5.5×.23 + 9.0 × 0.11 + 4.83 × 0.23 + 9 × 0.1 = 5.28
The formula for consistency index is given as
Consistency index (CI) = (λmax – n)/(n-1) = (5.28–5)/4 = 0.07
Random consistency index (R) when n = 5 is 1.12
Consistency ratio (CR) =CI/RI = 0.07/1.12 = 0.0625 = 6.25 %
Since the consistency ratio is less than 10%, the values in the eigen vector are acceptable
Similarly the Priority vectors and weights of sub factors have been calculated and presented in Table .
Table 4: calculated Weights of the Main cause and Sub-causes
5.3.3. Pareto chart
The Pareto chart is commonly used in the Analyze phase of quality control in the tyre manufacturing industry to prioritize improvement efforts. According to Patil et al. (Citation2022), the Pareto chart helps in identifying the most significant causes of defects or issues and enables the team to focus on the critical few issues that have the most significant impact on the overall quality of the product. It is an essential tool for improving the efficiency and effectiveness of the manufacturing process.
The normalized weights of the sub-cause served as input for the construction of Pareto chart (Figure ). The chart depicts the descending order of sub-causes based on the normalized weights of each sub-cause. The sub-causes considered are as follows:
Poor Maintenance(0.20)
Inappropriate labelling of parts(0.19)
Lack of Quality Culture(0.13)
Improper delegation of work(0.09)
Improper Layout(0.07)
Defects/Scraps(0.07)
Lack of Multitasking(0.06)
Lack of planned maintenance schedules(0.04)
Not Clean Area(0.04)
Absenteeism(0.04)
Obsolete Machinery(0.03)
Shortage of trolleys (0.03)
High Inventory(0.01)
Pareto chart uses the 80–20 rule to identify the sub-causes which are the main reasons for generating wastes in the manufacturing process. It can be inferred from Figure that 80% of the waste in bias tyre manufacturing process is due to the following sub-causes
Poor Maintenance
Inappropriate labelling of parts
Lack of quality culture
Improper delegation of work
Improper layout
Defects/Scraps
The dominant sub-causes contributing to waste, which were identified by the Pareto chart were considered in the improve phase to initiate improvement actions.
5.4. Improve stage
5.4.1. Optimizing the process and suggesting improvement techniques
The improvement actions that were proposed by the team were as follows:
It is advised to initiate Total productive maintenance activities every week, so the uptimes of the machine can be improved, thereby improving the overall equipment effectiveness of the plant.
Employees at the operator level are encouraged to engage in autonomous maintenance daily, and it is suggested that the maintenance personnel can have an autonomous maintenance checklist for all the inspections, lubrication, and other operator—controlled maintenance tasks.
The Inspection team should judicially monitor the defects across the manufacturing, specifically in the case of the curing process, where a maximum number of defects occurs. A waste monitoring and reporting plan should be implemented every month. The target of the company is to reduce defects below 3% and thereby improve the firm’s Sigma level close to 4.
5S System is already implemented in the case organization. It was noticed that the employees were not advocating the practice of 5S. It was suggested to top management to motivate employees to practice 5S on the shop floor in a judicious manner and plan 5S audits every month.
In the case of the case firm under consideration, most skilled workers are highly or better qualified, they feel that they are not given enough opportunity to take part in the decision-making process. Lack of team activities is another reason for the waste of human potential. The team suggested the top management continuous improvement programs and quality circles weekly thereby instigating the importance of quality among the employees.
5.5. Control stage
5.5.1. Sustainability plan
In order to sustain the continuous improvement program and implement the improvements identified during the improvement stage, a control plan which can serve as a road map was designed and communicated to the top management of the firm. The excerpt of the control plan is presented in Table .
Table 5. Control plan
6. Limitations
Some possible limitations of this study are as follows:
Limited scope: The research methodology focuses only on a single tyre manufacturing company located in South India. The findings of the study may not be generalizable to other tyre manufacturing companies or industries.
Lack of external validity: As the research methodology is based on data-driven analysis, it may not account for external factors that could impact the production process, such as market trends, competition, or economic conditions.
Resource-intensive: The DMAIC approach proposed in the research methodology can be time-consuming and requires significant resources, including data collection and analysis, staff training, and implementation of improvement strategies.
Incomplete data: The effectiveness of the DMAIC approach may be limited by incomplete or inaccurate data on the production process. If the data is not comprehensive or reliable, it could lead to incorrect conclusions and ineffective improvement strategies.
Resistance to change: The implementation of improvement strategies may face resistance from employees, management, or other stakeholders who are not open to change or unfamiliar with the DMAIC approach. This could limit the effectiveness of the approach and its ability to achieve the desired improvements in the production process.
7. Conclusion
Based on the findings of this study, several recommendations can be made for further research in the area of applying Lean Six Sigma for waste reduction in bias tyre manufacturing company. First, future studies can explore the effectiveness of integrating Lean Six Sigma with other quality management tools such as Total Quality Management (TQM) or ISO standards to achieve greater efficiency and effectiveness. Second, additional research can be conducted to investigate the potential impact of employee involvement and participation in implementing Lean Six Sigma on waste reduction in the manufacturing process. Finally, further research can be conducted to determine the extent to which the proposed framework can be applied to other manufacturing sectors beyond bias tyre production.
The proposed suggestions by the team to the top management of the case firm were to initiate better total productive maintenance practices, adopt 5S judiciously, and target the defects to less than 3%. These recommendations are in line with the principles of LSS and are aimed at reducing waste and improving quality in the manufacturing process (Hassan, Citation2013) . Total productive maintenance practices can help to ensure that machinery and equipment are operating at peak efficiency, which can reduce downtime and improve overall productivity (Adesta et al., Citation2018). 5S is a workplace organization method that focuses on maintaining a clean and organized workspace, which can improve efficiency, reduce waste, and enhance safety (Randhawa & Ahuja, Citation2017). Targeting defects to less than 3% is a key aspect of quality improvement, as it can help to reduce the amount of waste generated by the manufacturing process and improve overall customer satisfaction (Snee & Hoerl, Citation2013).
In conclusion, the implementation of LSS in the Bias tyre manufacturing process can lead to significant improvements in quality and waste reduction. The DMAIC methodology provides a structured approach for identifying and addressing the causes of waste in the manufacturing process, while the AHP tool can be used to prioritize the most important causes of waste. The proposed recommendations above can help achieve these goals. However, further research is needed to evaluate the effectiveness of these recommendations and to develop more comprehensive strategies for implementing LSS in the Bias tyre manufacturing process.
Disclosure statement
No potential conflict of interest was reported by the author(s).
Additional information
Notes on contributors
Malini Nair
Researchers in this group are interested in quality processes, continuous improvement, innovation, and management. Among our research activities are examining the latest developments and trends in these fields, as well as improving existing practices and procedures. We seek solutions to real-world problems as organizations strive for excellence. Our research aims to contribute to the body of knowledge in these areas and to improve the performance and competitiveness of organizations. In this paper, we describe an example of our efforts to help organizations develop growth and development strategies and identify areas for improvement. To support business and organizational growth and success, our group provides cutting-edge research and insights into best practices in quality processes, continuous improvement, innovation, and management.
References
- Adesta, E. Y., Prabowo, H. A., & Agusman, D. (2018). Evaluating 8 pillars of Total Productive Maintenance (TPM) implementation and their contribution to manufacturing performance. In IOP conference series: materials science and engineering (Vol. 290, No. (1), p. 012024). IOP Publishing.
- Arthur, J. (2011). Lean six sigma demystified. McGraw-Hill Education.
- Aydin, E., Erkan, T. E., Zhang, S., Wang, K., & Zhang, Q. (2021). The effect of lean Six Sigma on waste and productivity in the tire manufacturing industry. Journal of Cleaner Production, 291, 125933. https://doi.org/10.1016/j.jclepro.2021.125933
- Bass, B. M., & Lawton, L. (2009). Transformational leadership and Six Sigma: A winning combination. Leadership & Organization Development Journal, 30(3), 280–22.
- Bhat, A., & Shetty, S. (2021). A review of quality control techniques and tools in tyre manufacturing. Journal of Industrial Engineering International, 17(1), 53–67. https://doi.org/10.1007/s40092-020-00402-x
- Boateng, P. (2014). A dynamic systems approach to risk assessment in megaprojects (Doctoral dissertation, Heriot-Watt University).
- Breyfogle, F. W., III. (2003). Implementing Six Sigma: Smarter solutions using statistical methods. Wiley.
- Devadasan, S. R., Sivakumar, V., Murugesh, R., & Shalij, P. R. (2012). Lean and agile manufacturing: Theoretical, practical and research futurities. PHI Learning Pvt. Ltd.
- Furterer, S., & Elshennawy, A. K. (2005). Implementation of TQM and lean Six Sigma tools in local government: A framework and a case study. Total Quality Management & Business Excellence, 16(10), 1179–1191.
- Gomes, L. F., de Campos, L. M., Nascimento, L. F., & de Oliveira, L. P. (2021). Lean six sigma in the tire supply chain. Journal of Cleaner Production, 314, 127965. https://doi.org/10.1016/j.jclepro.2021.127922
- Gopalakrishnan, N. (2010). Simplified lean manufacture. PHI Learning Pvt. Ltd.
- Gopalakrishnan, K., & Sundar, V. (2020). A case study on the application of lean six sigma methodology in a tyre manufacturing plant. Journal of Advanced Manufacturing Systems, 19(1), 53–66.
- Guerrero, J. E., Leavengood, S., Gutiérrez-Pulido, H., Fuentes-Talavera, F. J., & Silva-Guzmán, J. A. (2017). Applying lean six sigma in the wood furniture industry: A case study in a small company. Quality Management Journal, 24(3), 6–19.
- Gupta, P. (2007). Six Sigma business scorecard. Perspectives on Performance, 10.
- Gupta, V., Jain, R., Meena, M. L., & Dangayach, G. S. (2018). Six-sigma application in tire-manufacturing company: A case study. Journal of Industrial Engineering International, 14, 511–520. https://doi.org/10.1007/s40092-017-0234-6
- Hassan, M. K. (2013). Applying lean six sigma for waste reduction in a manufacturing environment. American Journal of Industrial Engineering, 1(2), 28–35.
- Kannan, D., & Khodaverdi, R. (2013). Lean Six Sigma: A literature review. International Journal of Lean Six Sigma, 4(2), 145–172. ( Lack of studies on the impact of Lean Six Sigma on environmental sustainability)
- King, P. L. (2009). Lean for the process industries dealing with complexity. CRC Press Taylor and Francis Group.
- Kumar, M., Antony, J., Singh, R. K., Tiwari, M. K., & Perry, D. (2006). Implementing the Lean Sigma framework in an Indian SME: A case study. Production Planning & Control, 17(4), 407–423.
- Mahadevan, B. (2015). Operations management: Theory and practice. Pearson Education India.
- Mishra, R., & Shah, P. (2016). An empirical study of implementation of lean six sigma in manufacturing industries of India. International Journal of Process Management and Benchmarking, 6(3), 306–326.
- Müller, P., & Kettunen, P. (2015). Lean Six Sigma in tyre manufacturing: Case study of a Finnish company. Journal of Industrial Engineering & Management, 8(4), 1164–1182. ( Limited studies on the application of Lean Six Sigma in specific stages of the tyre manufacturing process)
- Ogunnaike, O. O., & Adeleye, O. O. (2014). Application of lean six sigma in a manufacturing process: A case study. International Journal of Engineering & Technology, 4(6), 716–725.
- Pande, P. S., & Holpp, L. (2002). What is Six Sigma?. McGraw Hill Professional.
- Patil, P. M., Ingale, A. B., Kadam, R. P., & Kharde, V. B. (2022). A comprehensive study on quality improvement of tyre manufacturing process using Six Sigma methodology. Journal of Manufacturing Systems, 63, 444–461. https://doi.org/10.1016/j.jmsy.2021.11.005
- Radhakrishnan, R., Bahl, S., Mahto, R., & Garg, R. K. (2016). Application of lean Six Sigma methodology to reduce waste in a tire manufacturing company. International Journal of Productivity and Performance Management, 65(2), 189–204.
- Randhawa, J. S., & Ahuja, I. S. (2017). Evaluating impact of 5S implementation on business performance. International Journal of Productivity & Performance Management, 66(7), 948–978.
- Saaty, T. L. (2008). Decision making with the analytic hierarchy process. International Journal of Services Sciences, 1(1), 83–98.
- Shah, R., Ward, P. T., & Sanders, E. (2013). Impact of lean manufacturing and environmental management on business performance: An empirical study of manufacturing firms. International Journal of Production Economics, 141(2), 441–449.
- Shaw, K., Shankar, R., & Yadav, S. S. (2016). Implementing Six Sigma in developing countries: Challenges and opportunities. International Journal of Productivity & Performance Management, 65(7), 1004–1020. ( Lack of studies on the impact of cultural differences on the application of Lean Six Sigma)
- Singh, A. K., Khamba, J. S., & Sachdeva, A. (2017). Application of lean Six Sigma in a tyre manufacturing plant. International Journal of Quality & Reliability Management, 34(4), 437–458.
- Singh, S., Singh, D., & Sharma, S. (2018). Application of lean Six Sigma to improve the productivity of an Indian foundry. International Journal of Lean Six Sigma, 9(2), 149–172.
- Snee, R. D., & Hoerl, R. W. (2013). Leading Six Sigma: A step-by-step guide based on experience with GE and other six sigma companies. FT Press.
- Thomas, A., Barton, R., & Chuke-Okafor, C. (2008). Six Sigma and its applicability in the hospitality industry: A case study of a full-service hotel. International Journal of Hospitality Management, 27(2), 284–296.
- Vinodh, S., Gautham, S. G., Ramiya, R., & A. (2011). Implementing lean sigma framework in an Indian automotive valves manufacturing organisation: A case study. Production Planning & Control, 22(7), 708–722.
- Vokurka, R. J., Guimaraes, T., Connelly, B. L., Goffnett, S. P., Wagers, S., & Singh, B. (2015). An exploratory case study on lean Six Sigma in a tyre manufacturing company. International Journal of Production Research, 53(6), 1668–1677.
- Womack, J. P., Jones, D. T., & Roos, D. (1990). The machine that changed the world: The story of lean production. Simon and Schuster.
- Yadav, G., Seth, D., & Desai, T. N. (2018). Prioritising solutions for Lean Six Sigma adoption barriers through fuzzy AHP-modified TOPSIS framework. International Journal of Lean Six Sigma, 9(3), 270–300.