
 ?Mathematical formulae have been encoded as MathML and are displayed in this HTML version using MathJax in order to improve their display. Uncheck the box to turn MathJax off. This feature requires Javascript. Click on a formula to zoom.
Abstract
Product portfolio analysis is a critical aspect of small and medium-sized enterprises (SMEs) strategic planning and decision-making. It helps SMEs assess their existing product offerings, identify areas for improvement, and make well informed decisions about which products to keep, discontinue, or add to their portfolio. This type of analysis is crucial for SMEs as it enables them to optimize their product mix, allocate resources effectively, and respond to market changes, thereby ensuring growth and profitability. The objective of the research is to present a new product portfolio analysis tool that SMEs with a more efficient and effective way of evaluating their product offerings paying attention to those that cause a negative impact on performance. The Contribution Margin and Quantity Matrix (CMQ matrix) enables SMEs to gain a deeper understanding of their product mix, identify areas for improvement, and make informed decisions about which products to keep, discontinue, or add to their portfolio. This can lead to increased efficiency, better resource allocation and increased competitiveness, ultimately contributing to the success and profitability of the SME. The proposed instrument allowed decisions to be made after being applied in the analysis of the product portfolio of a retail store. The application of the proposed matrix allowed the analysis and decision making in relation to the product portfolio of an SME, facilitating an improvement in the performance indicators of the products studied.
1. Introduction
Boston Consulting Group’s Growth—Share Matrix (BCG Matrix) was a model extremely popular at the time of its inception in the early 1970s by the Boston Consulting Group (Jenkins & Williamson, Citation2016; Khajezadeh et al., Citation2019; Torquati et al., Citation2018). BCG Matrix in its original format is a simple matrix which establishes the relation between Market Growth Rate and Relative Market Share of different products, line of product or strategic business units and classify them into four categories as Pets, Question Marks, Cash Cows, and Stars (Nowak et al., Citation2020; Roy, Citation2020; Sulistyadi & Sukamdani, Citation2019).
This business analysis tool used come to assist companies in considering growth opportunities in long-term strategic planning and reviewing the company’s product portfolio where the different items in a business portfolio may move at a different pace trying to obtain the best competitive position by formulating a financing strategy for business units or product lines (Nowak et al., Citation2020; Roy, Citation2020; Solihat & Wibowo, Citation2020). Since its appearance, and despite having to compete with other strategic decision tools, this matrix is still being used as a corporate planning technique (Nowak et al., Citation2020; Roy, Citation2020; Sulistyadi & Sukamdani, Citation2019).
Despite the opinion of some authors that BCG has gone out of fashion (Drews, Citation2008; Duică et al., Citation2014; Madsen, Citation2017), the literature reviewed shows recent applications in various sectors: transportation (Duchaczek et al., Citation2018; Mo et al., Citation2020), retail (Roy, Citation2020), communication and computing services (Fadrian & Arifin, Citation2018; Nowak et al., Citation2020), agriculture (Hersen et al., Citation2018), construction (Phadtare, Citation2015), tourism (Sulistyadi & Sukamdani, Citation2019), auto industries (Kurilov & Kurilova, Citation2018), education (Fauzan et al., Citation2017), non-profit organizations (Haltofová & Štěpánková, Citation2014; Šebestová & Palová, Citation2015), regionals studies (Myllylä & Kaivo-Oja, Citation2015) and financial (Segoro & Rizal, Citation2017). The literature also shows a large number of applications of the BCG Matrix in the context of SMEs (Mura et al., Citation2017; Rufasha, Citation2018; Solihat & Wibowo, Citation2020; Suci, Citation2013; Zin et al., Citation2018).
The profuse use of the BCG Matrix in the context of small and medium sized enterprises (SMEs) is interesting because it is contradictory in relation to the current context in which this kind of organizations operate. Some authors recognize that the speed of adaptability to change plays a more significant role in strategic decision making than market shares (Nowak et al., Citation2020; Roy, Citation2020; Solihat & Wibowo, Citation2020), this would mean that the BCG Matrix may not be enough to make decisions in increasingly dynamic and turbulent business environments (Madsen, Citation2017).
Therefore, in spite of its wide theoretical appeal and high rate of usage, the usefulness of the above could be questioned if one takes into account that (1) SMEs need to quickly identify, evaluate and exploit opportunities to achieve adaptation to its environment (Arnaout & Esposito, Citation2018; Lemańska-Majdzik et al., Citation2018) and (2) some academics have questioned whether use of the matrix helps in causing businesses to succeed (Madsen, Citation2017; Rufasha, Citation2018; Untiedt et al., Citation2012). If the above is taken into account, it would be interesting to wonder if the BCG Matrix is helping to guide these types of companies in a changing environment, and what proposals could be made to make the right decisions in order to adapt to their environment.
Therefore, new tools are needed to analyze product portfolios in the context of SMEs. By embracing innovative approaches tailored to the unique challenges faced by SMEs, businesses can gain valuable insights to make informed decisions and optimize their product portfolios for sustainable growth. Given the limitations of the BCG matrix and the need for analytical tools that are more suited to the unique characteristics and challenges that the PYME face, this research aims to develop a new methodology to fill the methodological gap that currently exists. The new tool must include features that make it easier for these kinds of organizations to use it in a limited environment without compromising the goal, which is to make decisions informed by cause and have a more comprehensive understanding of the product portfolio under management.
The article is organized as follows: the next section presents the current theoretical and practical problems related to the application of the BCG matrix. The Method section explains the logic of the proposal matrix. Next, a practical case of the application of the proposed matrix is presented. Finally, the results of the research, its limitations and possible directions for future research are summarized.
2. Literature review
The BCG Matrix was presented as a tool that makes possible to evaluate the balance of a company’s portfolio and enables the positioning of activities according to two dimensions (Duchaczek et al., Citation2018; Khajezadeh et al., Citation2019; Madsen, Citation2017; Roy, Citation2020):
The growth rate of the market which is measured from the available statistical past data and it allows judging the dynamism and attractiveness of the market in which the company operates.
The relative market share held by the firm measured by the weight of its sale compared to the sales of its main competitors, providing an idea of the competitive level of the company.
Regardless of showing an evolution over time, with the aim of adapting in its way of being implemented, the essence of the BCG Matrix essence has remained relatively stable (Morrison & Wensley, Citation1991; Nippa et al., Citation2011; Pidun et al., Citation2011; Untiedt et al., Citation2012). Since its inception the BCG Matrix has been a controversial model in the fields of analysis and planning of product portfolios with a strategic focus. Literature generates an enormous amount of praise, but also criticism (Coronado-Hernandez et al., Citation2020; Khajezadeh et al., Citation2019; Madsen, Citation2017; ; Nippa et al., Citation2011; Untiedt et al., Citation2012). For some authors (Drews, Citation2008; Morrison & Wensley, Citation1991), BCG Matrix should be taught as a particular case of success in the innovation and dissemination of an analytical framework of the portfolio of products is not up to date and it is recommended not to use unless your criticism is clearly stated. Given that the intention of this article is to propose an alternative to the BCG matrix, we will focus on what are considered its most important limitations.
The literature reviewed shows in-depth analysis of both theoretical and practical limitations of the BCG Matrix (Duică et al., Citation2014; Madsen, Citation2017; Morrison & Wensley, Citation1991; Nippa et al., Citation2011; Pidun et al., Citation2011; Untiedt et al., Citation2012). Among the most recurrent criticisms in is the simplicity of the matrix and the reductionism on which it bases its operation. It is pointed out that there is an oversimplified prescriptions for action in which entrepreneurs only have to determine in which quadrant their product lines are and select a strategy (Mintzberg et al., Citation2005). The matrix is focused only on the analysis of financial flows and strategies to effectively manage the product portfolio. But it is questioned whether these are the only necessary factors to make such decisions (Abushova et al., Citation2017; Schiele et al., Citation2014).
The metrics used in the axes have been questioned. The concept of market growth rate is (1) ambiguous and multi—dimensional in nature and may be interpreted in different ways, possibly contradictory (Hersen et al., Citation2018; Mohajan, Citation2017; Roy, Citation2020; Schiele et al., Citation2014; Zin et al., Citation2018) and (2) is not the only indicator for attractiveness of a market (Abushova et al., Citation2017; Duică et al., Citation2014; Schiele et al., Citation2014). On the other hand, high relative market share is not the only success factor, and BCG Matrix assumed causal relationship between market share and profitability may not truly exist (Madsen, Citation2017; Mohajan, Citation2017; Untiedt et al., Citation2012). Generally, it could be difficult to determine the appropriate criteria for determining when a growth market rate or relative market share is high or low, particularly in market contexts and different products. This makes it difficult to place businesses or products in all four quadrants (Madsen, Citation2017; Mohajan, Citation2017; Roy, Citation2020).
The fast pace and uncertainty in today’s markets means that the application of the matrix requires greater speed to allow adaptation to an increasingly unpredictable business environment, but BCG Matrix is a non-dynamic analysis (Hersen et al., Citation2018; Nowak et al., Citation2020; Roy, Citation2020). This particular criticism could make decision-making difficult in the context of SMEs. The first problem is the difficulty in obtaining the data necessary to develop a matrix (Mohajan, Citation2017; Nowak et al., Citation2020). The second is the static nature of the analyzes that enable only to determine the current situation in the enterprise (only ex post data is used) (Nowak et al., Citation2020). These types of organizations are vulnerable in a hypercompetitive context in which disruptive changes abound (Arendt, Citation2008; Levy & Powell, Citation1998), so they must be agile in their strategic decisions to achieve strategic fit with their environment (Dibrell et al., Citation2008 (Chan et al., Citation2019)).
These criticisms highlight a great need to develop new tools supporting strategic decision in the SMEs (Nowak et al., Citation2020; Untiedt et al., Citation2012). Some efforts have been made with this objective, and although not all have been applied in SMEs, they are worth highlighting.
There are interesting proposals to improve theory and practice in understanding and applying the BCG Matrix. In its practical use the matrix has been combined with other methods such as (1) grey relational analysis (Nowak et al., Citation2020), BCG Index following a heuristic method (Roy, Citation2020), (3) shift-share analysis (Liu et al., Citation2016; Mo et al., Citation2020), (4) methods of cluster analysis (Kurilov & Kurilova, Citation2018), (5) neural networks (Khajezadeh et al., Citation2019), (6) Delphi methodology (Myllylä & Kaivo-Oja, Citation2015), (7) complex approach (Abushova et al., Citation2017), (8) fuzzy logic (Al-Refaie et al., Citation2013), (9) dynamic systems (Khakbaz et al., Citation2020) and (10) contribution margin and the generated profit margin of the sales (Coronado-Hernandez et al., Citation2020; Jank et al., Citation2019; Zin et al., Citation2018). In particular, this last work is interesting for two reasons (1) to offer more facilities to entrepreneurs for its application and (2) to have points of contact with previous research carried out by the authors (De Miguel Guzmán et al., Citation2019; García Vidal et al., Citation2003, Citation2010; Pupo Guisado et al., Citation2010).
Regarding the cited work, the interconnection of strategic management tools with internal financial data which is accessible to entrepreneurs is considered useful. However, the proposal does not take into account an analysis in relation to demand, which is not always expressed in sales indicator. Sales indicator hides at least two elements that must be analyzed for improvement purposes: (1) was it possible to sell more but there was no demand for the products offered? and (2) was it possible to sell more but was out of stock at the time of demand?
It is also considered that the use of the sales indicator could be repetitive since it includes the price of the product, which was already entered in the proposed matrix. More interesting is the use of a more elementary indicator such as quantities sold but which allows other analyzes, with the unit price (sales) and with the unit variable cost (total variable cost).
We strongly agree with the evaluation through the unitary contribution margin. This indicator is considered the most advisable for the managerial analysis, once it is determined by deducting variable costs from the selling price (Zin et al., Citation2018). The analysis associated with the contribution margin makes variable or direct costing a useful tool for the valuation of the product, highlighting the extent to which it is capable of contributing to profits. Variable or direct costing overcomes the main problem of absorption costing, that is, the distortion of the relationship in time of sales, cost of goods sold and net profit. The analysis operating expenses, although not negligible, are not as important in some organizations as will be discussed in the methods section.
On the other hand, the matrix proposal seems questionable when equating the product classification with the BCG Matrix (see Table ).
Table 1. Comparison between BCG matrix and sales matrix
For example, a Cash Cows product with high participation and low growth is generally mature in its life cycle. They dominate the market with high and stable sales levels and, by requiring low levels of investment according to the BCG logic, they are liquidity generators. A product, even if it has a high contribution margin per unit, if it does not reach interesting sales volumes, it does not make a true contribution to the organization. The Question Marks product has a low share, but in an explosive growth market. Although your unit variable cost might include sales commissions and unit promotions, it does not necessarily make you have a low unit contribution margin. This type of product could go on the market with a price-skimming strategy and have a high contribution margin per unit. Similarities and differences aside, it is considered that there must be a break in the classificatory logic to avoid the inevitable comparisons of the behavior of products in one matrix and another. The authors of this research consider it necessary to interconnect the strategic management tools of the product portfolio with financial data and the behavior of customer demand.
There is some data to support the limitations of the BCG matrix. For example, a study by Armstrong and Brodie (Citation1994) found that the use of the BCG matrix, did not necessarily lead to better decision-making. The study found that the use of these methods did not improve the accuracy of forecasts or the quality of decisions. This investigation examined the effects of different portfolio planning methods on investment decisions made by over 1000 managers. The study found that the use of the BCG matrix, a popular portfolio planning method, led to a high likelihood of selecting the less profitable investment. Specifically, 63.5% of those in the BCG treatment groups chose the unprofitable project, compared with 44.7% in control groups. When subjects used the BCG matrix in their analysis, 86.8% selected the unprofitable project, compared to only 15.3% of those using profit calculations. These results suggest that the use of the BCG matrix may lead to suboptimal investment decisions. The study highlights the importance of considering other factors, such as profitability, when making investment decisions and cautions managers against relying solely on portfolio planning methods.
Another study by Barwise, Marsh, and Wensley (189) found that the BCG matrix could lead to confusion surrounding the incremental nature of benefits for any specific investment decision. In their paper they argue that in situations where investment is necessary only to maintain market share and high profits are expected compared to the base case, the company’s reported profits may continue to fall and senior management is surprised that apparently only 5% of a project that promised a 35% return has been realized.
The authors of this research concluded that the BCG matrix should be used with caution and that managers should be aware of the limitations of the approach.
3. Method
The proposed CMQ matrix is a strategic analysis tool used to evaluate a company’s product portfolio. It is based on the idea that products can be classified into four different categories in the same way that BCG matrix, but based on different indicator. The methods used to compile CMQ matrix include the following steps:
Identification of products: The first step is to identify and select the products or business units that will be analyzed. These can be individual products or product lines.
Determination contribution margin per unit: The contribution margin per unit is interpreted as the relevant revenue for each product (Zin et al., Citation2018). The equation for the calculation is as follows:
Where:: contribution margin per unit
: unit price
: unit variable cost,
Calculating the contribution margin of a product is relatively straightforward and provides valuable insights into its profitability. Both cost and price are two indicators that are easy to obtain in any type of organization. The contribution margin is calculated by deducting the product’s variable production costs from its sales revenue. Direct materials, direct labor, and variable overhead costs are examples of these variable costs. The contribution margin may be calculated by deducting these expenses from sales revenue to see how much money is available to pay for fixed expenditures and boost the company’s profit. This estimate is crucial for determining a product’s financial feasibility and for deciding on price, cost management, and resource allocation. Calculating the contribution margin becomes an easy but effective method for assessing the financial success of a product with precise and current financial data. In the context in which the analysis will carry out (SME), operational expenses are not as significant as in other organizations since the facilities are in the same house as the entrepreneurs. The family lives off business profits in which they all collaborate.
(3) Evaluation of number of units sold: Given a constant contribution margin per unit and stable fixed costs, the period-to-period change in operating income at variable costing is driven only by changes in the number of units sold (Q), which is the second indicator.
Calculating the number of units sold in a neighborhood store can be relatively straightforward due to its limited size and scope. In a neighborhood store, transactions and sales tracking are often more manageable compared to large retail chains. To calculate the number of units sold, the store owner or manager can use basic methods such as keeping track of daily sales or using a point-of-sale (POS) system that automatically records sales and inventory. By collecting and analyzing this data, a clear picture of product demand can be obtained and sales trends can be tracked over time. This indicator provides valuable information for making decisions about inventory, product sourcing and sales strategies in the neighborhood store.
(4) Calculation of the lost target: In the business environment, the lost goal indicator can be related to metrics that measure the number of sales or customers lost in a given period. In the particular case of this research, it is associated with what is lost in terms of sales. This indicator is important to evaluate the company’s performance and take measures to improve customer retention and increase sales. The lost goal or what is left to be obtained could be either (1) because it cannot cover the market demand or (2) because the market does not demand all the supply possibilities.
In both cases the total variable cost is needed and can be calculated as follow:
The components of this formula have already been explained in step 2 and 3. In the application process, this information would already be available, so calculating the total variable cost would not pose any difficulty.
In the first case, the missed goal indicator is calculated as follows.
Where:LG: Lost goal, that is, profits not obtained because the possibility of supply is not demanded by the market. : Total variable cost
: Possible sales to be made according to market demand.
: Sales that have been obtained.
Where:: Actual quantity sold of a specific product
Where:: Quantity not sold due to exhaustion of the product
In the second case, the indicator takes the following form:
Where:LG: Lost goal, that is, profits not obtained because the possibility of supply is not demanded by the market.: Total variable cost
: Possible sales to be made according to the organization’s capacity
: Sales that have been obtained.
Where:: Quantity planned to sellIn both cases:
: The organization’s average contribution margin ratio over a selected period.
Without technology assistance, calculating sales in a small business may necessitate a more manual method, but it is still possible. In this situation, the owner or staff can maintain a thorough record of transactions using conventional techniques, such a piece of paper or a sales ledger. The recorded sales would be totalled up to produce the daily total at the end of each day. Even though it could need more time and work than utilizing technology instruments, this method nonetheless gives a detailed picture of sales and enables tracking of business activity. Basic analytical methods can also be used to gather extra data on business performance, such as documenting sales by product category or contrasting sales with earlier periods. Even while it may need a more manual approach, calculating sales in a small store without technology tools is still an efficient technique to assess performance and make wise business decisions.
The loss goal strategy, according to the study’s authors, aids businesses in concentrating on the prospective losses that will always offset potential gains. This means that companies should know the loss target and work to avoid it. This strategy could be preferable for a number of reasons:
First, it can help businesses in identifying and averting possible threats. Companies may recognize risks and take precautions to avoid them before they happen by recognizing the possible damage.
Second, this strategy can boost business productivity. Companies may discover places where they are losing money and take steps and take steps to avoid it.
Third, adopting this strategy can spur business innovation. Companies may find areas for improvement and create fresh ways to prevent loss by concentrating on possible loss.
However, the authors of this research recognize that each company must assess its situation and decide whether or not this approach is appropriate to guide its performance (See Figure ).
(4) CMQ matrix chart: Using a Cartesian axis graph, the products are plotted based on their quantity sold (vertical axis) and contribution margin (horizontal axis), the bubble represents the lost goal. The lines that divide the axes represent the mean values of the indicators in each case. The figure shows four quadrants, each of which includes the analyzed products. The description assumes the form of the letter Z.
Figure 1. CMQ matrix.
Quadrant I show the products with high contribution margin also high sales levels. Quadrant II shows the products with a low contribution margin but high market demand. Quadrant III contains products with a high contribution margin but little market demand. Finally, quadrant IV exhibits those products with a low contribution margin and low market demand.
Each quadrant proposes an obvious strategy for the analysis of the matrix. A star product must try to maintain its position as long as possible, even improve it. Products whose contribution is sales volume must increase the number of units sold. A question product must be treated with care. It leaves high margins but low sells. The ideal would be to sell it more, but this may not be possible on all occasions, which could lead to questioning its presence in the portfolio at some point. Problem products have two alternatives to consider. Either sell more or exit from the portfolio. The preceding explanation constitutes a kind of “recipe”, a problem that most of the matrices used for decision-making suffer from.
In the case at hand, the knowledge of the lost goal is essential to make a strategic decision. However, this indicator is not represented in the matrix since it assumes different values regardless of the quadrant. This situation makes any representation just a particular case. Then, the focus of attention will always be the lost goal, but the decision is not easy. The behavior product trend is needed and also what causes the missed goal. Maybe a “volume product” cannot sell more because of a saturated market, perhaps because it has begun to enter its maturity or decline stage. For similar reasons, a “star product” can become a “question product”.
The product portfolio of a retail SME will serve as an example to illustrate the proposed portfolio analysis matrix. In pursuance of a more understandable proposal, only the behavior of six products is analyzed. The products selection is based on the opinion of the business owner. The business selection of was made based on the judgment of the authors taking into account the importance of this type of business in the Ecuadorian economy. In 2022 this economy sector grew 7.0% compared to the previous year (Banco Central del Ecuador, Citation2022).
4. Results
The analysis considered six products chosen by the entrepreneur. There were no variations in the variable unit costs of the products or their sales prices in the four months of the study. Table shows the situation at the start of the study.
Table 2. Initial position of the portfolio
From the initial diagnosis, it is necessary to comment that the planning of products to be sold is done completely empirically. There is no preliminary study that determines the amount to sell. The planning is based on the experience of the entrepreneur. Based on it, products of each type are requested from the suppliers, and it is expected that they will be sold. As can be seen, for most of the products, the supply is greater than the demand, a typical situation in retail establishments. Some products were demanded above supply. The fact that they were out of stock prevented these sales from being achieved, so the entrepreneur was unable to satisfy this need at the time it appeared. The possible sales to be achieved exceed the sales achieved causing a lost goal of $ 429.00. Figure shows the situation of the portfolio.
Figure 2. CMQ matrix, initial situation (end month 1).
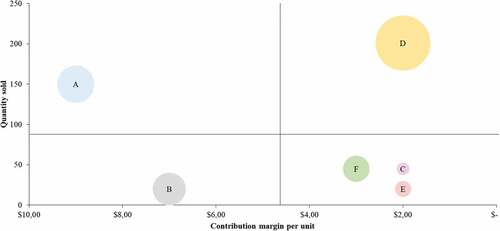
The CMQ matrix allows the product portfolio with the indicators shown in Table . It is possible to appreciate that D is the product with the highest lost goal. The contribution of this product is by volume since its contribution margin is low in correspondence with the rest of the products analyzed.
However, in the exchange process with the entrepreneur and the data obtained from previous periods, it was possible to verify that the tendency of this product in terms of sales decreased in the last three months. The cause of the lost goal is an excess of products that were not possible to insert into the market. This situation leaves two alternatives for the future. The first alternative is associated with the verification that the downward trend of the product will continue in the future due to changes in needs, desires and (or) purchasing power of customers. The immediate action is to negotiate with suppliers to buy less of this product and adjust according to demand forecasts. The second alternative considers the possibility that the product can still be sold well, and that the cause of its low sales is that demand has ceased to be stimulated. The immediate action is to work on promotion to stimulate said demand.
Another glance at the matrix presented is to focus on product A. This product shows a lower lost goal than D while having a higher contribution margin. Take some actions with product A would bring a substantial contribution to business performance. In this case, the cause of the lost goal is the depletion of the product, which prevented the sale of everything demanded. Selling just one more product A would leave the business in a better position in terms of lost target. Everything indicates that behavior should be oriented towards negotiating with suppliers to increase the number of products in inventory.
In this situation, work can be done to correct the behavior of both products since the fundamental action is to negotiate with suppliers.
This action also makes it possible to plan the quantities of products to be sold in the next period based on current behavior. In this sense, a round of conversations was held with the suppliers of the products under study to establish the new needs to be satisfied. Table shows the situation after the negotiation actions with suppliers materialized.
Table 3. Portfolio situation after actions
From the table, we can see an increase in the quantities requested from suppliers of product A, and a decrease in the product D quantity, adjusted to the previous month’s sales and taking into account the downward trend in sales of said product. The product E quantity also received an adjustment (see Figure ).
Figure 3. Adjustment to the planning of product quantities.
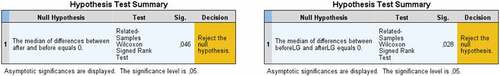
Two aspects should be highlighted in Table in comparison with Table . First, the sales increase of the products studied by 21.86 %, and second, the decrease in the lost goal by 89.51 %. Figure shows that these variations are significant.
Figure 4. Significance of the achieved variations.
As a result of the negotiations carried out and the work with the new quantities planned and those sold, the actual product portfolio situation can be seen in Figure .
Figure 5. CMQ matrix, actual situation (end month 2).
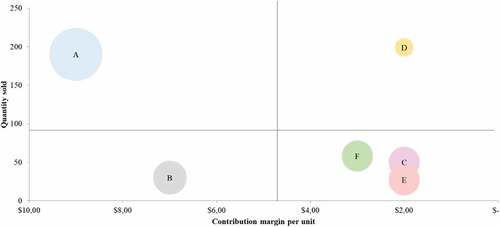
Figure shows a different situation. Product D sold less the second month than the first, but its loss goal decreased. Product A sold more, and its loss goal decreased. However, being the one with the greatest missed goal, the focus is on it. Market demand is not yet satisfied with product A, so when it stops selling, having a high contribution margin, the consequence is that the target loss is high.
5. Conclusion
Portfolio analysis is a type of study that allows making decisions concerning the products a company sells; this is vital in retail store operations (Coronado-Hernandez et al., Citation2020). The BCG matrix is still a widely used tool for these purposes (Maha et al., Citation2020a; Nowak et al., Citation2020; Roy, Citation2020; Sloane et al., Citation2020a), but multiple limitations are also pointed out (Kurilov & Kurilova, Citation2018; Madsen, Citation2017; Mo et al., Citation2020; Mohajan, Citation2017). For this reason, tools are required to analyze the information and make decisions out of this analysis. The CMQ matrix meets these requirements.
The discussed results are similar to those of studies that propose methodological alternatives for the BCG matrix (Mo et al., Citation2020; Nowak et al., Citation2020). The similarities are associated with the logic of classifying the products of a portfolio in four quadrants, although the classification itself is different; in this paper, the authors proposed a new portfolio analysis matrix based on three indicators: contribution margin, quantities sold, and lost goal. By following this approach, the authors share a methodological perspective with other researchers (Coronado-Hernandez et al., Citation2020; Haltofová & Štěpánková, Citation2014; Jank et al., Citation2019; Zin et al., Citation2018) who introduce organizational performance indicators such as profit, sales, and contribution margin.
The developed matrix responds to some disadvantages of the BCG matrix, particularly those related to its static nature and the impossibility of acting systemically (Duchaczek et al., Citation2018; Kurilov & Kurilova, Citation2018; Mohajan, Citation2017). Even when the main restriction to the growth of the organization’s goal is identified, the matrix allows act globally to improve the rest of the behavior of the products. It all depends on the particular action you decide to take. The matrix intends to focus the attention of the decision-makers on the lost goal as an incentive for improvement with solutions in short-term decision-making. The continued use of the matrix would allow long-term decisions.
The matrix application requires a careful but not complex analysis that ensures a system vision of the product portfolio. Through this analysis, retailers can determine the products that generate the most contribution margin, the highest sales, and those that need priority in terms of the lost goal. The decision derived from the analysis is not as simple as it might seem. It is not a matter of placing the product in a quadrant and offering a solution like a recipe. This way of acting is a fundamental difference from the BCG matrix. The matrix allows working on several products with several strategic actions, but everything depends on the action’s nature and the resources involved. It is possible to go step by step, acting where you can achieve the highest impact on the lost goal, inventories, the level of service, and replenishment times. This way of acting is shared with the proposals of other authors (Coronado-Hernandez et al., Citation2020; Jank et al., Citation2019; Zin et al., Citation2018).
Based on the stock recommendations, business owners can make the right decisions to keep the portfolio aligned with growth objectives. The development of the CMQ matrix adds to the effort to provide SMEs with tools adjusted to their context.
Disclosure statement
No potential conflict of interest was reported by the author(s).
Additional information
Notes on contributors
Gelmar García-Vidal
Gelmar García Vidal PhD in Economics. Diploma in Business Management - Diploma in Marketing Management. Industrial Engineer. Full Time Professor at the Faculty of Law, Social and Administrative Sciences of Universidad UTE. He has been an undergraduate and graduate professor in disciplines associated with Management Science such as Business Administration, Strategic Management, Organizational Change Management, Finance, Strategic Marketing, Marketing, Market Research, Entrepreneurship, Negotiation, among others. He has more than 25 years of experience as a university professor. His work has also been developed in the area of consulting and research in various organizations. He has been a member of the faculty in several diploma, masters and doctoral programs in Cuba, Venezuela, Mexico, Nicaragua and Ecuador. He has an extensive production of scientific articles.
Alexander Sánchez-Rodríguez
Alexander Sánchez-Rodríguez PhD in Business Sciences from the University of Valladolid, Spain. Industrial Engineer. Full Professor at the Faculty of Administrative Sciences at the Equinoctial Technological University, Ecuador. His professional work has been developed in consulting and teaching in various matters related to business sciences, such as Human Talent Management and Quality.
Reyner Pérez-Campdesuñer
Reyner Pérez-Campdesuñer PhD in Technical Sciences from the University of Holguin, Cuba. Industrial Engineer. Full Professor at the Faculty of Administrative Sciences at the Equinoctial Technological University, Ecuador. His professional work has been developed in consulting and teaching in various matters related to business sciences, such as Quality Management, Strategic Management, among others.
Rodobaldo Martínez-Vivar
Rodobaldo Martínez-Vivar PhD in Technical Sciences from the University of Holguin, Cuba. Industrial Engineer. Full Professor in the Faculty of Administrative Sciences at the Equinoctial Technological University, Ecuador. His professional work has been developed in consulting and teaching in various subjects related to business sciences, such as Human Resource Management, Logistics and Operations Management.
References
- Abushova, E., Burova, E., Suloeva, S., & Shcheglova, A. (2017, 20-22 September). Complex approach to selecting priority lines of business by an enterprise. Paper presented at the 6th International Conference on Reliability, Infocom Technologies and Optimization (Trends and Future Directions), Noida, India. ICRITO.
- Al-Refaie, A., Rawabdeh, I., & Arabiyat, H. (2013). Developing a fuzzy logic decision support system for strategic planning in industrial organizations. International Journal of Intelligent Systems and Applications in Engineering, 1(2), 14–16.
- Arendt, L. (2008). Barriers to ICT adoption in SMEs: How to bridge the digital divide? Journal of Systems & Information Technology, 10(2), 93–108. https://doi.org/10.1108/13287260810897738
- Armstrong, J. S., & Brodie, R. J. (1994). Effects of portfolio planning methods on decision making: Experimental results. International Journal of Research in Marketing, 11(1), 73–84. https://doi.org/10.1016/0167-8116(94)90035-3
- Arnaout, B., & Esposito, M. (2018). The value of communication in turbulent environments: How SMEs manage change successfully in unstable surroundings. International Journal of Entrepreneurship & Small Business, 34(4), 500–515. https://doi.org/10.1504/IJESB.2018.093576
- Banco Central del Ecuador. (2022). Ecuador registró un crecimiento interanual de 3,8% en el primer trimestre de 2022. Retrieved from https://www.bce.fin.ec/boletines-de-prensa-archivo/ecuador-registro-un-crecimiento-interanual-de-3-8-en-el-primer-trimestre-de-2022
- Chan, C. M. L., Teoh, S. Y., Yeow, A., & Pan, G. (2019). Agility in responding to disruptive digital innovation: Case study of an SME. Information Systems Journal, 29(2), 436–455. https://doi.org/10.1111/isj.12215
- Coronado-Hernandez, J. R., Ospina-Mateus, H., Baron-Villamizar, J., Vidal-Pacheco, L., Piñeres-Castillo, A., Rojas-Millán, R. H., & Silva, J. (2020). A method to rationalize the product portfolio in retail stores. In V. K. Gunjan, S. Senatore, A. Kumar, X.-Z. Gao, & S. Merugu (Eds.), Advances in cybernetics, cognition, and machine learning for communication technologies (pp. 509–515). Springer Singapore. https://doi.org/10.1007/978-981-15-3125-5_51
- De Miguel Guzmán, M., García Vidal, G., Sánchez Rodríguez, A., & Martínez Vivar, R. (2019). Desempeño de una pequeña empresa: manejo de su cartera de producto. Ciencias Holguín, 25(3), 16–29.
- Dibrell, C., Davis, P. S., & Craig, J. B. (2008). Fueling innovation through information technology in SMEs. Journal of Small Business and Management, 46(2), 203–218. https://doi.org/10.1111/j.1540-627X.2008.00240.x
- Drews, H. (2008). Farewell to the growth share matrix after more than 35 years of usage? A critical examination of the BCG matrix. Zeitschrift fur Planung und Unternehmenssteuerung, 19(1), 39–57. https://doi.org/10.1007/s00187-008-0041-8
- Duchaczek, A., Skorupka, D., Waniewska, A., & Kuchta, D. (2018). Application of portfolio methods for the classification of unmanned aerial vehicles. AIP Conference Proceedings, 1978(1), 240002. https://doi.org/10.1063/1.5043863
- Duică, A., Croitoru, G., Duică, M. C., & Robescu, O. (2014). The rise and fall of B.C.G. model. Paper presented at the 8th International Management Conference “Management Challenges For Sustainable Development”, Bucharest.
- Fadrian, A., & Arifin, A. S. (2018). Study on 2G termination in Indonesia using BCG matrix. Paper presented at the Proceedings - 2018 5th International Conference on Information Technology, Computer and Electrical Engineering, ICITACEE 2018, Semarang, Indonesia.
- Fauzan, M. I. R., Yuniaristanto, Hisjam, M., & Rasli, A. M. (2017). Assessment of university spin-off company competitiveness based on products performance and expert opinion: A case study on bioproduct based spin-off company. Advanced Science Letters, 23(9), 8737–8740. https://doi.org/10.1166/asl.2017.9961
- García Vidal, G., González Velázquez, M. L., & Sánchez Almira, T. (2010). El diagnóstico de la influencia de la satisfacción del cliente en la imagen, posicionamiento y resultados económicos de un complejo comercial detallista. Observatorio de la Economía Latinoamericana, 140. https://econpapers.repec.org/article/ervobserv/y_3a2010_3ai_3a140_3a10.htm
- García Vidal, G., Pupo Guisado, B., & González Velázquez, M. L. (2003). Análisis comparativo de la cadena de productos de una empresa transportista del turismo en el Oriente cubano. Folletos Gerenciales, VII(01), 15–23.
- Haltofová, P., & Štěpánková, P. (2014). An application of the Boston matrix within financial analysis of NGOs. Procedia - Social & Behavioral Sciences, 147, 56–63. https://doi.org/10.1016/j.sbspro.2014.07.103
- Hersen, A., da Silva, J. C. G. L., & Timofeiczyk Junior, R. (2018). A critical approach to the use of the BCG matrix: Portfolio analysis of Brazilian pulp marketed in the international market. Revista Árvore, 42(3), e420308. https://doi.org/10.1590/1806-90882018000300008
- Jank, M.-H., Dölle, C., & Schuh, G. (2019). Product portfolio design using prescriptive analytics. In R. Schmitt & G. Schuh (Eds.), Advances in production research (pp. 584–593). Springer International Publishing.
- Jenkins, W., & Williamson, D. (2016). Strategic management and business analysis. Routledge. https://doi.org/10.4324/9781315745565
- Khajezadeh, M., Fallah Niasar, M. S., Asli, S. A., Davari, D. D., Godarzi, M., & Asgari, Y. (2019). Application of neural network in portfolio product companies: Integration of Boston consulting group matrix and Ansoff matrix. International Scholarly and Scientific Research & Innovation, 13(6), 809–813.
- Khakbaz, S. B., Shahhoseini, M. A., Divandari, A., & Rabiee, H. (2020). Dynamic product portfolio management modeling for the financial technology industry. Iranian Journal of Finance, 4(3), 49–79. https://doi.org/10.22034/ijf.2020.209903.1092
- Kurilov, K., & Kurilova, A. (2018). The possibility of applying the BCG matrix and methods of cluster analysis for forecasting the development of national auto industries. Paper presented at the Proceedings of the 31st International Business Information Management Association Conference, IBIMA 2018: Innovation Management and Education Excellence through Vision 2020, Milan, Italy.
- Lemańska-Majdzik, A., Sipa, M., & Skibiński, A. (2018). The impact of the external environment on the functioning of SMEs - Results of own studies. Paper presented at the Economy, Finance and Business in Southeastern and Central Europe
- Levy, M., & Powell, P. (1998). SME flexibility and the role of information systems. Small Business Economics, 11(2), 183–196. https://doi.org/10.1023/a:1007912714741
- Liu, M., Kang, S. H., & Ahn, W. C. (2016). Analysis of the market structure and shift-effects in North China ports. The Asian Journal of Shipping and Logistics, 32(3), 179–186. https://doi.org/10.1016/j.ajsl.2016.09.007
- Madsen, D. O. (2017). Not dead yet: The rise, fall and persistence of the BCG matrix. Problems and Perspectives in Management, 15(1), 19–34. https://doi.org/10.21511/ppm.15(1).2017.02
- Maha, K. A., Cahyandito, M. F., & Purnomo, D. (2020). Mapping of business potentials of Maha orange plantation using the business model Canvas and BCG matrix. IOP Conference Series: Earth and Environmental Science, 443, 012045. https://doi.org/10.1088/1755-1315/443/1/012045
- Mintzberg, H., Lampel, J., & Ahlstrand, B. (2005). Strategy Safari: A guided tour through the wilds of strategic management. The Free Press.
- Mohajan, H. K. (2017). An analysis on BCG growth sharing matrix. Noble International Journal of Business and Management Research, 2(1), 1–6.
- Mo, S. W., Lee, K. B., Lee, Y. J., & Park, H. G. (2020). Analysis of import changes through shift-share, location quotient and BCG techniques: Gwangyang Port in Asia. The Asian Journal of Shipping and Logistics, 36(3), 145–156. https://doi.org/10.1016/j.ajsl.2020.01.001
- Morrison, A., & Wensley, R. (1991). Boxing up or boxed in?: A short history of the Boston consulting group share/growth matrix. Journal of Marketing Management, 7(2), 105–129. https://doi.org/10.1080/0267257X.1991.9964145
- Mura, L., Havierniková, K., & Machová, R. (2017). Empirical results of entrepreneurs’ network: Case study of Slovakia. Serbian Journal of Management, 12(1), 121–131. https://doi.org/10.5937/sjm12-10418
- Myllylä, Y., & Kaivo-Oja, J. (2015). Integrating Delphi methodology to some classical concepts of the Boston consulting group framework: Arctic maritime technology BCG Delphi foresight—a pilot study from Finland. European Journal of Futures Research, 3(1), 2. https://doi.org/10.1007/s40309-014-0060-7
- Nippa, M., Pidun, U., & Rubner, H. (2011). Corporate portfolio management: Appraising four decades of academic research. Academy of Management Perspectives, 25(4), 50–66. https://doi.org/10.5465/amp.2010.0164
- Nowak, M., Mierzwiak, R., Wojciechowski, H., & Delcea, C. Grey portfolio analysis method. (2020). Grey Systems: Theory and Application, 10(4), 439–454. ahead-of-print(ahead-of-print). https://doi.org/10.1108/GS-11-2019-0049
- Phadtare, M. T. (2015). Business portfolio planning at Roland construction company limited. Asian Journal of Management Cases, 12(1), 42–54. https://doi.org/10.1177/0972820114561929
- Pidun, U., Rubner, H., Krühler, M., Untiedt, R., The Boston Consulting, G., & Nippa, M. (2011). Corporate portfolio management: Theory and practice. Journal of Applied Corporate Finance, 23(1), 63–76. https://doi.org/10.1111/j.1745-6622.2011.00315.x
- Pupo Guisado, B., González Velázquez, M. L., & García Vidal, G. (2010). Propuesta metodológica para el estudio de la cartera de negocios en las organizaciones. Observatorio de la Economía Latinoamericana, 140. https://econpapers.repec.org/article/ervobserv/y_3a2010_3ai_3a140_3a9.htm
- Roy, D. (2020). Formulation of BCG Index (BCGI): An empirical study on Wal-Mart and Amazon (1999–2018). Journal of Transnational Management, 25(1), 30–56. https://doi.org/10.1080/15475778.2019.1702437
- Rufasha, E. (2018). Small business strategy and performance in a developing economy: an exploratory analysis of Zimbabwe’s small business sector [ PhD Thesis]. University of Salford. http://usir.salford.ac.uk/id/eprint/48282/
- Schiele, H., Harms, R., & Banerjee, S. (2014). A national competitiveness-based portfolio approach for international strategic management: Illustrated with the case of the TATA industries. European Journal of International Management, 8(1), 106–125. https://doi.org/10.1504/EJIM.2014.058494
- Šebestová, J., & Palová, Z. (2015). Sustainability of financial portfolio of non-profit organisations in the Czech Republic. Paper presented at the Proceedings of the 26th International Business Information Management Association Conference - Innovation Management and Sustainable Economic Competitive Advantage: From Regional Development to Global Growth, IBIMA 2015, Madrid, Spain.
- Segoro, W., & Rizal, R. (2017). The competitive strategy for a Shari’a Business Unit (SBU): Pension fund management from PT Bank Muamalat Indonesia. International Journal of Economic Research, 14(5), 125–132.
- Sloane, P. D., Castro, M. G., & Munshi, E. (2020). How small neighborhood convenience store operators in Ecuador and Mexico view the growing presence of retired Americans. In P. D. Sloane, S. Zimmerman, & J. Silbersack (Eds.), Retirement migration from the U.S. to Latin American colonial cities (pp. 91–105). Springer International Publishing.
- Solihat, A., & Wibowo, L. A. (2020). Strategy analysis of SME´s printing services in Garut. Management and Entrepreneurship Research Review, 1(2), 79–88. https://doi.org/10.35899/merr.v1i2.125
- Suci, R. P. (2013). Analysis strategy for small and medium business development policy Gresik district in East Java. IOSR Journal of Business and Management, 8(1), 1–9. https://doi.org/10.9790/487X-0810109
- Sulistyadi, K., & Sukamdani, N. B. (2019). Decision support system on the management of coastal ecotourism in Pramuka Island, Seribu Islands. Journal of Economics, Management and Trade, 25(3), 1–9. https://doi.org/10.9734/jemt/2019/v25i330197
- Torquati, B., Scarpa, R., Petrosillo, I., Ligonzo, M. G., & Paffarini, C. (2018). Chapter 10 - How can consumer science help firms transform their dog (BCG Matrix) products into profitable products? In A. Cavicchi & C. Santini (Eds.), Case studies in the traditional food sector (pp. 255–279). Woodhead Publishing.
- Untiedt, R., Nippa, M., & Pidun, U. (2012). Corporate portfolio analysis tools revisited: Assessing causes that may explain their scholarly disdain. International Journal of Management Reviews, 14(3), 263–279. https://doi.org/10.1111/j.1468-2370.2011.00316.x
- Zin, R. A., Bombana, L. P., & Barcellos, P. F. P. (2018). Evaluation of two companies’ sales teams with the BCG matrix using profit and contribution margin. Gestao e Producao, 25(4), 826–838. https://doi.org/10.1590/0104-530X634-18