
 ?Mathematical formulae have been encoded as MathML and are displayed in this HTML version using MathJax in order to improve their display. Uncheck the box to turn MathJax off. This feature requires Javascript. Click on a formula to zoom.
Abstract
The paper investigates how income diversification and capital adequacy affect the liquidity creation of banks in Kenya. We employed unbalanced panel data from 36 commercial banks from 2001 to 2020. We extracted data from published banks’ financial reports and statements. The study used the broad and narrow measures to measure liquidity creation. Owing to the persistent nature of liquidity creation, we used a dynamic panel model and a two-step system Generalized Method of Moments (SYS GMM) in the analysis. The findings suggest a positive linkage exists between income diversification and the liquidity creation of commercial banks, implying that well-diversified banks have a high level of liquidity creation and vice versa. However, the study discovered a negative relationship between capital adequacy and liquidity creation, supporting the financial fragility-crowding out hypothesis. Consequently, the study suggests that the diversification drive in banks must be reinforced to enhance their liquidity creation. Additionally, due to the tradeoff between capital adequacy and liquidity creation, an optimal level of capital is required to provide a buffer against shocks without negatively impacting liquidity creation, a crucial channel through which banks contribute to the economy.
PUBLIC INTEREST STATEMENT
The financial sector significantly promotes economic growth by directing, mobilizing, and aggregating domestic savings and deposits into productive capital. The creation of liquidity is critical as it ensures the stability and proper functioning of the financial system and achieves desirable macroeconomic outcomes and sustained economic development. Diversifying income sources is paramount for banks to withstand market volatility and financial shocks and maximize profits. Additionally, maintaining adequate capital levels is essential for banks to endure losses and shocks to their balance sheets, especially during unfavourable economic conditions. Despite the introduction of various regulations and guidelines by regulators in the financial market, the empirical literature on the effect of income diversification and capital adequacy on bank liquidity creation in developing economies remains scarce. This study fills this gap by exploring the connection between these variables in Kenya, a developing country. The study’s findings reveal significant effects of income diversification and capital adequacy on the liquidity creation of Kenyan commercial banks. Therefore, policymakers should implement appropriate measures to enhance liquidity creation.
1. Introduction
Liquidity creation is a critical function of banks. According to the modern theory of financial intermediation, banks play two significant economic roles, namely, creating liquidity and transforming risks (Berger & Sedunov, Citation2017). Liquidity creation is fundamental for a well-functioning and stable financial system, macroeconomic outcomes, and economic growth, as posited by Davydov et al. (Citation2021). Banks use two ways to create liquidity. First, banks create liquidity on their balance sheet by using relatively liquid liabilities, such as demand deposits, to finance relatively illiquid assets, such as long-term loans (El-Chaarani et al., Citation2023). Secondly, they create liquidity from off-balance sheets, which offer loan commitments and liquid funds claims, such as standby letters of credit (Berger & Bouwman, Citation2009). Although the role of banks in liquidity creation is critical, empirical investigation of liquidity creation has only become prevalent recently following the development of a novel metric by Berger and Bouwman (Citation2009). Furthermore, income diversification is crucial in the banking sector, as it strengthens the banking foundation, making liquidity creation more robust, as highlighted by Toh et al. (Citation2020). Additionally, as Alshammari (Citation2021) emphasized, capital ratios are a critical determinant of liquidity creation in banks. Nonetheless, there is still a need to explore empirical evidence on emerging frontier economies, such as Kenya. Therefore, this study seeks to offer empirical evidence on the effects of income diversification and capital adequacy on the liquidity creation of commercial banks in Kenya.
The importance of diversification in banks is well documented in the literature. The creation of liquidity is inevitably affected by income diversification. This allows banks to obtain advantages from increased income streams, economies of scale, counteracting volatility, and reduced insolvency risks (Sinha & Grover, Citation2021a). Banks that emphasize traditional banking activities generate higher liquidity creation than those that prioritize non-traditional banking activities. This is because traditional banking adheres to the relationship-oriented model, which links core deposits (highest value-added liabilities) to relationship loans (Hoang et al., Citation2020). A high level of income diversification within a bank may go hand in hand with a high liquidity creation level, indicating a positive correlation between liquidity creation and income diversity. Conversely, non-traditional activities, such as securities brokerage and underwriting, are unrelated to the bank’s fundamental intermediation function. Thus, transitioning to more of these activities may decrease liquidity creation (Hoang et al., Citation2020; Hou et al., Citation2018).
Capital is another critical bank-specific factor that influences liquidity creation. It functions as a buffer against adverse situations and potential losses. According to Mohanty and Mahakud (Citation2021), capital is essential in supporting various banks’ activities. Capital adequacy measures a bank’s internal power and strength to withstand adverse shocks during a crisis. Two conflicting hypotheses demonstrate the linkage that exists between capital adequacy and the creation of liquidity. The first hypothesis, known as the “risk absorption” hypothesis, suggests that the risk-absorbing capability of a bank is improved by a high level of capital, thereby enabling the bank to generate more liquidity. Consequently, a positive correlation emerges between bank capital and liquidity creation. Capital buffers are essential since the liquidity creation process exposes banks to risks. As liquidity created to total assets increases, the severity and likelihood of incurring losses also increase. Banks must liquidate illiquid assets to meet customers’ liquidity demands (Mohanty & Mahakud, Citation2021).
The second hypothesis, the financial fragility-crowding out hypothesis, predicts a negative correlation between capital and liquidity creation. According to Berger and Bouwman (Citation2009), this hypothesis posits that a bank’s capital leads to a less fragile capital structure, which impedes liquidity. For this reason, banks are encouraged to monitor borrowers closely, allowing them to extend loans. Adding equity capital makes it challenging for the less fragile banks to conduct monitoring and commit themselves, impeding their liquidity creation ability. Additionally, capital may impact liquidity creation negatively as it “crowds out” deposits (Sahyouni & Wang, Citation2022). The “financial fragility-crowding out” and “risk absorption” hypotheses are applied differently to each bank’s liquidity creation. Thus, the circumstances under which each scenario dominates must be determined empirically.
Global liquidity has been observed to be more unstable in developing countries than developed nations, as noted by D’avino et al. (Citation2022). In Kenya, a developing country, significant growth has been observed in its banking sector, with increased capital reserves and a focus on innovation and value addition. Nonetheless, the sector is challenged by factors such as information asymmetry, high transaction costs due to interest rate fluctuations, exchange rate variations, changing regulations, and low liquidity levels that constrain banks’ credit creation abilities (Cheruiyot Bett & Nasieku, Citation2022). Despite the rise in minimum deposits, many Kenyan banks struggle to optimize their profits due to reduced liquidity creation capacity.
Past studies have investigated the impact of banks’ income diversification on liquidity creation in developed economies (see, for instance, Dang, Citation2020; Hoang et al., Citation2020; Hou et al., Citation2018; Sinha & Grover, Citation2021a). Similarly, other studies have examined the connection between capital adequacy and the creation of liquidity in developed nations (see, for example, Casu et al., Citation2019; Chaabouni et al., Citation2018; Distinguin et al., Citation2013; Evans & Haq, Citation2021; Fu et al., Citation2016). However, these studies on developed economies may not apply to developing countries because of cultural and regulatory differences. However, to our knowledge, limited studies on capital adequacy, income diversification, and liquidity creation have been done in developing economies (see Hoang et al., Citation2020; T. Le, Citation2019; Toh et al., Citation2020). In Kenya, a number of studies have been conducted on the relationship between diversification, capital and other aspects of commercial banks, such as financial performance, financial stability, financial distress, working capital, and operating efficiency, but not on liquidity creation (see, for instance, Githaiga & Yegon, Citation2019; Hassan, Citation2017; Karugu et al., Citation2018; Kirimi et al., Citation2022; Musyoka, Citation2017; Nyabaga & Matanda, Citation2020; Nyaboke Nyanyuki et al., Citation2022; Tanui & Serebemuom, Citation2021). This study contributes to the literature by filling this gap as it is the first to provide a comprehensive analysis of the effect of income diversification and capital adequacy on liquidity creation in the context of the Kenyan banking system.
The study also makes a significant contribution as it covers 20 years (2001–2020), a period of significant regulatory changes in the banking sector. Among the significant regulatory changes are; the introduction of a risk-based supervision framework, continued enhancement of capital adequacy, agent banking, and introduction & subsequent removal of the interest rate cap. The paper contributes to the literature by evaluating the influence of capital adequacy, in the enhancement period, on one of the critical roles of banks, liquidity creation. Additionally, income diversification has taken a central place within the period, especially in the period of interest rate caps. The paper also makes a significant contribution by suggesting the most effective measures of income diversification and capital adequacy of commercial banks in Kenya. The findings of this study can be generalized to provide insights into policy debates in emerging economies with similar institutional characteristics. The study is significant as it guides managers and other stakeholders, especially in similar emerging economies, regarding measures that can be taken to increase commercial banks’ liquidity creation through capital requirements and diversification.
Consequently, this paper presents a structured approach, with Section 2 providing a literature review and hypothesis development. The data and methodology is employed in section 3. The empirical findings and discussions are presented in Section 4. Section 5 presents the conclusion and policy implications, while Section 6 outlines areas for further studies.
2. Literature review and hypotheses development
There is mixed empirical evidence on the effect of income diversification on liquidity creation. For instance, Toh et al. (Citation2020) researched banks in Malaysia from 2001 to 2017 and discovered that income diversification positively impacted bank liquidity creation. The study revealed that banks’ income diversification functioned as a buffer, ensuring liquidity creation in the face of competition and thus increasing the banks’ resilience against various compressions. However, when considering diversification within non-traditional banking activities, Hou et al. (Citation2018) found a positive correlation between diversification and liquidity creation in China. Additionally, studies have focused on other aspects of diversification, such as its ability to maximize profit, achieve economies of scale, counter volatility, and reduce insolvency risks (Meslier et al., Citation2014). According to the portfolio theory, income diversification in banks is efficient and beneficial, as it reduces idiosyncratic and overall risks (Qu, Citation2019). Commercial banks’ income diversification also improves the risk-return frontier by expanding the investment opportunity set (Hou et al., Citation2018). The modern portfolio theory indicates that banks that engage in various sources of income reduce income volatility, thereby increasing financial performance over the long term. Furthermore, according to Casu et al. (Citation2019), benefits such as reduced risks in the banking sector strengthen the banks’ foundation, thereby enhancing the liquidity creation function.
In addition to the direct connection between income diversification and liquidity creation, an inverse relationship has been uncovered in various studies. For instance, Dang’s (Citation2020) investigation of commercial banks in Vietnam between 2007 and 2018 discovered that diversification into non-traditional banking activities reduced liquidity creation. Similar outcomes were observed for Vietnamese commercial banks from 2007–2017 by Hoang et al. (Citation2020). Furthermore, Tran (Hoang et al., Citation2020) and Sinha and Grover (Citation2021b) recorded analogous negative relationships between income diversification and the creation of liquidity for large US-holding banks and Indian banks, respectively. Dang (Citation2022) also established that Vietnamese commercial banks’ income diversification increases uncertainties and decreases liquidity creation. Therefore, based on the modern portfolio theory’s viewpoint and argument that income diversification decreases income volatility and insolvency risks, which fortifies the banking foundation and enhances liquidity creation, we hypothesized that;
H01:
Income diversification significantly positively affects the liquidity creation of commercial banks in Kenya.
Although empirical literature on bank capital and its influence on different aspects of banks is vast, dating many decades, evaluation of its effect on liquidity creation is a recent phenomenon. The limited empirical evidence on the effect of capital on liquidity creation is mixed. The risk absorption hypothesis states that a high capital level increases the risk-absorbing capability of a bank, which increases the ability to create liquidity. Capital buffers are essential since the liquidity creation process exposes banks to risks. Most studies have found that capital positively affects banks’ liquidity creation, affirming the “risk absorption” hypothesis. In a study of US commercial banks, Tran et al. (Citation2016) found a positive bidirectional relationship between liquidity creation and regulatory capital. Similarly, in a study of 14 economies in the Asia Pacific region from 2005–2012, Mohanty and Mahakud (Citation2021) found that capital positively influences liquidity creation. More studies have found a positive correlation between capital and liquidity creation (see, for example, Evans & Haq, Citation2021; T. Le, Citation2019; Zelenyuk et al., Citation2021).
Other studies have discovered a negative relationship between capital and liquidity creation, contradicting the risk absorption hypothesis, thus affirming the financial fragility-crowding out hypothesis, which asserts that capital negatively affects liquidity creation. For example, Horváth et al. (Citation2014) found that capital negatively affects liquidity creation in a study involving the Czech Republic banks. Further, a study by T. Le (Citation2019) in Vietnam from 2007 to 2015 found a negative bidirectional relationship between capital and liquidity creation. Many other studies have reported that capital negatively affects liquidity creation (see Casu et al., Citation2019; Fu et al., Citation2016; Sahyouni & Wang, Citation2022; Xie, Citation2016). The literature review reveals a two-way relationship between capital and liquidity creation. This relationship varies across countries, periods, bank types, and methods. Most capital and liquidity creation studies have been conducted in developed countries (see, for instance, Casu et al., Citation2019; Fu et al., Citation2016; Fungáčová et al., Citation2017; Xie, Citation2016). Given the risk absorption hypothesis, which states that capital and liquidity creation have a positive relationship, we hypothesized that:
H02:
Capital adequacy significantly positively affects the liquidity creation of commercial banks in Kenya.
Despite the extensive recent literature, studies on capital adequacy, income diversification, and liquidity creation in developing economies remain scanty (see, for instance, Hoang et al., Citation2020; T. Le, Citation2019; Toh et al., Citation2020). In Kenya, studies have examined the relationship between diversification and other aspects of commercial banks. Several studies have investigated the relationship between different aspects of diversification and the financial performance of Kenyan commercial banks (see, for instance, Ndungu & Muturi, 2019; Githaiga & Yegon, Citation2019; Hassan, Citation2017; Mulwa & Kosgei, Citation2016; Tanui & Serebemuom, Citation2021). Similarly, other studies in Kenya have investigated the relationship between capital adequacy and various factors related to banks, except for liquidity creation. For example, studies have focused on the relationship between capital adequacy and factors such as operating efficiency, financial stability performance, financial distress, and working capital but have not explored liquidity creation (see, for example, Karugu et al., Citation2018; Kirimi et al., Citation2022; Musyoka, Citation2017; Nyabaga & Matanda, Citation2020; Nyaboke Nyanyuki et al., Citation2022; Nyaundi, Citation2015). Thus, to our knowledge, no study has examined the effect of capital adequacy and income diversification on the liquidity creation of Kenyan commercial banks. Unlike previous studies that concentrated on the relationship between diversification and capital adequacy with other aspects, this study focused on the relationship between capital adequacy, income diversification, and liquidity creation. The study aimed to address this literature gap through this approach by providing empirical evidence from a developing economy such as Kenya.
3. Data and methodology
3.1. Data
A panel dataset of all the commercial banks operating within Kenya from 2001 to 2020 was used. Commercial banks published financial reports, and the Central Bank of Kenya (CBK) was used as the primary data source of this study. The number of Kenyan commercial banks as of December 2020 totalled 42. The data collected underwent cleaning to eliminate outliers and short panels. Due to insufficient data, six commercial banks were excluded, thus reducing the sample size to 36 commercial banks as shown in the Appendix. This procedure resulted in an unbalanced panel dataset which was employed for analysis.
3.2. Empirical model
The paper used the System Generalized Method of Moments (SYS GMM). For system GMM, the panels should be integrated of order zero. Stationarity test results were used to see whether the study variables were effective for this model. Generally, GMM is essential as it solves the problem of potential biases, which sometimes arise due to simultaneity and causations. A series of steps were carried out before arriving at this conclusion of using the SYS GMM. First, the model was presented as shown in EquationEquation 1.(1)
(1)
and
are the current and previous years’ liquidity created by commercial banks.
and
represent the independent variables (income diversification and capital adequacy) and control variables (Bank size, profitability, asset risk, and GDP).
,
, and
represent unobserved bank-specific effects, temporal dummy, and the error term, respectively. The temporal dummy was responsible for the specific effect of time.
,
,
represents the autoregressive coefficient, period, and individual bank, respectively
First, Equationequation (1)(1)
(1) may be estimated by the Ordinary Least Square method (OLS). This is important as it helps evaluate the effects of income diversification and capital adequacy on the liquidity created by Kenyan commercial banks. Unfortunately, this method is inefficient since it generally does not consider the unobservable bank-specific effects (
). These specific effects lead to endogeneity problems for the regressors, and to curb these, GMM estimators were considered. Because they control the correlation between the error term and the independent variables, these estimators are more efficient than OLS estimators. The GMM estimator, the Arellano Bond (AB) estimator, contains both the levels and first difference equations. The regressors (independent and control variables) were put together, and Equationequation (1)
(1)
(1) was transformed into Equationequation (2)
(2)
(2) , as shown.
Where represented all the regressors. This equation correlates the bank-specific effects (
) with
(lagged dependent variable). Due to this reason, the fixed effects estimator within the model becomes inconsistent. To solve this problem, the first difference equation, advocated by Arellano and Bond (Citation1991), was used to do away with the bank-specific effects, as shown in Equationequation (3)
(3)
(3) .
In Equationequation (3)(3)
(3) , the lagged dependent variable
is linked to the error term
, leading to endogeneity bias. Due to this problem, we first considered using a different GMM (DIF GMM) by Arellano and Bond (Citation1991). However, we found that this method was not also efficient. According to Blundell and Bond (Citation1998), DIF GMM estimators suffer from weak instrumentation as data gets more persistent. Due to this reason, they recommended the system GMM (SYS GMM) estimators since their instruments are usually good predictors of the variables even after the series gets persistent. This paper, therefore, used SYS GMM since it is efficient and helps solve the problem of weak instrumentation.
3.3. Measurement of study variables
3.3.1. liquidity created
Berger and Bouwman’s (Citation2009) approach was employed to quantify liquidity creation by commercial banks. To strengthen the reliability of the results, both the “cat fat” (CFM) and “cat nonfat” (CNFM) liquidity creation measures were utilized. CFM, the broad measure of liquidity creation, encompasses off and on-balance sheet items. In contrast, CNFM is a liquidity creation narrow measure since it lacks off-balance-sheet assets. To calculate the created liquidity, equity, assets, and liabilities were considered, and weights were assigned to each. Liabilities and assets were classified as illiquid or liquid, whereas shareholder equity/surplus was classified as illiquid alone. CNFM and CFM are represented by Equationequations (4)(4)
(4) and (Equation5
(5)
(5) ).
Liquid, illiquid, and off-balance sheet items are denoted by L, I, and OBS, respectively. To analyze these items, a weighted scale was assigned to LA and IL at −0.5, IA and LL at 0.5, and −0.5 was allocated to the Isurplus. Semi-liquid liabilities and assets were assigned a weight of 0. Negative and positive values denote de-creation and liquidity creation, respectively. Table provides a comprehensive overview of the various items that were categorized as such.
Table 1. Bank activities classification
3.3.2. Income diversification
Income diversification (ID) was measured using the Herfindahl Hirschman Index (HHI), the commonly used standard measure. The HHI index is considered an efficient measure as it provides equal exposure of all sources of income while also allowing for the breakdown of income into non-interest (NONII) and net interest income (NII). The HHI index ranges from 0 to 1, where higher values indicate a concentration on one income source, and lower values indicate a well-diversified approach focusing on non-interest and net-interest income. The HHI index is expressed mathematically, as in Equationequation (6)(6)
(6) .
The adoption of the entropy index (EI) was also employed in the study to enhance the robustness of the outcomes. As per the research conducted by Jiang and Han (Citation2018), a combination of entropy and the HHI index displays a threshold effect, leading to a more efficient study that is crucial for the sustainable growth of banks. The Entropy index was expressed as shown by Equationequation (7)(7)
(7)
NONII and NII represent the non-interest and net interest incomes, respectively. Based on the findings of Jiang and Han (Citation2018), both the HHI and EI reach their maximum value when the NII share is equivalent to that of NONII.
3.3.3. Capital adequacy
This research employed capital adequacy to quantify the banks’ potential to absorb risks, mainly in adverse situations. The two indices used in the analysis were the capital adequacy ratio (CAR) and tier 1 leverage ratio (TLR), which increased the results’ robustness. The computation of CAR and TLR was presented as shown in Equationequations (8)(8)
(8) and (Equation9
(9)
(9) ), respectively.
When the values of TLR and CAR are high, banks can endure various shocks and withstand the imbalances in their balance sheets, primarily during adverse situations. A high value of CAR and TLR indicates that the banks possess a greater risk-absorbing capacity.
3.3.4. Control variables
The study employed different control variables to address macroeconomic and other banks’ specific effects. These variables encompass credit risk (CR), bank size (BS), the growth rate of gross domestic product (GDP), and profitability (P). The annual growth rate of the real GDP was used to measure GDP growth, which incorporates all inflationary adjustments and, thus, helps manage the macroeconomic effects. Return on assets (ROA), as shown in Equationequation (10)(10)
(10) , was used to measure profitability indicating the bank’s performance.
Total assets measured the size of the bank as shown in Equationequation (11)(11)
(11)
CR was measured as shown in Equationequation (12)(12)
(12)
RWA and OBS represented the risk-weighted and off-balance sheet assets, respectively.
The definitions of study variables and their measurements are well summarized in Table .
Table 2. Measurement of study variables
4. Empirical findings and discussions
4.1. Descriptive statistics
As illustrated by Table , the measured variables led to the data collection in its raw form, which was subsequently used to generate summary statistics. Table shows the summary statistics of the study. In Kenya, the ratio of liquidity created to total assets by commercial banks was 0.469 on average when the OBS items were included and 0.383 when excluded. This finding indicates that banks create more liquidity when they have off-balance sheet assets. According to the broad measure (CFM), the highest ratio of liquidity created to total assets was 1.491, while the lowest was −0.347. Conversely, the narrow measure (CNFM) suggests that the lowest ratio of liquidity created to total assets within the research period was −0.358, while the highest was 1.49.
Table 3. Descriptive statistics of the study variables
Additionally, the CNFM’s narrow measure exhibited a lesser standard deviation of 0.177 compared to the 0.194 of CFM’s broad measure. This finding implies that the absence of OBS assets resulted in a decrease in the diversity of commercial banks. As posited by Andrade, the standard deviation in descriptive statistics holds significance because it denotes the extent to which values deviate from the mean. Consequently, this aids readers in forming a comprehensive understanding of the sample. As presented in Table , the standard deviations of all the variables were low, meaning that most data of the study variables were concentrated and clustered around the mean.
The average HHI and EI were 0.259 and 0.062, respectively. The low levels of HHI and EI suggest that Kenyan commercial banks were well diversified, as they relied on non-interest and net interest income in conducting their operations. The TLR and CAR were 0.138 and 0.237, respectively. As all banks must have a TLR and CAR of at least 0.06 and 0.08 (6% and 8%), the Kenyan commercial banks performed relatively well. The average measure of bank size (log of total assets) was 4.316. The averages of the other three control variables, namely credit risk, profitability (ROA), and real GDP, were 0.008, 0.013, and 0.047 (4.7%), respectively.
Moreover, a histogram normality test was carried out to see if the residuals had a normal distribution. The histogram was bell-shaped, indicating that the data was normally distributed. The Jarque-Bera test was also carried out to confirm the normality of the residuals. According to Jarque and Bera (Citation1980), the Jarque-Bera statistic should be insignificant. The test results indicated that the Jarque-Bera statistic was 5.183 with a probability of 0.0749, which was insignificant at the 5% significance level. This result suggested that the data residuals followed a normal distribution.
4.2. Study variables trends
The study generated trends in study variables from 2001 to 2020. Upon examining Figure , it is apparent that Kenyan commercial banks experienced an unstable liquidity creation trend. The two measures revealed that the liquidity created to total assets reached its lowest in 2020. The COVID-19 pandemic, which significantly affected global economic activities, can contribute to this phenomenon. The CFM and CNFM data revealed that liquidity creation peaked in 2008 during the study period. This suggests that the banks were equally affected by the 2008/2009 global financial crisis. However, the creation of liquidity began declining in 2015 and continued until 2020. This may have been due to Kenya’s interest rate cap in 2016, which constrained banks’ pricing policies, thereby reducing private-sector lending.
Figure 1. The trends of study variables.
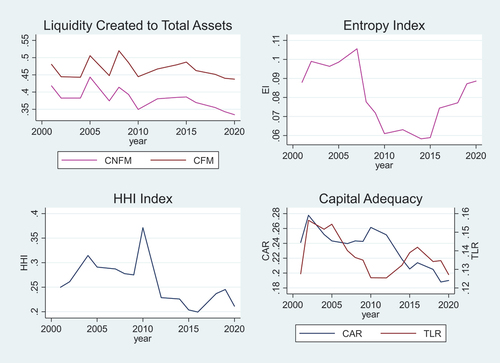
Figure also revealed that the HHI index for income diversification increased between 2000 and 2010, indicating that commercial banks in Kenya were less diversified. However, from 2010 to 2020, the HHI index value decreased gradually, signifying a focus on net-interest and non-interest income. This is evidence of gradual diversification. The Entropy Index exhibited similar behaviour, indicating that Kenyan commercial banks have increasingly diversified recently. Conversely, the TLR and CAR illustrated a decreasing trend from 2002, which could be attributed to the regulator’s continuous revision of capital requirements.
4.3. Stationarity test
The Fisher-type test was used to check if the study variables were integrated of order zero (stationary at level). This is important in a System GMM model, where the panels should not exhibit a unit root but should be integrated of order zero. The test’s null hypothesis () was that all panels contained unit roots, and a significance level of 5% was employed. The decision rule was to reject if the p-values obtained from the z (t) tests were less than 0.05. The outcomes of the Fisher-type stationarity test are presented in Table .
Table 4. Fisher type and im-pesaran-shin unit root tests
The Im-Pesaran-Shin test was also conducted to determine if the study variables were stationary at level. The test’s null hypothesis () at a 5% significance level was that all panels contained unit roots, and the decision rule was to reject if the critical values derived from the IPS T-bar statistics were less than 0.05. The results of the Im-Pesaran-Shin stationarity test can be found in Table .
Table shows that bank size had unit root at level but became stationary at first difference. On the other hand, CFM, CNFM, HHI, EI, TLR, CAR, Credit risk (CR), ROA, and GDP were stationary at level. The estimation used I (0) variables with the first 1(1) variable difference.
4.4. Multicollinearity test/correlation analysis
When running a regression model, multicollinearity must be avoided as it increases the likelihood of acquiring inconclusive and erroneous regression outcomes. The imprecise results pose a challenge in explaining and comprehending the model. Consequently, a correlation examination was imperative to reveal the correlation coefficients and measure the linear association between the study variables. The correlation analysis outcomes are presented in Table . An absolute correlation coefficient value beyond 0.7 indicates a high correlation (multicollinearity).
Table 5. Pairwise correlation matrix
The data presented in Table shows that most of the study variables’ correlation coefficients were below 0.75 at a 5% significance level. This indicates the absence of multicollinearity in the data being analyzed. However, it was observed that the variables CFM and CNFM exhibited a high correlation, as indicated by their high correlation coefficient of 0.903. Similarly, TLR and CAR also displayed a high correlation, with a correlation coefficient of 0.776. To address this issue, we opted not to include these variables simultaneously in the regression analysis.
4.5. Regression analysis results and discussion
Table presents the outcomes of a two-step system GMM regression. The results reveal that the coefficients of the lagged dependent were positively and significantly related at a 5% significance level. This is in line with what was expected that holding all other factors constant, the liquidity created in the current years depended on the liquidity created in the previous years. Two measures, namely the HHI and entropy indexes, were employed to study income diversification. The results demonstrate that the Entropy index coefficient was negative and significant at a 5% significance level. A decrease in the Entropy index implies that commercial banks are well diversified, concentrating solely on non-interest and interest income sources and vice versa. Therefore, this suggests a positive relationship between income diversification and liquidity creation in Kenyan commercial banks, meaning that well-diversified banks generate more liquidity. In Kenya, commercial banks have been diversifying their businesses by introducing new services such as agency banking, mobile banking, faceless banking, bank assurance, integrating microfinance, and other financial non-interest earning activities such as financial guarantees and derivative arrangements (Ndungu & Muturi, 2019). This indicates that income diversification in Kenya mitigates the system and insolvency risks facing commercial banks, thus increasing liquidity creation. The results are consistent with those of Toh et al. (Citation2020) and Meslier et al. (Citation2014) but contradict the work of Dang (Citation2020), Hoang et al. (Citation2020), Sinha and Grover (Citation2021b) and Dang (Citation2022) who found that income diversification negatively affects liquidity creation. Therefore, the hypothesis that a positive relationship exists between income diversification and liquidity creation of commercial banks in Kenya is thus accepted. The HHI index was insignificant for both the broad and narrow measures.
Table 6. Two-step system GMM regression results
The study also found that, at a 5% significance level, both the Capital Adequacy Ratio (CAR) and Tier 1 Leverage Ratio (TLR) negatively and significantly impacted the creation of liquidity by commercial banks in Kenya. This implies that liquidity creation decreased as the capital adequacy of Kenya’s commercial banks increased. In other words, it indicates that the liquidity creation of commercial banks decreased as the internal strength of dealing with adverse conditions decreased. This finding is consistent with some studies but contradicts others. For instance, the study confirms the work of Xie (Citation2016), Distinguin et al. (Citation2013), Casu et al. (Citation2019), Fu et al. (Citation2016), and Berger and Bouwman (Citation2009) while Tran et al. (Citation2016), Mohanty and Mahakud (Citation2021), Evans and Haq (Citation2021), Zelenyuk et al. (Citation2021) and T. Le (Citation2019) found a positive relationship between capital adequacy and liquidity creation. The finding also supports the financial fragility crowding-out hypothesis, which states that a bank’s capital leads to a less fragile capital structure, which impedes liquidity creation. Therefore, the hypothesis that a positive relationship exists between capital adequacy and liquidity creation of commercial banks in Kenya is thus rejected. This implies that the risk absorption hypothesis does not apply to the Kenyan banking system.
The study’s results in Table indicate that the log of total assets and return on assets (ROA) employed to measure bank size and profitability were insignificant. This suggests that the profitability and total assets of commercial banks in Kenya have no significant impact on liquidity creation. Interestingly, the credit risk coefficients exhibited consistency and were significant at a 5% significance level, indicating a negative correlation between credit risk and liquidity creation of Kenyan commercial banks. These findings corroborate the conclusions reached by Chaabouni et al. (Citation2018), T. D. Q. Le and Pham (Citation2021), and Sahyouni and Wang (Citation2019). Thus, this relationship suggested that the liquidity created to the total assets of Kenyan commercial banks decreases due to losses stemming from borrowers’ failure to repay loans and fulfil certain obligations.
4.6. Robustness
First, the robustness of the study was enhanced by using two measurements for each of the main study variables, namely income diversification, capital adequacy, and liquidity creation. The HHI and entropy index assessed income diversification, while CAR and TLR were employed to measure capital adequacy. Additionally, broad and narrow measures were utilized to evaluate the commercial banks’ liquidity creation.
Secondly, the study conducted various robustness checks to guarantee the results’ reliability. The tests conducted included serial correlation/autocorrelation and instrumental validity tests. The Arellano Bond test (AR) was employed to test for serial correlation in levels. The study concentrated on the AR (2) test as it efficiently examines the autocorrelation in levels. At a significance level of 5%, the null hypothesis (HO) for AR (2) test was that no autocorrelation existed in levels. The HO would be rejected if the p-values were < 0.05. Table depicts that the AR (2) values were all > 0.05. Therefore, the HO was not rejected, meaning no autocorrelation existed in levels.
Furthermore, Sargan and Hansen’s J test was conducted to examine instrumental validity. This test was essential for the over-identification of various restrictions. At a 5% significance level, the null hypothesis was that the instruments used were well justified (exogenous). The HO would be rejected if the Hansen statistic values of the test were less than 0.05. Table shows that the Hansen statistic p values were greater than 0.05. Therefore, the null hypothesis was accepted that the instruments used were exogenous. This test, therefore, justified the instrument selection of this study.
5. Conclusion and policy implications
This study investigates the impact of income diversification and capital adequacy on the liquidity creation of commercial banks in Kenya. The results indicate that income diversification has a positive and significant effect on liquidity creation, demonstrating that well-diversified banks exhibit high levels of liquidity creation. Furthermore, the study establishes a significant negative relationship between capital adequacy and liquidity creation, indicating that a high level of capital may restrict lending capacity, ultimately hindering the ability of banks to create liquidity and impeding economic growth and development. These findings suggest that Kenyan commercial banks should focus on both interest and non-interest sources of income. Bank managers should prioritize income diversification to create new revenue streams that can aid in buffering and maximizing profits. Income diversification is crucial as it enables banks to withstand market volatility and financial shocks. Therefore commercial banks should adopt income diversification strategies as a way of risk management. This is because by promoting a diversified income base, banks do not rely on a single source of income, enhancing the resilience and stability of banks’ liquidity positions.
Additionally, these findings demonstrate “financial fragility crowding out” in Kenyan commercial banks. This finding has a significant policy stance; while capital requirements are essential in alleviating financial fragility, they discourage liquidity creation, hampering business investment and household consumption. As a result of this tradeoff between capital adequacy and liquidity creation, optimal capital requirements must be established to alleviate the financial fragility of Kenyan commercial banks. Therefore, policymakers in Kenya should determine optimal capital requirements that balance the financial stability and liquidity creation of commercial banks in the country. This could entail reevaluating capital adequacy requirements, liquidity ratios, and stress testing techniques to ensure banks retain enough capital buffers while maintaining liquidity. The responsible regulatory agencies should also step up their supervision and monitoring activities. Regular evaluations of banks’ capital and liquidity positions should be conducted, and stricter oversight procedures should be put in place. Supervisory stress testing and continuous monitoring can help find weaknesses and encourage quick corrective action.
6. Limitations and future directions of the study
The current study was confined to Kenyan commercial banks. Nonetheless, it is essential to note that the financial sector involves other players. Consequently, researchers may broaden the scope of this study by scrutinizing the impact of income diversification and capital adequacy on the liquidity creation of other financial institutions within Kenya and beyond. The findings of this study revealed the existence of a tradeoff between capital requirement and liquidity creation. To this end, future research should concentrate on the optimal levels of regulatory capital necessary to act as a buffer against shocks without negatively affecting liquidity creation. This is a crucial channel through which banks contribute to the economy. The results of this study also demonstrated a positive relationship between income diversification and liquidity creation. Nonetheless, further research must focus on various income diversification strategies and their influence on the liquidity creation of commercial banks and other non-bank financial institutions in Kenya. Despite the positive outcomes of income diversification on liquidity creation by Kenyan commercial banks, future researchers should undertake a comparative analysis across neighbouring economies to establish how the outcomes differ under different banking systems.
Disclosure statement
No potential conflict of interest was reported by the author(s).
Additional information
Funding
Notes on contributors
Dennis Muchuki Kinini
Dennis Muchuki Kinini is a postgraduate student in the Department of Economics, School of Business and Economics, University of Embu. His research interests focus on macroeconomics, microeconomics, and financial economics.
Kennedy Nyabuto Ocharo
Kennedy Nyabuto Ocharo is a Senior Lecturer at the Department of Economics, University of Embu. He also holds the position of Dean of the School of Business and Economics position. He holds a Ph.D. degree in Economics from Kenyatta University in Kenya. His research interests are international, macro, micro, financial, and environmental economics.
Peter Wang’ombe Kariuki
Peter Wang’ombe Kariuki is a Senior Lecturer at the Department of Business Studies, University of Embu. He holds a PhD in Business Administration from Jomo Kenyatta University of Agriculture and Technology (JKUAT). He has specialized in Finance and Accounting. Dr. Kariuki’s research interests revolve around the critical areas of financial institutions and management, tax policies and practices, quality of financial reporting, investment management, and other related domains.
References
- Alshammari, T. (2021). The determinants of liquidity creation of conventional and Islamic banks. International Journal of Accounting and Finance, 11(1), 1–18. https://doi.org/10.1504/IJAF.2021.120602
- Arellano, M., & Bond, S. (1991). Some tests of specification for panel data: Monte Carlo evidence and an application to employment equations. The Review of Economic Studies, 58(2), 277–297. https://doi.org/10.2307/2297968
- Berger, A. N., & Bouwman, C. H. S. (2009). Bank liquidity creation. The Review of Financial Studies, 22(9), 3779–3837. https://doi.org/10.1093/rfs/hhn104
- Berger, A. N., & Sedunov, J. (2017). Bank liquidity creation and real economic output. Journal of Banking & Finance, 81, 1–19. https://doi.org/10.1016/j.jbankfin.2017.04.005
- Blundell, R., & Bond, S. (1998). Initial conditions and moment restrictions in dynamic panel data models. Journal of Econometrics, 87(1), 115–143. https://doi.org/10.1016/S0304-4076(98)00009-8
- Casu, B., DiPietro, F., & Trujillo-Ponce, A. (2019). Liquidity creation and bank capital. Journal of Financial Services Research, 56(3), 307–340. https://doi.org/10.1007/s10693-018-0304-y
- Chaabouni, M. M., Zouaoui, H., & Ellouz, N. Z. (2018). Bank capital and liquidity creation: New evidence from a quantile regression approach. Managerial Finance, 44(12), 1382–1400. https://doi.org/10.1108/MF-11-2017-0478
- Cheruiyot Bett, T., & Nasieku, T. (2022). Challenges of credit creation by commercial banks in Kenya: An empirical review. International Academic Journal of Economics and Finance |, 3(7), 254–275. https://iajournals.org/articles/iajef_v3_i7_254_275.pdf
- Dang, V. D. (2020). Do non-traditional banking activities reduce bank liquidity creation? Evidence from Vietnam. Research in International Business and Finance, 54(54), 101257. https://doi.org/10.1016/j.ribaf.2020.101257
- Dang, V. D. (2022). Bank liquidity creation under micro uncertainty: The conditioning role of income structure. Economic Modelling, 112, 105852. https://doi.org/10.1016/j.econmod.2022.105852
- D’avino, C., Girardin, E., & Shabani, M. (2022). Bank liquidity creation: A new global dataset for developing and emerging countries. Review of World Economics, 158(2), 529–570. https://doi.org/10.1007/s10290-021-00434-1
- Davydov, D., Vähämaa, S., & Yasar, S. (2021). Bank liquidity creation and systemic risk. Journal of Banking & Finance, 123, 106031. https://doi.org/10.1016/j.jbankfin.2020.106031
- Distinguin, I., Roulet, C., & Tarazi, A. (2013). Bank regulatory capital and liquidity: Evidence from US and European publicly traded banks. Journal of Banking & Finance, 37(9), 3295–3317. https://doi.org/10.1016/j.jbankfin.2013.04.027
- El-Chaarani, H., Abraham, R., & Azzi, G. (2023). The role of liquidity creation in managing the COVID-19 Banking crisis in selected Mena Countries. International Journal of Financial Studies, 11(1), 39. https://doi.org/10.3390/ijfs11010039
- Evans, J. J., & Haq, M. (2021). Does bank capital reduce liquidity creation? Global Finance Journal, 54, 100640. https://doi.org/10.1016/j.gfj.2021.100640
- Fu, X. M., Lin, Y. R., & Molyneux, P. (2016). Bank capital and liquidity creation in Asia Pacific. Economic Inquiry, 54(2), 966–993. https://doi.org/10.1111/ecin.12308
- Fungáčová, Z., Weill, L., & Zhou, M. (2017). Bank capital, liquidity creation and deposit insurance. Journal of Financial Services Research, 51(1), 97–123. https://doi.org/10.1007/s10693-016-0240-7
- Githaiga, P. N., & Yegon, J. C. (2019). Income diversification and performance: Should banks trade? Business & Social Sciences Journal, 4(2), 52–64. https://doi.org/10.520/EJC-197fa2eaf6
- Hassan, A. A. (2017). Effects of income diversification on financial performance of commercial banks listed at Nairobi security exchange by Abubakar Ahmed Hassan a research project submitted in partial fulfilment of the requirements for the award of the degree of master of B 1–48. http://hdl.handle.net/11295/102728
- Hoang, C. V., Nguyen, L. Q. T., Tran, M. D., & Hoang, T. D. (2020). The impact of income diversification on liquidity creation and financial performance of Vietnamese commercial banks. Accounting, 6(4), 553–568. https://doi.org/10.5267/j.ac.2020.4.004
- Horváth, R., Seidler, J., & Weill, L. (2014). Bank capital and liquidity creation: Granger-causality evidence. Journal of Financial Services Research, 45(3), 341–361. https://doi.org/10.1007/s10693-013-0164-4
- Hou, X., Li, S., Li, W., & Wang, Q. (2018). Bank diversification and liquidity creation: Panel Granger-causality evidence from China. Economic Modelling, 71, 87–98. https://doi.org/10.1016/j.econmod.2017.12.004
- Jarque, C. M., & Bera, A. K. (1980). Efficient tests for normality, homoscedasticity and serial independence of regression residuals. Economics Letters, 6(3), 255–259. https://doi.org/10.1016/0165-1765(80)90024-5
- Jiang, H., & Han, L. (2018). Does income diversification benefit the sustainable development of Chinese listed banks? Analysis based on entropy and the Herfindahl–Hirschman index. Entropy, 20(4), 255. https://doi.org/10.3390/e20040255
- Karugu, C., Achoki, G., & Kiriri, P. (2018). Capital adequacy ratios as predictors of financial distress in Kenyan commercial banks. Journal of Financial Risk Management, 7(3), 278. https://doi.org/10.4236/jfrm.2018.73018
- Kirimi, P. N., Kariuki, S. N., & Ocharo, K. N. (2022). Financial soundness and performance: Evidence from commercial banks in Kenya. African Journal of Economic and Management Studies, 13(4), 651–667. https://doi.org/10.1108/AJEMS-11-2021-0499
- Le, T. (2019). The interrelationship between liquidity creation and bank capital in Vietnamese banking. Managerial Finance, 45(2), 331–347. https://doi.org/10.1108/MF-09-2017-0337
- Le, T. D. Q., & Pham, X. T. T. (2021). The inter-relationships among liquidity creation, bank capital and credit risk: Evidence from emerging Asia–Pacific economies. Managerial Finance, 47(8), 1149–1167. https://doi.org/10.1108/MF-04-2020-0189
- Meslier, C., Tacneng, R., & Tarazi, A. (2014). Is bank income diversification beneficial? Evidence from an emerging economy. Journal of International Financial Markets, Institutions and Money, 31, 97–126. https://doi.org/10.1016/j.intfin.2014.03.007
- Mohanty, S., & Mahakud, J. (2021). Causal nexus between liquidity creation and Bank Capital Ratio: Evidence from India. Margin: The Journal of Applied Economic Research, 15(2), 205–237. https://doi.org/10.1177/0973801021990399
- Mulwa, J. M., & Kosgei, D. (2016). Commercial Bank diversification and financial performance: The moderating role of risk. Journal of Finance and Investment Analysis, 5(2), 1–3. https://ideas.repec.org/a/spt/fininv/v5y2016i2f5_2_3.html
- Musyoka, B. K. (2017). The effect of capital adequacy on the financial performance of commercial banks in Kenya. University of Nairobi.
- Nyabaga, R. M., & Matanda, J. W. (2020). Effect of firm characteristics on financial performance of listed commercial banks in Kenya. International Journal of Economics and Financial Issues, 10(3), 255–262. https://doi.org/10.32479/ijefi.9692
- Nyaboke Nyanyuki, M., Nyanga, A., & Onwonga, M. (2022). Evaluation of the effects of capital adequacy on financial performance of commercial banks in Kenya. International Academic Journal of Economics and Finance, 3(8), 113–126. https://iajournals.org/articles/iajef_v3_i7_113_126.pdf
- Nyaundi, D. (2015). The effects of capital adequacy requirements on liquidity of commercial banks in Kenya.
- Qu H. (2019). Risk and diversification of nonprofit revenue portfolios: Applying modern portfolio theory to nonprofit revenue management. Nonprofit Management and Leadership, 30(2), 193–212. 10.1002/nml.21385
- Sahyouni, A., & Wang, M. (2019). Liquidity creation and bank performance: Evidence from MENA. International Journal of Islamic Finance, 11(1), 27–45. https://doi.org/10.1108/IJIF-01-2018-0009
- Sahyouni, A., & Wang, M. (2022). Bank capital and liquidity creation: Evidence from Islamic and conventional MENA banks. Afro-Asian Journal of Finance and Accounting, 12(3), 291–311. https://doi.org/10.1504/AAJFA.2022.124247
- Sinha, P., & Grover, N. (2021a). Interrelationship among competition, Diversification and liquidity creation: Evidence from Indian Banks. Margin: The Journal of Applied Economic Research, 15(2), 183–204. https://doi.org/10.1177/0973801021990398/
- Sinha, P., & Grover, N. (2021b). Interrelationship among competition, diversification and liquidity creation: Evidence from Indian Banks. Margin: The Journal of Applied Economic Research, 15(2), 183–204. https://doi.org/10.1177/0973801021990398
- Tanui, P. J., & Serebemuom, B. M. (2021). Corporate diversification and financial performance of listed firms in Kenya: Does firm size matter? Journal of Advanced Research in Economics and Administrative Sciences, 2(2), 65–77. https://doi.org/10.47631/jareas.v2i2.235
- Toh, M. Y., Gan, C., & Li, Z. (2020). Bank diversification, competition and liquidity creation: Evidence from Malaysian banks. The Singapore Economic Review, 65(4), 1127–1156. https://doi.org/10.1142/S0217590819500103
- Tran, V. T., Lin, C.-T., & Nguyen, H. (2016). Liquidity creation, regulatory capital, and bank profitability. International Review of Financial Analysis, 48, 98–109. https://doi.org/10.1016/j.irfa.2016.09.010
- Xie, W. (2016). The empirical study on the relationship between Bank liquidity creation and capital—based on empirical data from 2004 to 2014 in Chinese Banks. Modern Economy, 07(4), 426–433. https://doi.org/10.4236/me.2016.74047
- Zelenyuk, N., Faff, R., & Pathan, S. (2021). The impact of voluntary capital adequacy disclosure on bank lending and liquidity creation. Accounting & Finance, 61(3), 3915–3935. https://doi.org/10.1111/acfi.12720