
Abstract
The purpose of this study is to validate the Value-based Adoption Model (VAM) in order to investigate young Malaysians’ e-wallet adoption intentions. A structured questionnaire was used to collect 214 questionnaires. The hypotheses proposed for this study were tested using SmartPLS, a second-generation analysis of partial least squares (PLS). Perceived sacrifice and perceived benefit influenced perceived value (PV). The results have shown that perceived benefit has a higher significance compared to perceived sacrifice on PV. Innovative resistance and privacy risk were found to have a negative impact on perceived value. Market practitioners can utilize this model to create secure, convenient and user-friendly e-wallets, resulting in effective marketing strategies that increase e-wallet adoption intentions among the young Malaysians.
JEL classification:
1. Introduction
Due to the convenience and simplicity of mobile phones, it is diversifying their function as an e-wallet in this modern era of technological advancement. Previous researchers (Molina-Castillo et al., Citation2008) mentioned that mobile phones provide value-added benefits besides traditional communication such as payment, banking and parking services. Besides that, Palau-Saumell et al. (Citation2019) stated that mobile phone usage is expanding significantly and is expected to reach 2.87 billion in 2020. According to previous research, mobile phone usage is increasing rapidly because of the rising mobility of modern society (Park et al., Citation2018; Schierz et al., Citation2010).
Back in the former times, due to safety and security reasons, the public would characterize a cashless world as inadmissible. Wulandari et al. (Citation2016) expressed that the advancement and improvement from years and years prior structures the current financial system today. Nonetheless, in the current period of sped up innovative movement, Malaysia is quickly moving towards a cashless society and e-wallet services are fabricating quickly on a worldwide scale. Ramayah et al. (Citation2017) stated that numerous financial services and giant organizations are empowering the public to advance towards a cash-free civilization.
1.1. Malaysia in context
As one of the nine (9) focus areas under the Malaysia Blueprint in driving the country’s transition to a financially stable high-income economy, Malaysia is migrating towards electronic payment, and this has been the aspiration of the Malaysia Central Bank (Bank Negara Malaysia) in accelerating this national agenda by increase the efficiency of the country’s payment system (Bank Negara Malaysia, Citation2023). As the country propelled in achieving digital first in finance, the Malaysia government has been keen in promoting e-wallet adoption by introducing the ePenjana and e-Tunai Rakyat Programme in 2020, whereby the government has granted RM1.2 billion to stimulate the market and encourage digital adoptions (Business Today, Citation2022). In strengthening this movement, the government further announced the RM200 ePemula e-wallet programme in the Budget 2023, in which a total of 2 million youths will be benefited from this initiative (Malaysia Now, 2023).
Following the active moves from the government, a wide variety of e-wallet alternatives are then available in the marketplace. E-wallet providers such as Grab, Touch’ n Go e-wallet, Boost, Maybank MAE are targeting local business owners and small and medium-sized enterprises (SMEs). For example, Boost started to support some of the local Ramadhan bazaars to go cashless in 2018 (Ravindran, Citation2018). FavePay cooperated with 500 participating merchants in the Klang Valley (Leng, Citation2017). Besides that, these e-wallet service providers are offering cashbacks if the user purchases goods and services by using e-wallets in order to motivate and encourage current and potential new users.
J. Low (Citation2019) stated that despite the enormous number of services available in Malaysia, e-wallets have yet to become the preferred way of payment for Malaysians. Ganeshwaran (Citation2019) mentioned that in comparison to China, there are much more e-wallet providers in Malaysia. He stated that Malaysia has roughly 40 e-wallet providers, with a population of 32 million people, whereas China has only two e-wallet service providers, with a population of 1.5 billion people, indicating a significant disparity in the need to integrate the e-wallet ecosystem in Malaysia (Ganeshwaran, Citation2019). The Malaysia government has been working out different plans with the Ministry of Finance in order to motivate the public in adopting cashless payment. For example, the government rolled out a RM 450 million e-Tunai Rakyat program on 15 January 2020, in collaboration with the three main e-wallet operators in Malaysia which are Touch’ n Go e-wallet, GrabPay and Boost (Ministry of Finance Malaysia, Citation2020).
Therefore, it is critical to examine e-wallets in the context of Malaysia, as stated in Bank Negara Malaysia’s (BNM) Financial Sector Blueprint 2011–2020; the bank intends to reach 200 cashless transactions per capita by 2020. Malaysia’s payment systems are continually being updated and improved, demonstrating the government’s efforts to move toward a digitized economy. In Malaysia, millennials (aged 27 to 40) account for the largest percentage of e-wallet users, which is not surprising given that they, along with Gen Z, are the generation who are most familiar with digital systems (Commission Factory, Citation2023). This is consistent with the nature of how e-wallets work as this is the age category that prefers cashless transactions (H. P. Low, Citation2023). Golant (Citation2017) reported that the younger generation is more willing to accept new technology.
On 18th March 2020, the global outbreak of COVID-19 has forced Malaysia to announce a Malaysian Movement Control Order (MCO). During this period, the adoption of e-wallets in Malaysia has increased drastically (The Straits Times, Citation2020, April 27). Throughout the pandemic, the Malaysian government implemented many pandemic-related incentives; one of them was the RM50 digital initiative under the “Penjana Economic Recovery Plan” (New Straits Time, Citation2020, June 5). The Malaysians’ response to this initiative was enormous, apart from facilitating secure and contactless transactions throughout the COVID-19 pandemic period; it has also accelerated Malaysians’ use of e-wallets. The number of active e-wallet registered users has increased dramatically, rising from 8.7 million in 2020 to 13.5 million in 2021 as more people use e-wallet for e-commerce payments. In the first quarter of 2022, approximately 68% of Malaysians utilized an e-wallet to make payments (H. P. Low, Citation2023). As a result, Malaysia will soon move into a cashless society.
Recently, scholars have criticized the theoretical ground of the intention to adopt. Slade et al. (Citation2015) mentioned that Technology Acceptance Model (TAM) has been critiqued for having a conclusive approach without fully reflecting users’ individual characteristics. Most of the research for intention and adoption of technology in mobile payment systems employed TAM. TAM proposed by Davis et al. (Citation1989) was restricted in addressing adoption intention towards advanced technologies (H. W. Kim et al., Citation2007). The Value-based Adoption Model (VAM) by H. W. Kim et al. (Citation2007) was created to address TAM’s limitations in defining adoption of advanced technology. H. W. Kim et al. (Citation2007) stated only few studies explored the factors that influence the acceptance towards e-wallet in research related to technology adoption. Therefore, VAM will be empirically tested in this research to explore the adoption intention towards e-wallet in Malaysia. This study responds to the existing gap within the literature by expanding the knowledge of marketing strategy that is deemed crucial to the industry. In the proposed model for this study, the critical determinants of VAM are explicitly measured. These identified determinants are perceived sacrifice, perceived benefit and perceived value as variables. This study’s findings will help researchers better understand consumer behavior. By utilizing this framework, market participants would be able to establish solutions that are more practical for consumers, thereby increasing Malaysians’ intention to adopt e-wallet services. H. W. Kim et al. (Citation2007) stated that users have a higher tendency to incline towards behaviors that would obtain the highest payoff. Roostika (Citation2012) mentioned that value-based model established to present and capture adoption of ICT by comparing costs and benefits. He mentioned that satisfaction and quality as a source of competitive advantage is no longer sufficient. Researchers have taken perceived value as a factor that influences consumer behavior.
The objective of this study is to assess factors affecting the perceived value and adoption intention towards e-wallet in Malaysia in order to determine a more reasonable approach to adoption. This research strives to investigate the effects of perceived benefits and of perceived risk on perceived value of e-wallet; as well as to examine the relationship between perceived value and adoption intention of e-wallet.
The findings of this research are intended to shed light on certain key characteristics linked to consumer behavior intentions toward e-wallets in Malaysia that have been overlooked in past research. It thus leads to the research questions, which would address essential concern about factors influencing e-wallet adoption, as well as the link between the identified parameters and e-wallet adoption among the young Malaysians.
The results of the study contribute to a better understanding of the influence of perceived value towards consumer behavioral intention to use e-wallet. Since several articles or journals and books (Cheong et al., Citation2004; Molina-Castillo et al., Citation2008; Park et al., Citation2018; Slade et al., Citation2015) have discussed this problem in recent years, this study is one of the most important subjects, not just in Malaysia, but also around the world. Moreover, there is social media or news highlighting the future cashless system, the e-wallet movement has enhanced public awareness.
Market participants may find that this study benefits them by giving additional value and insights in developing corporate strategy. The outcome of this study will boost the organization’s (i.e. e-wallet service providers) performance and competencies while also improving the economy’s expectations. According to Fintech News Malaysia, the country presently has 53 e-wallets, with the industry accounting for 19% of the country’s fintech area (The Malaysian Reserve, Citation2022, October 21). Through the outcome of this study, e-wallet service providers ought to comprehend the factors influencing the adoption intention of the young e-wallet users in Malaysia. Organizations will find out what they should do to improve the features of e-wallet applications in order to increase consumer intention in adopting e-wallets and thus boost organization’s performance.
2. Literature review
Ghezzi et al. (Citation2010) define e-wallet as “a process in which at least one phase of the transaction is conducted using a mobile device (for instance, a smartphone) capable of securely processing a financial transaction over a mobile network, or via various wireless technologies such as Bluetooth, RFID”. Liu et al. (Citation2015) described e-wallet as an “alternative form of economic exchange”. Furthermore, several studies stated that e-wallets have a different structure than e-banking, despite the fact that other academics refer to mobile banking and mobile payments as being identical (Slade et al., Citation2015; Donner & Tellez, Citation2008). E-wallet is a procedure in which the bank, consumer and merchant were involved, whereas e-banking only involves the customer and bank.
According to H. W. Kim et al. (Citation2007), TAM proposed by Davis et al. (Citation1989) was restricted in addressing adoption intention towards advanced technologies. VAM was created to address TAM’s limitation in defining adoption of advanced technology. VAM considers sacrifice and benefits to be the most important factors in determining whether to use a product or services (H. W. Kim et al., Citation2007). VAM is simple in anticipating adoption of e-wallet, which is based on two (2) constructs: perceived benefits and sacrifice. Perceived sacrifices are categorized into two constructs, which are technicality and perceived fee, while perceived benefits categorized into enjoyment and usefulness.
2.1. Perceived Value (PV)
Y. Kim et al. (Citation2017) stated that, in addition to service quality and satisfaction, which extensively examined on how they affect consumer behavior intention, perceived value has caught the attention among researchers as a new variable. The interpretation in previous studies does not consider the multi-dimensionality aspects in decision-making and the existence of perceived sacrifice and benefits are not considered.
Apart of that Woodruff (Citation1997) also stated that different perceived values influence consumer’s behavior because consumers’ choices affected by how they match the product with their perceived preference. Consumers who believe they will get poor service value will have lower behavioral intentions than those who believe they would receive high service value.
Definition by Zeithaml (Citation1988) for perceived value is widely used in all available marketing literature which he defines as “the consumer’s overall assessment of the quality of a product or services based on the perception of what is being given and received”. A series of recent studies have indicated that, in the context of new technology, perceived value is a more essential determinant in determining actual behavioral intention than attitudes towards adopting technology (Li et al., Citation2018; Wang, Citation2014; Wang et al., Citation2020). For example, users’ behavior intentions are significantly influenced by perceived value (Li et al., Citation2018; Wang, Citation2014). The outcome from Wang et al. (Citation2020) research on Mobile Government Service showed that perceived value had a significant explanatory power on continuance intention, localizability and mobility.
Besides, Kumar and Reinartz (Citation2016) indicated that perceived value reflects the compilation of benefits that the consumer expects or seeks, as well as any unintended implications that may arise. Fernández et al. (Citation2018) mentioned that perceived value serves as the foundation of numerous organizational operations and is deemed as crucial for the success of an organization because of its large impact on brand loyalty. Perceived value of e-wallet will be investigated in this study by taking benefit and sacrifice into consideration.
2.2. Perceived sacrifice
According to Zeithaml (Citation1988), perceived sacrifice is categorized into two types, which are monetary and non-monetary. The monetary cost is the money paid to buy the product, but the non-monetary cost includes time, dissatisfaction, risk and effort, as well as the consumption or price of the product (H. W. Kim et al., Citation2007; Roostika, Citation2012). The results of Lu and Wang (Citation2020) research on behavioral intention to adopt ride-hailing services postulated that perceived sacrifice would lead to a lower or even negative evaluation of ride-hailing services. However, the relationship between perceived sacrifice and perceived value is still unclear and needs to be investigated further. Xiong and Zuo (Citation2022) studies on factors influencing the adoption of a mobile platform of medical and senior care in China tested three constructs for perceived sacrifice which are perceived service fee, privacy concerns, and legal concerns. Their results indicated that perceived service fee and legal concerns are important factors that affect users’ adoption intention. Besides, Zhong and Chen (Citation2023) research on mobile payment loyalty classified perceived sacrifice into two constructs: perceived risk and perceived cost. Perceived risk was found to be an important sacrifice element, whereas perceived cost had a weak effect, resulting in an insignificant outcome. Perceived fee and technicality was found to have significant negative effect on perceived value (E. Kim & Kyung, Citation2023; Yoon & Oh, Citation2022).
In this study, perceived sacrifice is classified into four constructs: privacy risk, monetary risk, innovation resistance, and technicality.
2.3. Privacy Risk (PR)
Products and services offered by new technologies are often embedded with potential risks. The definition for privacy risk is “the potential of loss of control over personal information” (Akturan & Tezcan, Citation2012). Thakur and Srivastava (Citation2015) interpreted privacy risk as “the possibility that online businesses might use personal information inappropriately hence invading a consumer’s privacy”. Privacy risk refers to “the possibility of personal information being exposed during the transaction” (S. Yang et al., Citation2014).
There have been numerous studies to investigate privacy risk (Balta-Ozkan et al., Citation2013; Hong et al., Citation2020; Hsu & Lin, Citation2018). Privacy issues are a major hurdle to every advanced technology products and services, and it is a basic obstruction to the widespread adoption of smart homes (Balta-Ozkan et al., Citation2013; Hong et al., Citation2020). Hsu and Lin (Citation2018) research on Internet of Things (IoT) service may expose consumers to the risk of unintentional leakage of confidential data. According to Yong et al. (Citation2021), using mobile payment services can expose users to the risk of disclosing personal information.
2.4. Monetary Risk (MR)
According to S. Yang et al. (Citation2014), monetary risk denotes the potential additional cost after the purchase price, followed by maintenance cost. A. S. Yang (Citation2009) mentioned that past studies determined the adoption towards mobile payment is highly influenced by economic factors, for example, service charges for every transaction made. Thakur and Srivastava (Citation2015) narrated that monetary risk, also known as the perception of increased expenses along with the use of a specific online channel costs more than alternative channels. Hong et al. (Citation2020) stated that the expense of purchase, setting up, and servicing is a factor that contributes to reluctance to new technology adoption. Besides, Wu and Wang (Citation2005) indicated that users must pay for actual mobile equipment costs, access costs, and transaction fees (monetary expenses) associated with the technology’s adoption in order to use mobile payment services. According to Hsu and Lin (Citation2018), monetary risks consist of the actual cost of the products, including the basic cost and additional fees for extra services.
2.5. Innovation Resistance (IR)
Oreg (Citation2006) indicated that innovative resistance refers to the negative attitude on changes brought upon by the adoption of new technology products. Ram and Sheth (Citation1989) defined innovation resistance as the possible distinction from the consumers’ status quo or on the ground that clash with their beliefs causing them to give forth-negative reactions towards an innovation. These conflicts are divided into two categories, which are functional barriers and psychological barriers. Functional barrier occurs when consumer perceived changes from adopting new technology whereas psychological barrier exists when consumers’ past belief is being challenged. Heidenreich and Handrich (Citation2015) indicated that functional barriers take place when the functional features of innovative technologies fail to reach consumers’ expectations, while psychological barriers arise when consumers’ perception of the features of innovative technology causes psychological conflict. As stated by Chung and Liang (Citation2020), psychological barriers are the primary source of innovation resistance. Customers who perceive hurdles and become resistant will look for additional information that will establish a new standard of resistance. Santos and Ponchio (Citation2021) research on digital banking service mentioned that psychological barriers develop as a result of a contradiction between consumer norms, usage patterns or social values and the qualities of the newly developed service being evaluated. Their results showed that psychological barriers positively influenced resistance to the use of digital banking services.
2.6. Technicality (TEC)
H. W. Kim et al. (Citation2007) defines technicality as “the degree to which a product or service is perceived as being technically excellent in the process of providing services”. It is indicated by the system’s dependability, perceived ease of use, efficiency, and connectivity. Constantiou et al. (Citation2002) identified that technical factor is one of the significant barriers to mobile commerce adoption. Perceived ease of use has been widely employed as a component of technicality where in this study it represents the user-friendliness of e-wallet usage (H. W. Kim et al., Citation2007). This factor is more significant to new users as compared to experienced users (Venkatesh et al., Citation2003). T. Lin et al. (Citation2012) defined technicality as “how a new technology is perceived as technically excellent in the process of providing a service and is an evaluation of ease of use, reliability, connectivity, and efficiency”. The findings of Chunxiang (Citation2014) study on mobile commerce, technicality is one of the variables that have a negative impact on perceived value.
2.7. Perceived benefit
Kahneman and Tversky (Citation1979) mentioned that the main assumption in consumer decision-making is value maximization where value indicates benefits and loss. H. W. Kim et al. (Citation2007) study on mobile internet acceptability mentioned that perceived benefit had a favorable effect on perceived value. Besides, in T. Lin et al. (Citation2012) research on Internet Protocol television intention, it showed that perceived benefit has a favorable effect on perceived value. The Cognitive Evaluation Theory classified motivations into extrinsic and intrinsic subsystems (H. W. Kim et al., Citation2007). Definition for intrinsic motivation is “the performance of an activity for no apparent reinforcement other than the process of performing the activity” while the definition for extrinsic motivation is “the performance of an activity to achieve a specific goal”. H. W. Kim et al. (Citation2007) discovered that both intrinsic and extrinsic factors influence perceived value and adoption intention. Moore and Benbasat (Citation1991) also proved this statement in their study on adoption of Information Technology Innovation. Consumers evaluate products or services based on cognitive and affective factors; hence, H. W. Kim et al. (Citation2007) incorporated enjoyment and usefulness as components of perceived benefits. This has been discussed by a great number of authors in literature; results from previous studies found that perceived benefits have positive and significant effects towards adoption intention. For instance, Yu et al. (Citation2017) study on media tablets; Akroush et al. (Citation2019) research in energy-efficient products; Liao et al. (Citation2022) research regarding online services and E. Kim and Kyung (Citation2023) research on adoption intention of new electronic authentication services. Perceived benefit divided into three constructs: perceived usefulness, facilitating condition and enjoyment in this research.
2.8. Extrinsic and cognitive benefit: Perceived Usefulness (PU)
The definition for perceived usefulness is “the total value a consumer perceives after using a new technology” (H. W. Kim et al., Citation2007). According to Cheung and Vogel (Citation2013), the motivation-oriented approach of TAM sees perceived usefulness as a metric of extrinsic motivation. H. W. Kim et al. (Citation2007) stated that users assess the outcome of their own behavior based on the desirability and functionality of the technology. Perceived usefulness reflects how external rewards relate to the desire to engage in the activity. E. Kim and Kyung (Citation2023) described perceived usefulness as the extent to which a new technology is used in the individual’s daily life or work, hence boosting work and life efficiency. The system’s perceived usefulness is related to its efficiency and productivity, as well as its overall advantages for improving user performance (Tahar et al., Citation2020). According to Liao et al. (Citation2022), the degree to which users believe that studying using an e-learning system would be able to further develop their knowledge and assist them achieve the objective was defined as perceived usefulness.
Consumers believe that a product’s features indicate some desirable functions that it can accomplish. Users would perceive that the product is designated with attractive and useful functions. Zeithaml (Citation1988) mentioned that the construct of usefulness is the consumer’s cognitive assessment of the superiority or the excellence of product or services. Researchers (Dodds et al., Citation1991; Y. Kim et al., Citation2017) postulated that product quality has a significant influence on perceived value; hence, this research assumes perceived usefulness to affect perceived value. Past studies postulated that perceived usefulness is a significant factor of technology adoption, which has been broadly tested in information technology systems research.
2.9. Intrinsic and affective benefit: Enjoyment (ENJ)
Reychav and Wu (Citation2015) described that enjoyment is defined when users feel satisfied in using the product or services, whereas H. W. Kim et al. (Citation2007) indicated that enjoyment serves as an intrinsic and affective benefit. According to Agarwal and Karahanna (Citation2000), consumers who feel satisfied from using the products or services are more willing to adopt the technology as compared to others. Emotional value was defined as “the utility derived from affective states or feeling that a product generates” (Sweeney & Soutar, Citation2001). Hence, H. W. Kim et al. (Citation2007) stated that enjoyment is an effective and intrinsic benefit. Sweeney and Soutar (Citation2001) also postulated that benefits include enjoyment. A number of scholars have proposed that as a user derives enjoyment from utilizing an IT system, he or she develops more intense desires to interact with IT (Chunxiang, Citation2014; Liao et al., Citation2022). In this study, enjoyment is defined as the user’s self-consciousness of enjoyment and satisfaction when engaging with an e-wallet. Furthermore, Liao et al. (Citation2022) stated that enjoyment is an important dimension in e-learning users’ perceptions of hedonic perceived value.
2.10. Facilitating Condition (FC)
Y. Kim et al. (Citation2017) proposed facilitating condition to be included as one of the perceived benefits. Venkatesh et al. (Citation2012) stated that facilitating condition indicates how the technical and organizational infrastructure supports the usage of a product or services. Facilitating condition involves the environment and resources needed for effective adoption of any technology, services or products. Cheong et al. (Citation2004) presented that the belief of the consumer about the availability of necessary resources required to facilitate any services can be known as facilitating condition. Previous studies (Chong, Citation2013; K. Yang, Citation2010) show that facilitating condition has been considered in similar researches such as mobile banking, mobile commerce and the Internet and these studies indicated that it was an important factor in determining adoption intention. In Taiwan and Vietnam, facilitating conditions affect perceived behavior control, which is an essential variable when determining mobile banking adoption intention (Ho et al., Citation2020). According to the findings of W. Lin et al. (Citation2020), there is a significant positive influence relationship between facilitating conditions and behavioral intention, indicating that an individual’s intention to employ mobile payment will be greater with increased resource sufficiency.
2.11. Adoption Intention (AI)
Roostika (Citation2012) stated that perceived value is a new variable, other than the satisfaction and service quality that has enticed researchers’ interest. The assessment between perceived cost and benefit is often known as consumer perceived value. The definition of customer value is “the customer’s overall assessment of the quality of a product based on the perception of what is received and what is given” (Zeithaml, Citation1988). Customers would have stronger behavioral intentions when they perceived that they would obtain high service value. H. W. Kim et al. (Citation2007) stated that consumers often compare benefit with sacrifices; hence, perceived value is an indicator of adoption intention.
H. W. Kim et al. (Citation2007) proposed a value-based adoption model and criticized that TAM has no constructs that represent the overall estimation of the adoption. TAM only includes ease of use and usefulness to analyze adoption behavior, some of the research included attitude into the model. However, Davis et al. (Citation1989) eliminated this attitude due to the weak mediation effect on the adoption intention. According to Venkatesh et al. (Citation2003) studies, attitude only shows great significance when specific cognitions such as effort and performance expectancy are excluded in the model.
According to H. Yang et al. (Citation2016), purchase intention measures a customer’s likelihood of acquiring a given product in the future. Perceived value is expressed by evaluating benefits and sacrifices and establishing intent based on the results (Liao et al., Citation2022). Customers strive for the greatest possible benefit. Furthermore, users might move their perspectives and emotions away from the product’s benefits and generate perceived value. Perceived value is proportional to intention in the context of an e-wallet. Liao et al. (Citation2022) stated that the greater the value, the higher the intent to adopt. As has been previously reported in the literature, PV has a truly significant impact on adoption intention (Hsiao & Chen, Citation2017; E. Kim & Kyung, Citation2023; Liao et al., Citation2022).
2.12. Research framework
TAM (Davis et al., Citation1989) was widely used in past studies to explain the adoption intention of a new technology, with numerous researchers criticized the accuracy of this model (H. W. Kim et al., Citation2007; Slade et al., Citation2015). Therefore, this research adopted the Value-based Adoption Model of Technology (VAM) as VAM overcomes the limitation of TAM in explaining the adoption of new technology by consumers. After a thorough review of these adoptive models, this research had identified three predictor constructs of the adoption intention of Malaysians towards cashless society, which were perceived sacrifice (privacy risk, monetary risk, innovative resistance and technicality), perceived benefit (perceived usefulness, enjoyment and facilitating condition) and perceived value. Thus, the research framework (see Figure ) for this study consisted of three independent variables (perceived sacrifice, perceived benefit and perceived value and one dependent variable (adoption intention).
Figure 1. Research framework.
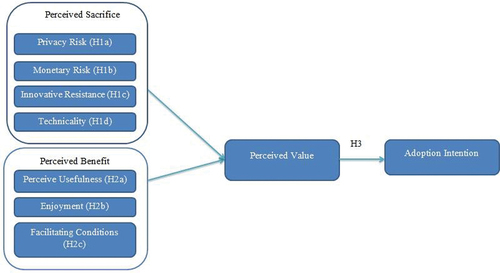
Based on the literature above, the following hypotheses were proposed:
H1(a):
Privacy Risk has a significant negative relationship with perceived value.
H1(b):
Monetary Risk has a significant negative relationship with perceived value.
H1(c):
Innovative Resistance has a significant negative relationship with perceived value.
H1(d):
Technicality has a significant negative relationship with perceived value.
H2(a):
Perceived usefulness has a significant positive relationship with perceived value.
H2(b):
Enjoyment has a significant positive relationship with perceived value.
H2(c):
Facilitating condition has a significant positive relationship with perceived value.
H3:
Perceived value has a significant positive relationship with adoption intention.
3. Methodology
Quantitative research approach was employed. This cross-sectional study employed self-administered survey as the data collection method. In 2017, Malaysian Communication and Multimedia Commission (MCMC) did a survey on mobile phone usage; the results showed that 75.9% of the population was using mobile phones, around 7% difference compared to 68.7% in 2016. Usage of smartphones is quickly increasing and expected to reach 2.87 billion by 2020 (Palau-Saumell et al., Citation2019); hence, smartphone users will be chosen as the target population for this study. Data collected from users of e-wallet and the respondents of this research are Malaysians living in urban areas. The age group the respondents mainly range from 18 to 30 years old. Purposive sampling method was adopted in this study. Purposive sampling also known as selective, subjective or judgmental sampling and it represents a group of different non-probability sampling techniques. Etikan et al. (Citation2016) stated that this sampling method is a deliberate choice because it does not need underlying theories and the sample size is relatively smaller than probability sampling. The difference between probability sampling such as simple random sampling is that the sample is not randomly selected from a population. Besides, the researcher looked for respondents who could and were willing to provide information by virtue of their experience. It involves identifying and selecting a group of individuals who are well informed and proficient in the phenomenon of interest. This sampling method is employed so that the researcher can concentrate on potential respondents with particular required characteristics.
An analysis has been carried out with G*Power 3 to calculate the minimum sample size. Faul et al. (Citation2007) stated that G*Power analysis is an application which able to run several types of statistical test that are widely use in social and behavioral research. Post hoc analysis are available in G*Power 3 where statistical power 12 β is computed as a function of population effect size and sample size. Based on the statistical power of 0.95 with seven predictors (privacy risk, monetary risk, innovation resistance, technicality, perceived usefulness, enjoyment, facilitating conditions and perceived value, the minimum sample size required for this research is 142 respondents. Besides, J. F. Hair et al. (Citation2014) mentioned that sample size of 200 to 500 is sufficient for multivariate data analysis. 214 usable responses were obtained.
Under questionnaire design, a structured questionnaires survey has been established that allows respondents to answer accordingly. There will be two sections in the questionnaires, Section A and B. Section A of the questionnaire captures the data about independent variables and dependent variable of this research. The items of the questionnaire in this research were adopted from different sources (refer Appendix I). The researcher considers that Likert scale format questionnaire represent the idea being measured without the need of go through validation process. The questionnaires (see Appendix II) are divided into two sections. The first section of the questionnaire collects information based on the construct measurements, mainly the independent variable and adoption intention towards e-wallet. Part A was made up of response options ranging from strongly agree to strongly disagree. A 5-point Likert level of agreement scale from 1 to 5 was used to assess responses for all construct measurements where 1 “strongly disagree”, 2 “disagree”, 3 “Neutral”, 4 “agree”, and 5 “strongly agree”. The second section of the questionnaire covers sociodemographic data such as gender, vocation and their habit of using e-wallet. Data collected from the questionnaire has been analyzed using IBM SPSS version 25 and SmartPLS-SEM.
Data collected from questionnaire has been analyzed using IBM SPSS version 25 and SmartPLS-SEM. SPSS was used to conduct preliminary and descriptive analysis, where SmartPLS-SEM was used to conduct reliability, validity and inferential analysis. First, preliminary analysis was conducted which includes common method variance analysis, multicollinearity analysis and normality tests. Common method variance is variance that is attributable to the measurement method rather than to the constructs the measures represent (Field, Citation2018) and analysis was used to diagnose problem in common method bias. Inter-correlations among independent variables can be determined through multicollinearity analysis. Next, descriptive analysis was conducted including demographic variables and tested constructs. Respondents’ demographic profile, mean, correlation and standard deviation of the constructs have been conducted. The measurement model of this study was evaluated by reliability, discriminant validity and convergent validity. Cronbach’s alpha is another measure that assumes similar thresholds but J. Hair et al. (Citation2019) mentioned that it generates lower value than composite reliability. The unweighted items causing Cronbach’s alpha to be less precise in measuring reliability. As composite reliability weighted the items based on the variable indicators’ individual loading, the reliability is higher compare to Cronbach’s alpha. Factor loadings, average variance extracted and composite reliability will be used to assess convergent validity as suggested by J. F. Hair et al. (Citation2014). Heterotrait-monotrait (HTMT) ratio of the correlations was carried out to evaluate the discriminant validity as recommended by Henseler et al. (Citation2015). Lastly, inferential analysis was conducted. Multiple regression analysis was carried out to analyze the data collected.
4. Results
4.1. Preliminary analysis
Harman’s single-factor test carried out in this research to evaluate common method bias. Based on the outcomes of this study, the percentage of variance extracted was 37.01%, which was less than the previously indicated 50% threshold, implying that common method bias did not exist in this study. Next, Tolerance Value and Variance Inflation Factor (VIF) were employed to identify multicollinearity in this research.
Tolerance values range from 0.311 to 0.536, which is greater than 0.1, whereas VIF values range from 1.867 to 3.216, with all independent variable values less than 5. As a result, the Tolerance Value and Variance Inflation Factors results suggested that there is no error in this study; the independence normality assumption can be identified. In order to determine whether the data were gathered from a normally distributed population, a normality test was performed. The skewness level ranges from −0.784 to 0.347, which is within the ± 2 threshold range. Apart from that, the kurtosis value ranges from −0.779 to 1.949, this is within the ± 7 threshold range. Therefore, the data acquired in this research met the J. Hair et al. (Citation2013) threshold, indicating that there is no issue with normality.
4.2. Respondents profile
According to the demographic profile (see Table ), the majority of respondents (59%) were female, while male respondents accounted for 41%. The majority of respondents (54%) are aged between 18 and 30, indicating that young people use e-wallets more than the rest of the age group. Majority of the respondents (51%) held a Bachelor’s Degree. Data show that 38% (81) of respondents used e-wallet services at least once a week. Furthermore, the majority of respondents (32%) are at the lower management level and it reveals that 38% of respondents earn RM 5,000 or more per month.
Table 1. Respondents Demographic profile
4.3. Mean, standard deviation and correlations
The mean, standard deviation and the result of Pearson Correlation of each variable are shown in Table . As shown in Table , each variable is above the significant level of 0.01 indicates that the relationships among the entire variable tested are positively correlated. Correlation value of 0.739 between “privacy risk” and “monetary risk” shows the high level of correlation where the lowest correlation value of 0.165 between “monetary risk” and “perceived value” indicates some level of correlation between the two variables.
Table 2. Mean, standard deviation and correlations
4.4. Reliability and validity analyses
J. Hair et al. (Citation2019) stated that the fivrst step in measurement model assessment is to examine the indicator loadings, loadings of 0.708 or above are recommended because it shows that the variable explains more than 50% of the indicator’s variance, hence providing acceptable item reliability. The main loading of items has been analyzed and it shows that most of the loading values are above 0.708 (see Table ). Two items (IR9 and IR11) from the independent variable “Innovation Resistance” has been deleted as they had less than the minimum cut-off loading value.
Table 3. Convergent validity
Composite reliability ranging from 0.847 to 0.957 and the Average variance extracted (AVE) range from 0.509 to 0.880 exceeded the recommended value by J. Hair et al. (Citation2013). Apart from that Heterotrait-monotrait (HTMT) values are lower than 0.85, signifying adequate discriminant validity (see Table ).
Table 4. Discriminant validity (Heterotrait-Monotrait)
4.5. Inferential analysis
The results of the structural model are presented in Table and Figure . R2 for perceived value is 70.3% and adoption intention is 40%. The outcomes shown that privacy risk (β = −0.278, p < 0.01), innovation resistance (β = −0.174, p < 0.01), perceived usefulness (β = 0.394, p < 0.01) and facilitating condition (β = 0.221, p < 0.01) are significantly associated with the perceived value. Hence, hypothesis H1 (a), H1(c), H2 (a) and H2(c) were supported. Furthermore, there is a strong relationship between perceived value (β = 0.633, p < 0.01) and e-wallet adoption intention, indicating that H3 is supported. On the contrary, monetary risk, technicality and enjoyment were found to have an insignificant relationship with perceived value. Hence, hypothesis H1 (b), H1(c) and H2 (b) are not supported. This finding supports the existing literature of H. W. Kim et al. (Citation2007) which stated that the relationship between technicality and enjoyment towards perceived value are not significant.
Figure 2. Structural model.
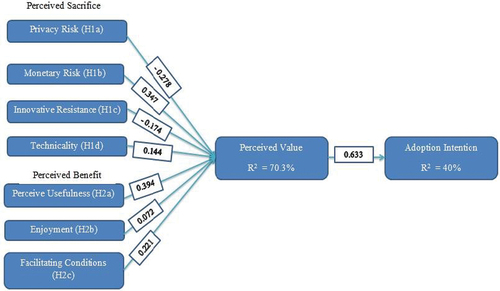
Table 5. Summary of the structural model
5. Conclusion
The main purpose of this study was to investigate the factors affecting the perceived value and adoption intention towards e-wallet in Malaysia grounded by the VAM model. This research paper attempted to explain factors that affect the decision of consumers in adopting e-wallet. VAM explained that the adoption intention is determined by the perceived value. In addition, this study was set to examine whether the perceived value is driven by perceived sacrifice and perceived benefits in the context of e-wallet services. This study further contributes to the body of knowledge by examining the subsidiaries of perceived sacrifice namely privacy risk, monetary risk, innovation resistance and technicality; as well as the sub-dimension of perceived benefit includes perceived usefulness, enjoyment and facilitating condition.
The results have shown that perceived benefit has a higher significance as compared to perceived sacrifice on perceived value. H1 (a) result (β= −0.278, p = 0.001) and H1(c) result (β = −0.174, p = 0.002) in the previous chapter indicate that privacy risk and innovative resistance have negative relationship with perceived value. However, the results of H1 (b) (β = 0.347, p = 0.000) and H1 (d) (β = 0.144, p = 0.019) postulated that the effects of monetary risk and technicality on perceived value is not accepted. H2 (a) result (β = 0.394, p = 0.001) and H2(c) result (β = 0.221, p = 0.000) in the previous chapter indicate that perceived usefulness and facilitating condition have positive relationship with perceived value. Nevertheless, the results of H2 (b) (β = 0.072, p = 0.236) stated that enjoyment does not affect perceived value. This indicated that the majority of the sample population that participated in the study intended to adopt new e-wallet services. These findings might be due to the younger generation not having difficulties in adopting new technology such as e-wallet and they are more IT savvy as compared to the older generation. Golant (Citation2017) reported that the younger generation is more willing to accept new technology. Hence, this supports the results in the research conducted by H. W. Kim et al. (Citation2007) and Y. Kim et al. (Citation2017).
Finally, the perceived value H3 (β = 0.633, p < 0.01) was found to have a strong relationship with the adoption intention of e-wallet. This supports the previous studies conducted by Kim et al. (Citation2013) and Wang and Wang (Citation2010), therefore supporting the VAM concept.
6. Discussion
The findings of this research highlighted some important issues related to consumers’ adoption intention towards e-wallet in Malaysia that has not been focused on in previous studies. From a theoretical point of view, this research expanded the understanding of the factors affecting new technology adoption from the perspective of consumers. The main theoretical contribution of this research is the adoption of the Value-based Adoption Model of Technology (VAM). Previous studies often used TAM to explain the adoption intention of a new technology; as mentioned earlier, TAM has been critiqued for having a conclusive approach without fully reflecting users’ individual characteristics (Slade et al., Citation2015). According to the research done by H. W. Kim et al. (Citation2007), TAM and VAM have been compared and the result shows that VAM is more effective in interpreting consumer intention to adopt. VAM overcomes the limitation of TAM in explaining the adoption of new technology by consumers.
The importance of perceived value in justifying the adoption intention of e-wallet by consumers is shown in this research. This research grants a different view of the two common determinants of technology adoption, which are ease of use (related to technicality) and perceived usefulness. Previous findings (Y. Kim et al., Citation2017) show the facilitating condition as the variable that displayed the greatest impact on perceived value, but in this study, perceived usefulness displayed the greatest importance among all the constructs in perceived benefit. Since perceived usefulness showed a significant impact on e-wallet adoption, service providers should generate innovative strategies to promote e-wallet among consumers and develop a belief that this cashless payment system is better as compared to traditional payment systems. User acceptance is affected by the design of the e-wallet application; consumers are more willing to adopt if these applications are user-friendly.
Besides that, contrary to previous findings, technicality does not have a significant negative relationship with perceived value. These findings can be utilized as a reference for future research in a similar field. The outcome of this research might provide a direction for future research to explore crucial determinants of e-wallet adoption intention.
This study has practical implications for e-wallet development and marketing. E-wallet service providers should generate an image of desirable benefits because it influences potential consumers’ perceived value of the services. Based on the result in this study, greater perceived value reflects a greater intention to use e-wallet. It is indicated that the adoption intention is motivated by intrinsic outcomes of utilizing an e-wallet, not only by extrinsic benefits. As a result, in order to understand consumer demands and desires, market practitioners should perform market research on a regular basis.
In addition, creating a risk-free environment for online transactions is very important. Risk is one of the main reasons that potential users refuse to engage in financial transactions via mobile phones. E-wallet service providers should focus on eliminating these risks such as preventing fraud, identity theft and intrusion of sensitive data in order to create a safer environment and increase user’s confidence. The outcome of this study shows that privacy risk is the main concern of the potential users and it has a negative relationship with perceived value. Hence, market practitioners should continuously improve mechanisms to ensure the integrity of personal information and enhance the technological and legal structures for ensuring the security of the payment process. For instance, the service providers should strengthen their systems by enabling multiple encryptions, construct safety firewalls to prevent incursion or consistently create users’ awareness on fraud websites or messages.
The study contributes to the existing knowledge by examining some of the understudied dimensions that could affect the adoption of e-wallet service, such as privacy risk, innovation resistance, monetary risk, enjoyment, facilitating condition on the perceived value and thus the adoption intention of e-wallet. Moreover, the wide array of factors in this model recommended that the intention to adopt new technology needs to be studied by combining economic, psychological and social perspectives.
7. Research limitations
Although this research contributes to examining some crucial factors that affect the perceived value and adoption intention for Malaysia e-wallet users, there are some limitations in this research. Data collected from users of e-wallet only; future studies need to consider conducting research between e-wallet users and non-users in order to understand the effect of different factors on both groups.
Apart from that the respondents of this research live in urban areas like Selangor, Kuala Lumpur and Penang. Due to their socioeconomic status, they were assumed to be more familiar with e-wallet services. These days, the Malaysia government is working on expanding new technologies in rural areas; hence, future studies may consider including residents in the rural area as part of the sample population. In other words, there might be other potential factors that affect the perceived value of these residents. Data collection was limited to Malaysia; validation of the results across multiple geographical locations is required as e-wallets are a worldwide phenomenon. Future research should be cross-national to explore other significant factors in other cultures.
Moreover, the age group the respondents mainly range from 18 to 30 years old. Future study could expand the sample to include a more diversified demographic population to have a better understanding of consumer behavior. Besides, perceived sacrifices and benefits are examined under a direct relationship with perceived value. Since some of the variables under perceived sacrifice and benefit are not supported, future study may consider having perceived value as a mediator. The mediating effect of perceived sacrifice and benefits with adoption intention can be examined and the factors under the perceived sacrifice and benefits act as antecedents in order to get a better prediction of adoption intention. Future researchers are recommended to consider other constructs to be included in the VAM to enhance the understanding of Malaysia’s expectation on the benefits and sacrifices of new technology.
Acknowledgments
The authors would like to acknowledge Universiti Teknologi Malaysia for the funding under UTM Encouragement Research (UTMER) (Q.K130000.3855.20J94).
Disclosure statement
No potential conflict of interest was reported by the author(s).
References
- Agarwal, R., & Karahanna, E. (2000). Time flies when you’re having fun: Cognitive absorption and beliefs about information technology usage. MIS Quarterly, 24(4), 665–31. https://doi.org/10.2307/3250951
- Akroush, M. N., Zuriekat, M. I., Jabali, H. I. A., & Asfour, N. A. (2019). Determinants of purchasing intentions of energy-efficient products. International Journal of Energy Sector Management, 13(1), 128–148. https://doi.org/10.1108/ijesm-05-2018-0009
- Akturan, U., & Tezcan, N. (2012). Mobile banking adoption of the youth market. Marketing Intelligence & Planning, 30(4), 444–459. https://doi.org/10.1108/02634501211231928
- Balta-Ozkan, N., Davidson, R., Bicket, M., & Whitmarsh, L. (2013). Social barriers to the adoption of smart homes. Energy Policy, 63, 363–374. https://doi.org/10.1016/j.enpol.2013.08.043
- Bank Negara Malaysia. (2023). Driving towards electronic payments. https://www.bnm.gov.my/driving-towards-electronic-payments
- Business Today. (2022, June 22). A nation propelled towards becoming digital first in finance. https://www.businesstoday.com.my/2022/06/22/a-nation-propelled-towards-becoming-digital-first-in-finance/
- Cheong, J. H., Park, M. C., & Hwang, J. H. (2004). Mobile payment adoption in Korea: Switching from credit card. In ITS 15th Biennial Conference, (pp. 15). https://docplayer.net/11273913-Mobile-payment-adoption-in-korea-switching-from-credit-card.html
- Cheung, R., & Vogel, D. (2013). Predicting user acceptance of collaborative technologies: An extension of the technology acceptance model for e-learning. Computers & Education, 63, 160–175. https://doi.org/10.1016/j.compedu.2012.12.003
- Chong, A. Y. L. (2013). Predicting m-commerce adoption determinants: A neural network approach. Expert Systems with Applications, 40(2), 523–530. https://doi.org/10.1016/j.eswa.2012.07.068
- Chung, K. H., & Liang, S. W. (2020). Understanding factors affecting innovation resistance of mobile payments in Taiwan: An integrative perspective. Mathematics, 8(10), 1841. https://doi.org/10.3390/math8101841
- Chunxiang, L. (2014). Study on mobile commerce customer based on value adoption. Journal of Applied Sciences, 14(9), 901–909. https://doi.org/10.3923/jas.2014.901.909
- Commission Factory. (2023). 5 Most popular online payment methods in Malaysia in 2023. https://blog.commissionfactory.com/ecommerce-marketing/payment-methods-in-malaysia
- Constantiou, I., Mylonopoulos, N., Sideris, I., & Vrechopoulos, A. (2002). Critical success factors for accelerating mobile commerce diffusion in Europe. In BLED 2002 Proceedings. (pp. 9). http://aisel.aisnet.org/bled2002/9
- Davis, F. D., Bagozzi, R. P., & Warshaw, P. R. (1989). User acceptance of computer technology: A comparison of two theoretical models. Management Science, 35(8), 982–1003. https://doi.org/10.1287/mnsc.35.8.982
- Dodds, W. B., Monroe, K. B., & Grewal, D. (1991). Effects of price, brand, and store information on buyers’ product evaluations. Journal of Marketing Research, 28(3), 307–319. https://doi.org/10.1177/002224379102800305
- Donner, J., & Tellez, C. A. (2008). Mobile banking and economic development: Linking adoption, impact, and use. Asian Journal of Communication, 18(4), 318–332. https://doi.org/10.1080/01292980802344190
- Etikan, I., Musa, S. I., & Alkassim, R. (2016). Comparison of convenience sampling and purposive sampling. American Journal of Theoretical and Applied Statistics, 5(1), 1. https://doi.org/10.11648/j.ajtas.20160501.11
- Faul, F., Erdfelder, E., Lang, A., & Buchner, A. (2007). G*power 3: A flexible statistical power analysis program for the social, behavioral, and biomedical sciences. Behavior Research Methods, 39(2), 175–191. https://doi.org/10.3758/bf03193146
- Fernández, J. G., Gálvez-Ruiz, P., Gavira, J. F., Vélez-Colón, L., Pitts, B. G., & Bernal-García, A. (2018). The effects of service convenience and perceived quality on perceived value, satisfaction and loyalty in low-cost fitness centers. Sport Management Review, 21(3), 250–262. https://doi.org/10.1016/j.smr.2017.07.003
- Field, A. (2018). Discovering statistics using IBM SPSS Statistics (5th ed.). SAGE Publications Ltd.
- Ganeshwaran, K. (2019, June). CEO: Time for e-wallet environment to consolidate. The Star. https://www.thestar.com.my/business/business-news/2019/06/19/ceo-time-for-ewallet-environment-to-consolidate
- Ghezzi, A., Renga, F., Balocco, R., & Pescetto, P. (2010). Mobile payment applications: Offer state of the art in the Italian market. Info, 12(5), 3–22. https://doi.org/10.1108/14636691011071130
- Golant, S. (2017). A theoretical model to explain the smart technology adoption behaviors of elder consumers. Journal of Aging Studies, 42, 56–73. viewed 14 July 2019. https://doi.org/10.1016/j.jaging.2017.07.003
- Hair, J. F., Hult, G. T. M., Ringle, C. M., & Sarstedt, M. (2014). A primer on partial least squares structural equation modeling. Sage Publishers.
- Hair, J., Hult, T. G. M., Ringle, C. M., & Sarstedt, M. (2013). A Primer on Partial Least Squares Structural Equation Modeling (PLS-SEM) (1st ed.). SAGE Publications, Inc.
- Hair, J., Risher, J., Sarstedt, M., & Ringle, C. (2019). When to use and how to report the results of PLS-SEM. European Business Review, 31(1), 2–24. https://doi.org/10.1108/EBR-11-2018-0203
- Heidenreich, S., & Handrich, M. (2015). What about passive innovation resistance? Investigating adoption-related behavior from a resistance perspective. Journal of Product Innovation Management, 32(6), 878–903. https://doi.org/10.1111/jpim.12161
- Henseler, J., Ringle, C. M., & Sarstedt, M. (2015). A new criterion for assessing discriminant validity in variance-based structural equation modeling. Journal of the Academy of Marketing Science, 43. https://doi.org/10.1007/s11747-014-0403-8
- Hong, A., Nam, C., & Kim, S. (2020). What will be the possible barriers to consumers’ adoption of smart home services? Telecommunications Policy, 44(2), 101867. https://doi.org/10.1016/j.telpol.2019.101867
- Ho, J. C., Wu, C., Lee, C., & Pham, T. T. (2020). Factors affecting the behavioral intention to adopt mobile banking: An international comparison. Technology in Society, 63, 101360. https://doi.org/10.1016/j.techsoc.2020.101360
- Hsiao, K., & Chen, C. (2017). Value-based adoption of e-book subscription services: The roles of environmental concerns and reading habits. Telematics and Informatics, 34(5), 434–448. https://doi.org/10.1016/j.tele.2016.09.004
- Hsu, C., & Lin, J. (2018). Exploring factors affecting the adoption of internet of things services. Journal of Computer Information Systems, 58(1), 49–57. https://doi.org/10.1080/08874417.2016.1186524
- Kahneman, D., & Tversky, A. (1979). Prospect theory: An analysis of decision under risk. Econometrica, 47(2), 263–291. https://doi.org/10.2307/1914185
- Kim, H. W., Chan, H. C., & Gupta, S. (2007). Value-based adoption of mobile internet: An empirical investigation. Decision Support Systems, 43(1), 111–126. https://doi.org/10.1016/j.dss.2005.05.009
- Kim, E., & Kyung, Y. (2023). Factors affecting the adoption intention of new electronic authentication services: A convergent model approach of VAM, PMT, and TPB. IEEE Access, 11, 13859–13876. https://doi.org/10.1109/access.2023.3243183
- Kim, Y., Park, Y., & Choi, J. (2017). A study on the adoption of IoT smart home service: Using value-based adoption model. Total Quality Management & Business Excellence, 28(9–10), 1149–1165. https://doi.org/10.1080/14783363.2017.1310708
- Kim, S. B., Sun, K. A., & Kim, D. Y. (2013). The influence of consumer value-based factors on attitude-behavioral intention in social commerce: The differences between high- and lowtechnology experience groups. Journal of Travel & Tourism Marketing, 30(1– 2), 108–125. https://doi.org/10.1080/10548408.2013.751249
- Kumar, V., & Reinartz, W. (2016). Creating enduring customer value. Journal of Marketing, 80(6), 36–68. https://doi.org/10.1509/jm.15.0414
- Leng, L. K. (2017, September 6). Fave introduces FavePay mobile payment feature. The Star. https://www.thestar.com.my/tech/tech-news/2017/09/06/fave-introduces-favepay-mobile-payment-feature/#C3riiieVbP114l6m.99
- Liao, Y., Wu, W., Le, T. T., & Phung, T. L. (2022). The integration of the technology acceptance model and value-based adoption model to study the adoption of E-Learning: The moderating role of e-WOM. Sustainability, 14(2), 815. https://doi.org/10.3390/su14020815
- Lin, W., Lin, C., & Ding, Y. (2020). Factors affecting the behavioral intention to adopt mobile payment: An empirical study in Taiwan. Mathematics, 8(10), 1851. https://doi.org/10.3390/math8101851
- Lin, T., Wu, S. N., Hsu, J. W., & Chou, Y. (2012). The integration of value-based adoption and expectation–confirmation models: An example of IPTV continuance intention. Decision Support Systems, 54(1), 63–75. https://doi.org/10.1016/j.dss.2012.04.004
- Liu, J., Kauffman, R. J., & Ma, D. (2015). Competition, cooperation, and regulation: Understanding the evolution of the mobile payments technology ecosystem. Electronic Commerce Research and Applications, 14(5), 372–391. https://doi.org/10.1016/j.elerap.2015.03.003
- Li, Y., Yang, S., Chen, Y., & Yao, J. (2018). Effects of perceived online–offline integration and internet censorship on mobile government microblogging service continuance: A gratification perspective. Government Information Quarterly, 35(4), 588–598. https://doi.org/10.1016/j.giq.2018.07.004
- Low, H. P. (2023, January 25). How COVID-19 Shaped the E-Wallet landscape in Malaysia - oppotus. Oppotus. https://www.oppotus.com/how-covid-19-shaped-the-e-wallet-landscape-in-malaysia/
- Low, J. (2019, April 22). E-Wallet in Malaysia: A glimpse into the future of payments in Malaysia. JasonLow.my. https://jasonlow.my/2019/04/22/alibaba-netpreneur-program-day-4-e-wallet-in-malaysia-part-1/
- Lu, K., & Wang, X. (2020). Analysis of perceived value and travelers’ behavioral intention to adopt ride-hailing services: Case of Nanjing, China. Journal of Advanced Transportation, 2020, 1–13. https://doi.org/10.1155/2020/4380610
- The Malaysian Reserve. (2022, October 21). The adoption, evolution of e-wallets. https://themalaysianreserve.com/2022/10/21/the-adoption-evolution-of-e-wallets/
- Ministry of Finance Malaysia. (2020, January 14). The e-Tunai Rakyat initiative. https://www1.treasury.gov.my/index.php/en/gallery-activities/press-release/item/5784-press-release-the-e-tunai-rakyat-initiative.html
- Molina-Castillo, F.-J., López-Nicolás, C., & Bouwman, H. (2008). Explaining mobile commerce services adoption by different type of customers. Journal of Systemics Cybernetics and Informatics, 6, 73–79.
- Moore, G. C., & Benbasat, I. (1991). Development of an instrument to measure the perceptions of adopting an information technology innovation. Information Systems Research, 2(3), 192–222. https://doi.org/10.1287/isre.2.3.192
- New Straits Times. (2020, June 5). RM50 e-wallet credit to encourage contactless payment. https://www.nst.com.my/news/nation/2020/06/598242/rm50-e-wallet-credit-encourage-contactless-payment#:~:text=KUALA%20LUMPUR%3A%20Malaysians%20will%20receive,million%20Malaysians%2C%20starting%20next%20month.
- Oreg, S. (2006). Personality, context, and resistance to organizational change. European Journal of Work and Organizational Psychology, 15(1), 73–101. https://doi.org/10.1080/13594320500451247
- Palau-Saumell, R., Forgas-Coll, S., Sánchez-García, J., & Robres, E. (2019). User acceptance of mobile apps for restaurants: An expanded and extended UTAUT-2. Sustainability, 11(4), 1210. https://doi.org/10.3390/su11041210
- Park, J., Amendah, E., Lee, Y., & Hyun, H. (2018). M-payment service: Interplay of perceived risk, benefit, and trust in service adoption. Human Factors and Ergonomics in Manufacturing & Service Industries, 29(1), 31–43. https://doi.org/10.1002/hfm.20750
- Ramayah, T., Lian, L. S., Rahman, S. A., & Taghizadeh, S. K. (2017). Modelling mobile money adoption: A Malaysian perspective. International Journal of Mobile Communications, 15(5), 491. https://doi.org/10.1504/IJMC.2017.086365
- Ram, S., & Sheth, J. N. (1989). Consumer resistance to innovations: The marketing problem and its solutions. Journal of Consumer Marketing, 6(2), 5–14. https://doi.org/10.1108/EUM0000000002542
- Ravindran, S. (2018, May 29). E-wallet initiative gets positive response at S‘gor bazaars. The Star. https://www.thestar.com.my/metro/metro-news/2018/05/30/cashless-initiative-in-sgor-gets-positive-response-ewallet-app-used-at-bazaars-to-be-extended-to-aid/#k8wTxS5X84ZTQbHs.99
- Reychav, I., & Wu, D. (2015). Are your users actively involved? A cognitive absorption perspective in mobile training. Computers in Human Behavior, 44, 335–346. https://doi.org/10.1016/j.chb.2014.09.021
- Roostika, R. (2012). Mobile internet acceptance among university students: A value-based adoption model. International Journal of Research in Management & Technology (IJRMT), 2(1), 221–228.
- Santos, A. R. D., & Ponchio, M. C. (2021). Functional, psychological and emotional barriers and the resistance to the use of digital banking services. Innovation & Management Review, 18(3), 331–348. https://doi.org/10.1108/inmr-07-2020-0093
- Schierz, P. G., Schilke, O., & Wirtz, B. W. (2010). Understanding consumer acceptance of mobile payment services: An empirical analysis. Electronic Commerce Research and Applications, 9(3), 209–216. https://doi.org/10.1016/j.elerap.2009.07.005
- Slade, E. L., Dwivedi, Y. K., Piercy, N. C., & Williams, M. D. (2015). Modeling consumers’ adoption intentions of remote mobile payments in the United Kingdom: Extending UTAUT with innovativeness, risk, and trust. Psychology & Marketing, 32(8), 860–873. https://doi.org/10.1002/mar.20823
- The Straits Times. (2020, April 28). Coronavirus pandemic has steepened adoption curve of e-wallets in Malaysia. https://www.straitstimes.com/asia/se-asia/coronavirus-pandemic-has-steepened-adoption-curve-of-e-wallets-in-malaysia
- Sweeney, J. C., & Soutar, G. N. (2001). Consumer perceived value: The development of a multiple item scale. Journal of Retailing, 77(2), 203–220. https://doi.org/10.1016/S0022-4359(01)00041-0
- Tahar, A., Riyadh, H. A., Sofyani, H., & Purnomo, W. A. (2020). Perceived ease of use, perceived usefulness, perceived security and intention to use E-Filing: The role of technology readiness. The Journal of Asian Finance, Economics & Business, 7(9), 537–547. https://doi.org/10.13106/jafeb.2020.vol7.no9.537
- Thakur, R., & Srivastava, M. (2014). Adoption readiness, personal innovativeness, perceived risk and usage intention across customer groups for mobile payment services in India. Internet Research, 24(3), 369–392. https://doi.org/10.1108/IntR-12-2012-0244
- Thakur, R., & Srivastava, M. (2015). A study on the impact of consumer risk perception and innovativeness on online shopping in India. International Journal of Retail & Distribution Management, 43(2), 148–166. https://doi.org/10.1108/IJRDM-06-2013-0128
- Venkatesh, M., Davis, M., & Davis, D. (2003). User acceptance of information technology: Toward a unified view. MIS Quarterly, 27(3), 425. https://doi.org/10.2307/30036540
- Venkatesh, V., Thong, Y. L., & Xu, X. (2012). Consumer acceptance and use of information technology: extending the unified theory of acceptance and use of technology. MIS Quarterly, 36(1), 157–178. https://doi.org/10.2307/41410412
- Wang, C. (2014). Antecedents and consequences of perceived value in mobile government continuance use: An empirical research in China. Computers in Human Behavior, 34, 140–147. https://doi.org/10.1016/j.chb.2014.01.034
- Wang, C., Teo, T. S. H., & Liu, L. (2020). Perceived value and continuance intention in mobile government service in China. Telematics and Informatics, 48, 101348. https://doi.org/10.1016/j.tele.2020.101348
- Wang, H. Y., & Wang, S. H. (2010). Predicting mobile hotel reservation adoption: Insight from a perceived value standpoint. International Journal of Hospitality Management, 29(4), 598–608 https://doi.org/10.1016/j.ijhm.2009.11.001.
- Woodruff, R. B. (1997). Customer value: The next source for competitive advantage. Journal of the Academy of Marketing Science, 25(2), 139–153. https://doi.org/10.1007/BF02894350
- Wulandari, D., Soseco, T., & Narmaditya, B. S. (2016). Analysis of the use of electronic money in efforts to support the less cash society. International Finance and Banking, 3(1), 1–10. https://doi.org/10.5296/ifb.v3i1.8802
- Wu, J.-H., & Wang, S.-C. (2005). What drives mobile commerce? An empirical evaluation of the revised technology acceptance model. Information & Management. https://doi.org/10.5555/1080548.1080555
- Xiong, J., & Zuo, M. (2022). Understanding factors influencing the adoption of a mobile platform of medical and senior care in China. Technological Forecasting and Social Change, 179, 121621. https://doi.org/10.1016/j.techfore.2022.121621
- Yang, A. S. (2009). Exploring adoption difficulties in mobile banking services. Canadian Journal of Administrative Sciences, 26(2), 136–149. https://doi.org/10.1002/cjas.102
- Yang, K. (2010). Determinants of US consumer mobile shopping services adoption: Implications for designing mobile shopping services. Journal of Consumer Marketing, 27(3), 262–270. https://doi.org/10.1108/07363761011038338
- Yang, S., Lu, Y., Gupta, S., Cao, Y., & Zhang, R. (2014). Mobile payment services adoption across time: An empirical study of the effects of behavioral beliefs, social influences, and personal traits. Computers in Human Behavior, 28(1), 129–142. https://doi.org/10.1016/j.chb.2011.08.019
- Yang, H., Yu, J., Zo, H., & Choi, M. (2016). User acceptance of wearable devices: An extended perspective of perceived value. Telematics and Informatics, 33(2), 256–269. https://doi.org/10.1016/j.tele.2015.08.007
- Yong, I., Wong, T., & Lim, P. (2021). Intention to use E-Wallet amongst the university students in klang valley. International Journal of Business and Economy, 3(1), 75–84. https://myjms.mohe.gov.my/index.php/ijbec/article/view/12747/6525
- Yoon, S., & Oh, J. (2022). A theory-based approach to the usability of augmented reality technology: A cost-benefit perspective. Technology in Society, 68, 101860. https://doi.org/10.1016/j.techsoc.2022.101860
- Yu, J., Lee, H., Ha, I., & Zo, H. (2017). User acceptance of media tablets: An empirical examination of perceived value. Telematics and Informatics, 34(4), 206–223. https://doi.org/10.1016/j.tele.2015.11.004
- Zeithaml, V. A. (1988). Consumer perceptions of price, quality, and value: A means-end model and synthesis of evidence. Journal of Marketing, 52(3), 2–22. https://doi.org/10.1177/002224298805200302
- Zhong, J., & Chen, T. (2023). Antecedents of mobile payment loyalty: An extended perspective of perceived value and information system success model. Journal of Retailing and Consumer Services, 72, 103267. https://doi.org/10.1016/j.jretconser.2023.103267
Appendix I:
Questionnaire Source
Appendix
Kindly read each statement and choose the answer that most accurately tells how true the statement is for you on a scale of 1 = strongly disagree to 5 = strongly agree
Section BInstruction: In this section, information is collected for categorization purpose
Kindly indicate your response by marking (X) in the most appropriate box.
1. Gender
▭ (1) Male
▭ (2) Female
2. Age Group
▭ (1) Below 18 years old
▭ (2) 18 - 30 years old
▭ (3) 31 - 50 years old
▭ (4) 51 years old and above
3. What is your current educational level?
▭ (1) Certificate (high school/ vocational institution/ technical colleges)
▭ (2) Diploma
▭ (3) Bachelor degree
▭ (4) Postgraduate Degree (master / doctoral)
▭ (5) Others (Please specify)
4. Vocation
▭ (1) Student
▭ (2) Entrepreneur / Self-employed
▭ (3) Higher management Level - Manager / Specialist
▭ (4) Lower management level - Executive / Officer
Others (Please specify)
5. Monthly Income
▭ (1) < RM 1,500
▭ (1) RM 1,500 - RM 2,999
▭ (2) RM 3,000 - RM 4,999
▭ (3) > RM 5,000
6. How often do you use e-wallet?
▭ (1) At least once a day
▭ (2) At least once a week
▭ (3) At least twice a week
▭ (4) At least once a month
End of Questionnaire