
 ?Mathematical formulae have been encoded as MathML and are displayed in this HTML version using MathJax in order to improve their display. Uncheck the box to turn MathJax off. This feature requires Javascript. Click on a formula to zoom.
Abstract
The study focused on the intention to adopt and actual use of virtual reality (VR) glasses to determine tourist destinations amongst Generation Y in South Africa. This study considers the direct influence of perceived usefulness, perceived ease of use and perceived credibility on attitudes towards use of virtual reality glasses, intention towards use of virtual reality glasses and actual use of virtual reality glasses. In addition, the possible moderating effect of perceived performance and perceived enjoyment on the nexus between the intention and actual use of virtual reality glasses is also examined. The study used a quantitative methodology and cross-sectional research methods to collect data from 550 Generation Y consumers. Data were then analyzed using the Smart PLS 4 computer software. The results indicate that perceived usefulness and ease of use had a positive and significant impact on the attitude towards using virtual reality glasses. Perceived credibility had an insignificant impact on attitude towards use of virtual reality glasses. In addition, attitude towards use of virtual reality glasses had a positive and a significant impact on intention towards the use of virtual reality glasses. There was also a positive association between intention towards use of virtual reality glasses and the actual use of virtual reality glasses. Moreover, perceived performance and perceived enjoyment proved to be the key moderators on the connection between the intention and actual use of virtual reality glasses.Although there are many studies on the use of virtual reality in tourism, studies that have examined the factors that influence how Gen Y consumers use virtual reality glasses to choose travel destinations have several shortcomings. As a result, this study seeks to complement existing tourism-related literature, particularly in the African context. Tourism organisation marketers could spend some time exploring the potential of using virtual reality glasses to increase awareness of destinations.
1. Introduction
In recent years, the development of information and communication technology (ICT) has had a major impact on many economic sectors, including tourism as a result of the impact of the Fourth Industrial Revolution (4IR). The rapid spread of ICT is impeding various aspects of travel (McLean et al., Citation2023; Onderdijk et al., Citation2023; Shao et al., Citation2016). In addition, Shehade and Stylianou-Lambert (Citation2020) argue that ICT will affect how tourism products and services are managed, positioned and advertised in the market, and how visitors plan and book their holidays. In recent years, innovative immersive technologies such as Virtual Reality (VR) have attracted attention. These immersive virtual environments are changing the way tourism operators interact with travelers before, during and after their trip (Ali, Citation2020; Hannam et al., Citation2014; Lemon & Verhoef, Citation2016; McLean et al., Citation2023; Woo et al., Citation2015). According to Guttentag (Citation2010), VR uses computer-generated three-dimensional environments called virtual environments. Virtual environments allow you to navigate and possibly interact with your senses to achieve real-time simulation. Many scholars emphasize that the intangibility, indivisibility, and perceived dangers associated with vacation experiences make virtual reality devices a robust and important tool for improving tourism (Cheong, Citation1995; Gumpo et al., Citation2020; Guttentag, Citation2010). Jayawardena et al. (Citation2023) argue that virtual reality will enable product customization, behavioral tracking, and a better visitor experience.
Additionally, Golja and Paulišić (Citation2021) found that modern visitors, especially younger generations, are highly receptive to new activities and opportunities that help shape their tourism experience. Technological developments have changed the way travellers perceive vacations and have shifted decision-making authority to them. Despite the growing interest in ICT and virtual reality research, there are significant gaps in the current empirical literature on virtual reality glasses in tourism that require further academic investigation. Most of the international research is conducted in countries such as the UK, Finland, Taiwan, UK, Italy and Portugal. For example, Neuburger et al. (Citation2018) investigated augmented and virtual glasses for destination marketing in the UK. Pasanen et al. (Citation2019) evaluated the use of virtual reality goggles in a Finnish nature tourism video. Jung et al. (Citation2016) conducted a study that focused on the impact of virtual reality glasses on the overall experience of UK visitors.
In contrast, Jou and Wang (Citation2013) examined the effect of virtual reality glasses on the learning performance of Taiwanese college students. Also, Pencarelli et al. (Citation2020) found the experience of young tourists using virtual reality glasses in Italy. Against this background, this topic is largely unknown in the developing regions of the world. In the context of South Africa, previous research on virtual reality glasses has been conducted in a variety of contexts. For example, in 2020, Kim, Lee, and Jung used enhanced stimulus bio responses in South Africa to modify customer behaviour in virtual reality tourism. Another study conducted by Loureiro et al. (Citation2019) investigated how virtual reality could be used as a marketing tool in South Africa. Similarly, Kang et al. (Citation2020) examined how virtual reality influences customer purchasing decisions through informative and gamified features in South Africa.
The aforementioned studies indicate a dearth of research investigating the impact of perceived usefulness, perceived ease of use, and perceived credibility on attitudes, intention, and actual usage of virtual reality glasses in South Africa. In the context of this research, a young consumer is operationally defined as an individual whose age is in the range of 18 to 24 years. Assuming a priori that results observed in developed countries are universally applicable to developing countries such as South Africa is a simplistic and imprudent approach. Therefore, it is imperative to recognize this exclusion and justify its separate consideration. The conceptual model put forth in this study possesses a noteworthy degree of distinctiveness; this research makes a valuable contribution to the existing literature by reviewing the proposed framework in the context of a developing country. The Technology Acceptance Model (TAM) has made significant advances over time, resulting in its ability to predict user acceptance of technology accurately. This has been shown by the works of Davis (Citation1989) and Venkatesh and Davis (Citation2000). The Theory of Reasoned Action (TRA) states that a correlation can be made between ideas, intentions and actions (Ajzen & Fishbein, Citation1975). As a result, Davis (Citation1989) formulated a statement of perceived usefulness and ease of use that the TAM later adopted. Hence, this contemporary research endeavours to extend the TAM by incorporating moderator variables such as perceived performance and perceived enjoyment. This work is composed as follows. First, the research background is presented, followed by a literature review, conceptual model, and hypothesis formulation. Then the study design and methods are presented, the results are presented, and the discussion begins. Conclusions, limitations, and future research directions are discussed in the final sections of the article.
2. Contexualisation of the study
2.1. The use of virtual reality glasses in the tourism industry
Virtual reality (VR) is a system that, by stimulating many senses, transports people to new worlds that they feel they are in rather than physically being there (Bordnick et al., Citation2011; Guttentag, Citation2010; McLean et al., Citation2023; Onderdijk et al., Citation2023). Virtual reality can take many forms, from watching 360-degree videos on a desktop computer to using mobile VR applications to wearing VR glasses, also known as head-mounted displays (HMDs) like the Samsung Gear VR (Gumpo et al., Citation2020; Pasanen et al., Citation2019). According to Pestek and Sarvan (Citation2020), many travel destinations have already adopted VR technology as a marketing strategy to offer travelers a preview of hotel properties, cruise ships and travel experiences. The marketing potential of virtual reality in the tourism industry rests on its ability to provide potential travelers with rich sensory data (Onderdijk et al., Citation2023; Pantano & Servidio, Citation2011; Vitaliev, Citation2016). This capability is helpful for the tourism industry as many tourism offerings are products and services that consumers cannot test before purchasing, and only rely on the available descriptive information (Gumpo et al., Citation2020; Pasanen et al., Citation2019; Wiltshier & Clarke, Citation2017). Therefore, the immersive nature of virtual reality in tourism makes it an excellent tool for providing accurate targeting information to potential customers.
Additionally, virtual reality technology usage in tourism allows customers to immerse themselves in a product or service, enabling an experiential encounter that can be used to tailor marketing strategies (Balogun et al., Citation2010; Sinciya et al., Citation2023; Solmaz et al., Citation2023; Wirth et al., Citation2018). Moreover, VR technology can showcase the various landmarks and tourist attractions of a given destination, showcasing what travellers can expect upon arrival. VR technology in tourism can also give people a sense of connection to the destination and help build relationships and loyalty. This can be especially beneficial for hard-to-reach targets or those with limited resources. In addition, VR also offers tourism companies the opportunity to reach potential tourists in a cost-effective way, thereby attracting new customers and building their brand. By providing virtual experiences of tourism destinations, VR can also help reduce crowding at popular attractions and help protect the environment in these areas (Mashapa & Dube, Citation2023; Solmaz et al., Citation2023).
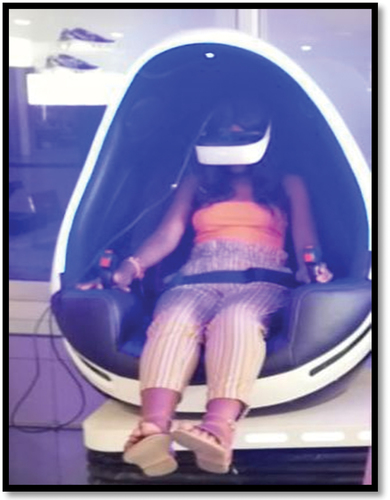
Conversely, with the increasing accessibility of virtual reality technology to Generation Y consumers, it is expected to become a pivotal destination marketing aspect in the coming years (Balogun et al., Citation2010; Wirth et al., Citation2018). By offering an immersive experience, VR can leave a lasting impression on potential travelers. Likewise, it can serve as a means to impart knowledge to individuals regarding the attractions of a particular destination and its cultural heritage. Therefore, knowing the interests of this tech-savvy generation in adopting VR glasses for travel experiences will help destination marketers improve their content production and modify their sales strategies, as virtual reality glasses are anticipated to become a larger part of people’s personal and professional lives (McLean et al., Citation2023). While young travelers love using virtual reality glasses, certain questions concerning the devices remain unresolved. These include perceived factors that affect young consumers’ attitudes toward the usage of virtual reality (VR) glasses, their intentions to do so, and their actual use of VR glasses to choose their vacation destinations, which warrants the aim of this investigation. A consumer utilizing virtual reality glasses is depicted as an example in (Figure ).
Figure 1. A consumer using virtual reality glasses to determine a tourist destination. The rationale and significance of choosing Generation Y consumers.
Buhalis et al. (Citation2019) stated that young consumers are technologically aware and a visually sophisticated generation, which makes it easy for them to adapt to the usage of tourism technology since they are born into the technological age. There is a suggestion that his cohort have grown up in an era in which technology has been and continues to be ubiquitous, and as a result, they may be more technologically savvy than others. Additionally, they desire diversity in advertising message, are more active and engaged in trip preparation than prior generations and are open to use a range of means to get travel information (Xiang et al., Citation2015). As a result, Gen Y is likely to be early adopters of new and creative promotional technologies, such as VR glasses when it comes to planning their vacations.
3. Theoretical lens
3.1. The Technology Acceptance Model (TAM)
The theoretical background required for this study is derived from the TAM (Davis, Citation1989) illustrated in Figure . The Technology Acceptance Model (TAM) has factors which influence the adoption of technology, which has been viewed as an important agenda for changing the qualities of a given technological service in order to make it more attractive towards its adoption. Over the years, the Technology Acceptance Model (TAM) has developed, and substantial progress has been achieved in forecasting user adoption of technology (Davis, Citation1989; Nyagadza et al., Citation2022; Venkatesh & Davis, Citation2000). It is predicated on the Theory of Reasoned Action (TRA), which postulates that causal links between ideas, intentions, and behaviours may be established (Ajzen & Fishbein, Citation1975). The TAM made statements about perceived utility and perceived ease of use (Davis, Citation1989). The TAM model by Davis (Citation1989) provides a better explanation and fit to the current research study as it depicts behavioural intentions and technology use than the prior model(s). The TAM was developed based on the extensions of the TRA which explains how people intend to adopt technology and show related behaviours based on assumed consequences of the adopted technology. The TAM as applied in the current study is meant to anchor the notion that behaviours of young consumers is as a result of the assessment (positive or negative) of the adoption of new digital 4IR technologies (Nyagadza et al., Citation2022) such as the virtual reality glasses to determine their tourism destination enjoyment. In conjunction with prior research, the added moderating variables (Perceived performance and perceived enjoyment) have been viewed as a very important factors in determining perception and intention to adopt smart technology, like the virtual reality glasses in the current study. Justification for the use of TAM in the current research study is based on its application in technology adoption such as digital applications in services industry areas (Melián-González et al., Citation2021). While the TAM has been viewed to be with some weaknesses (Wallace & Sheetz, Citation2014), it provides a useful general framework fit for the current study and is consistent with several factors. In line with this, our current study goes beyond earlier studies by investigating on the use of virtual reality glasses as a platform for generation Y consumers to determine tourists’ destinations.
4. The conceptual model: an extension of TAM
In spite of its significance, TAM is an evolving model where it is modified to fit for context (Lok, Citation2015). Figure illustrates the modified TAM developed for this study to understand the intention and actual use of virtual reality glasses when determining travel destinations. The current study extends the TAM model by including perceived credibility, perceived enjoyment and perceived performance of virtual reality glasses for identifying travel destinations. Perceived credibility has a long history of being viewed as a trust dimension (Doney & Cannon, Citation1997; Nyagadza, Citation2021) and has been viewed as the extent to which a receiver considers believability of information (Wathen & Burkell, Citation2002). Research over the past years has extended the concept of perceived credibility to the other constructs such as source credibility (Filieri, Citation2015, Citation2016) and message credibility (Filieri, Citation2016; Kim & Song, Citation2020; Tormala & Petty, Citation2004). Under normal circumstances, online review, travel and tourism consumers can easily make distinction to these credibility issues.
Figure 3. Conceptual model.
Perceived credibility plays a role in authenticating authenticity in virtual reality glasses for identifying travel destinations, for example the government has the power to authenticate tourists attracting destinations, based on scientific or history and facts (Cohen & Cohen, Citation2012; Holdack et al., Citation2020). Further to this, local communities are there to give a credibility role to authenticating tourists’ virtual glasses and the related objects (this is a result of the fact that it has the freedom to authenticate tourism outlets online and offline through word-of-mouth) (Lugosi, Citation2016; Nyagadza et al., Citation2022). Therefore, perceived credibility is an integral extending element to the TAM model. In line with this, perceived enjoyment of virtual reality glasses for identifying travel destinations could be as a result of aiming to create an exciting and pleasant customer experience in providing advanced product visualisation and interaction possibilities during the shopping processes and decision making for tourism (Holdack et al., Citation2020; Kim & Forsythe, Citation2008).
Therefore, perceived enjoyment functions as a direct influencer for customers’ attitude and in strength even exceeds perceived credibility, and perceived performance (Holdack et al., Citation2020). The knowledge about what pushes the customers to use and re-use virtual reality glasses for identifying travel destinations is particularly significant in the early diffusion stage and needs to increase in order to support or speed up the technology adoption (Poushneh, Citation2018; Rauschnabel & Ro, Citation2016; Spreer & Kallweit, Citation2014). Customers’ acceptance and perceived enjoyment of the new Fourth Industrial Revolution (4IR) technologies (Nyagadza et al., Citation2022) such as virtual reality glasses for identifying travel destination are a critical element for tourism selection and adoption (Pantano, Citation2014), and can improve conversions by maximising revenues for more future customer reactions (Jung et al., Citation2015).
The conceptual model (Figure ) reflects the distinct paths and connections between the constructs under investigation. The subsequent sections will then provide the formulation of the hypotheses for the present research.
5. Perceived usefulness, perceived ease of use, perceived credibility of virtual reality glasses and attitudes towards the use of virtual reality glasses
To create hypotheses on the applicability of the TAM on virtual reality, it was important to consult prior studies. According to Tait et al. (Citation2019) perceived usefulness (PU) is the extent to which a person believes that using a technology device will improve their satisfaction; this refers to the user’s subjective probability that using a technology will enhance their job performance. In contrast, Davis (Citation1989) ascertains that perceived ease of use (PEOU) refers to the extent to which a person feels that utilising a certain technology would be effortless. Nikhashemi et al. (Citation2021) studied virtual reality predictors of continuance use. There is a finding that the attitude towards virtual reality moderated the association between subjective norms, PU and PEOU, and the desire to utilise virtual reality. Thus, this offered support for adopting the TAM for the study at hand, and the presented hypotheses are deficient in the literature that has identified the relationship between the PU, PEOU, and perceived credibility (PC) of virtual reality glasses and attitudes regarding attitudes regarding actual usage. Credibility relates to the perception that a marketer can produce trustworthy, high-quality content (Chakraborty, Citation2019). According to Herz and Rauschnabel (Citation2019), whereas PC is the degree to which a customer believes that system usage poses no security or privacy risks. Moreover, Ryan (Citation2020) postulates that credibility is closely related to the concept of trust, which relates to individual confidence or reliance. In the context of this study, the word credibility refers to the impression of the legitimacy of the information received by generation Y consumers using virtual reality glasses, as opposed to a direct assessment of the material’s practical quality. Vishwakarma et al. (Citation2020) hypothesised that intention and actual system use are closely related.
For instance, Tamilmani et al. (Citation2022) established that the PU of new technology affects the attitudes of visitors. In line with immersive technologies, Jayawardena et al. (Citation2022) proposed that the external factors of the TAM influence both the PU and PEOU. In addition, authors suggest that behavioural intentions and attitude regarding virtual reality directly impact their inclination to use these sites, which eventually leads to their adoption (Jayawardena et al., Citation2022). Conversely, Chang et al. (Citation2020) hypothesised that virtual reality glasses PEOU directly impacts attitudes about virtual reality glasses usage. Moreover, perception of the usefulness of virtual reality glasses is positively correlated with attitudes toward their actual use (Lo & Cheng, Citation2020). Furthermore, Marino et al. (Citation2020) used virtual reality to examine the credibility and bias of perceived ethnicity in suburban environments. Based on the aforementioned, the following hypotheses are postulated:
H1:
Perceived usefulness of virtual reality glasses positively impacts attitudes towards use of virtual reality glasses
H2:
Perceived ease of use of virtual reality glasses positively impacts attitudes towards use of virtual reality glasses
H3:
Perceived credibility of virtual reality glasses positively impacts attitudes towards use of virtual reality glasses
6. Attitudes towards use of virtual reality glasses and intention towards use of virtual reality glasses
Conforming to the TAM (Davis, Citation1989; Talwar et al., Citation2022), PEOU has a direct influence on behavioural intention and actual use of technology. It is important to note that perceived ease of use effects both behavioural intention and actual usage independently and separately (Baby & Kannammal, Citation2020). While PC is a key predictor of behavioural intentions, as consumers are more likely to use and continue to use products and services that they view as credible. In addition, Gursoy et al. (Citation2019) applied TAM to explain why consumers accept or reject information technology, and they observed that attitude toward usage was correlated with behavioural intention to use. While Syakier and Hanafiah (Citation2022) maintain that influence and attitude are crucial factors in determining the behavioural intentions of visitors. Attitude relates to the consumer’s favourable or negative attitude and appraisal of a product (Davis, Citation1989). Therefore, positive views of generation Y consumers about virtual reality glasses will improve their desire to use virtual reality glasses. This corroborates with the works of de Kervenoael et al. (Citation2020), who established that positive attitudes had a favourable impact on perceived value, which is a combination of economic, social, personal, and functional aspects. Considering this, the following hypothesis is proposed:
H4:
Attitudes towards use of virtual reality glasses have a positive impact on intention towards use of virtual reality.
7. Intention towards use of virtual reality glasses and actual use of virtual reality glasses
It is crucial to understand the connection between the intention to use and actual usage of virtual reality glasses. Previous research has shown a significant correlation between the two variables; for instance, Melián-González et al. (Citation2021) found that consumers’ intentions to adopt or use a technology led to their actual adoption or usage of that technology. In their study, Kim and Ko (Citation2019) established a direct and statistically significance association between behavioural intention and actual virtual reality use. It is believed that the desire to pay for virtual reality glasses is directly related to the perceived usage and value of virtual reality glasses (Marino et al., Citation2020). Hence, the following hypothesis is suggested:
H5:
Intention towards use of virtual reality glasses positively impacts actual use of virtual reality glasses.
8. Perceived performance of virtual reality glasses and actual use of virtual reality glasses
This research includes the variable perceived performance (PP), which is not included in the TAM. This variable was introduced as an external variable for this study. Performance is seen as a broad concept, and collecting the PP created by specific features help consumers to optimize their consumption experience (Sharma et al., Citation2021). In light of technology adoption, PP refers to how rapidly a software feature seems to carry out its intended function (Molino et al., Citation2020). In addition, Dabholkar (Citation1996) proposed an attribute-based strategy centred on service quality. This technique was unique in that it sought to comprehend how an individual’s cognitive evaluation of attributes affected their expectations of perceived performance and actual use. Similarly, Zhang et al. (Citation2019) highlighted that success from the consumer’s viewpoint included customer orientation, process evaluation and improvement, service quality, and service performance in tourism. In accordance with this study, the general perception of generation Y customers’ PP of virtual reality glasses will be based on the technology linked to devices and service delivery. As such, consumers may have a more positive view of the performance of virtual reality glasses if they are efficient, simple to use, reliable, handy, and under the user’s control, given the continual advancements and widespread adoption of innovative technology in our society. Based on the above, the following hypothesis was deduced:
H6:
Perceived performance of virtual reality glasses positively impacts actual use of virtual reality glasses
9. Perceived enjoyment of virtual reality glasses and actual use of virtual reality glasses
Actual use of a particular technology can be viewed as the users’ frequency of usage (Gumpo et al., Citation2020; Rauniar et al., Citation2014). In the current study, actual use of virtual reality glasses by generation Y consumers is directly related to the perceived enjoyment. However, the TAM reflects that the actual use of a novel technology is heavily dependent on the user’s attitude towards the technology, and the perceived enjoyment results from the benefits associated with the same technology (Gumpo et al., Citation2020). The actual use of the virtual glasses by the generation Y consumers immersive virtual environments transform how tourism operators engage with tourists before, during, and after their trip (Ali, Citation2020). However, what matters the most in adoption and actual use of the virtual glasses by the generation Y consumers is lesser implementation complexity, ease of understanding and lesser frustration (Wallace and Sheetz, Citation2012). This is so because of the intangibility, inseparability, and perceived danger associated with holiday experiences making virtual reality devices such as the enhanced glasses, a solid and critical tool for enhancing virtual tourism (Guttentag, Citation2010; Hyun et al., Citation2009). Therefore, it is more priceless and valuable to have an intuitively easy technology for actual usage to avoid general misconceptions and inconveniences associated (Nyagadza, Citation2021). Therefore, it is hypothesised that:
H7:
Perceived enjoyment of virtual reality glasses positively impacts actual use of virtual reality glasses
10. Moderating effects
Apart from the suggested associations shown in the conceptual model, direct and indirect associations between the variables under examination are plausible. This is why, Figure includes perceived performance and perceived enjoyment as moderating variables. Although the hypothesis statements (H1, H2, H3, H4 and H5) established basic relationships between the research variables, a better understanding of the multifaceted associations could shed light on this phenomenon. Empirical research into the role of perceived performance and perceived enjoyment as moderators has been lesser explored (Dewar & Kavussanu, Citation2011; Dorothea-; Brack & Benkenstein, Citation2014; Franque et al., Citation2021). A gap in literature is the lack of research identifying moderators of the “intention—actual use” relationship as indicated by previous studies. This study aims to address this research gap, by investigating how perceived performance of using virtual reality glasses for identifying travel destinations, and perceived enjoyment of using virtual reality glasses for identifying travel destinations moderate the relationship of “intention towards the use of virtual reality glasses for identifying travel destinations—actual use of virtual reality glasses for identifying travel destinations” in the extended TAM model.
Drawing from the above, as much as few studies have examined the moderating role of perceived performance and perceived enjoyment, it is, however, important to mention that there have been no accurate empirical estimates of how perceived performance and perceived enjoyment may influence intention towards the use of virtual reality glasses and actual use of virtual reality glasses for identifying travel destinations in ways that go beyond linear relationships. This leads to the following research questions:
RQ1.
Does perceived performance of using virtual reality glasses for identifying travel destinations moderate the relationship between intention towards the use of virtual reality glasses for identifying travel destinations and actual use of virtual reality glasses for identifying travel destinations.
RQ2.
Does perceived enjoyment of using virtual reality glasses for identifying travel destinations moderate the relationship between intention towards the use of virtual reality glasses for identifying travel destinations and actual use of virtual reality glasses for identifying travel destinations.
By addressing these research questions, a better theoretical understanding is gained of the relationship between intention towards the use of virtual reality glasses for identifying travel destinations and the actual use of virtual reality glasses for identifying travel destinations, and some empirical insights are provided into whether perceived performance and perceived enjoyment of using virtual reality glasses for identifying travel destinations moderately influences these relationships. Therefore, based on the previous elucidations, the following hypothesis is proposed:
H8:
Perceived performance of using virtual reality glasses and significantly moderates the relationship between intention towards the use of virtual reality glasses and actual use of virtual reality glasses for identifying travel destinations.
H9:
Perceived enjoyment of using virtual reality glasses positively and significantly moderates the relationship between intention towards the use of virtual reality glasses and actual use of virtual reality glasses for identifying travel destinations.
11. Methodological aspects
This study was based on a positivism philosophy, using a quantitative approach. It used a deductive approach where the hypothesis was deduced from theory and then expressed in operational terms—many samples were drawn and tested, and the hypothesis were then accepted or rejected. If required, modification was made in the theory. The quantitative research design was appropriate for requesting the necessary data on perceived usefulness of virtual reality glasses, perceived ease of use of virtual reality glasses, perceived credibility of virtual reality glasses, attitudes towards use of virtual reality glasses, intention towards use of virtual reality glasses, actual use of virtual reality glasses, perceived enjoyment of virtual reality glasses and perceived performance of virtual reality glasses. Furthermore, the strategy allows one to investigate the relationships with the constructs used in the research.
11.1. Sample and data collection
The respondents who took part in this research were university students in higher education who had previous exposure to virtual technologies like virtual reality (VR). These participants were especially suitable for helping the researchers achieve the study’s objective. The selection process involved identifying students from public universities in the Gauteng Province of South Africa. The Gauteng province was selected as it has the largest share of the South African student population (Lues & Klerk, Citation2017). The researchers used a method called judgmental sampling, which is also referred to as purposive or subjective sampling. This method involves recruiting participants based on specific screening criteria and their expertise or familiarity with the topic being investigated (Palinkas et al., Citation2015). In this study, judgmental sampling was employed to recruit Generation Y participants who had experience using technologies related to virtual worlds. Additionally, judgmental sampling was used to ensure that the sample included students from different types of university campuses, such as a traditional university, university of technology, and a comprehensive university within the South African Context. The sample size was determined using past studies on Generation Y consumption behaviour. The sample size is consistent with that used in other studies (Maziriri et al., Citation2022; Mdletshe et al., Citation2023; Ntshangase & Ezeuduji, Citation2022). Field workers were enlisted to distribute self-administered surveys among Generation Y students at three campuses. They were tasked with distributing the surveys among the students, ensuring that a representative sample of Generation Y students was reached. During the collection process, the field workers stationed themselves at strategic locations within the campuses, such as entrances or common areas, to engage with the students directly and encourage their participation in the study. This method allowed for face-to-face interaction between the field workers and the students, ensuring a higher response rate and providing an opportunity for any clarifications or queries regarding the survey. Participation in the study was voluntary and no incentives were offered, as this would yield undue influence. Consequently, 550 valid responses out of 600 participants were obtained from the three public universities (refer to Table ).
11.2. Measurement instrument and questionnaire design
To ensure the reliability of the study, the scales adopted in this study were from mature scales that have been verified in relevant literature. Modifications to the scales were made to reflect the study context of virtual reality glasses. The measurement scales, items used, sources, and the Cronbach’s alpha values for the scales are indicated in Table . The scale indicators were affixed to a strongly disagree (1) to strongly agree (5) Likert-scale continuum. For the actual use of virtual reality glasses scale the indicators were affixed as (1) to no extent, (2) to little extent, (3) to some extent, (4) to a large extent and (5) to a very large extent.
Table 1. Survey instruments
11.3. Respondent profile
Fieldwork at the three universities yielded 550 completed questionnaires, a 91.6 percent response rate. The description of the sample is given in Table . Descriptors of the sample included gender, institution, age and province of origin which included students from a traditional university campus (A), a university of technology (B), and a comprehensive university (C). The demographic information in Table indicates that the sample respondents fit the target population definition. The sample comprised female (64%) and male (36%) participants from each of the seven age categories specified, with most participants falling into the 18-year-old age and 19-year-old age category (19% and 18% respectively). There was a relatively even spread of respondents between the three main types of public universities, with 240 from the traditional university (A) (44%), 155 from the university of technology (B) (28%) and 155 from the comprehensive university (C) (28%) campuses. Moreover, each of South Africa’s nine provinces were representative in the sample.
12. Statistical analysis procedure
The investigator used the Statistical Package for Social Science (SPSS) version 28 to evaluate the data pertaining to the demographic profile of the respondents, while the latest software version of SMART-PLS 4 was used to analyse the data captured. PLS-SEM incorporates path coefficients, multi-linear regression, and confirmatory factor analysis (CFA), a second-generation multivariate research technique. This describes the variability in dependent variables by using structural template analysis (Hair et al., Citation2011). PLS SEM works for complex models involving moderation and small samples and is less prone to ordinary multivariate data (Vlačić et al., Citation2019). This research study adopted a reflective measurement model in which measurements represent latent variables and the direction of the connection is from the construct or latent variable to the measure (Diamantopoulos & Winklhofer, Citation2001). The statistical analysis performed in this study includes measures such as: (1) measurement model—testing of reliability analysis and validity analysis, and (2) structural model analysis—examining the path coefficients between observed coefficients.
12.1. Reliability analysis
Table specifies the different measures that were used to assess the reliability and validity of the constructs for the study.
12.2. Measurement model assessment
The outer model was assessed first by values of composite reliability (to assess internal consistency), outer loadings (to assess indicator reliability), and average variance extracted (to assess convergent validity). Composite reliability is an appropriate measure of internal consistency reliability because it accounts for the different outer loadings of the indicator variable. In contrast, Cronbach’s alpha assumes all indicators to be equally reliable (Hair et al., Citation2019). It is vital to indicate that on perceived ease of use of virtual reality glasses one item was deleted, which is PEOVRG3 and on perceived performance of virtual reality glasses three items were also deleted, which are PPOVRG4, PPOVRG5 and PPOVRG5, because the outer loadings were less than 0.5 (Anderson & Gerbing, Citation1988). All the remaining individual item loadings surpassed the recommended value of 0.5 (Anderson & Gerbing, Citation1988). This shows that all measuring instruments are satisfactory and reliable as all items showed convergent validity, with more than 50% of the variance of each item shared with their respective construct (Fraering & Minor, Citation2006). As shown in Table , the Cronbach’s alpha test results ranged between 0.741 and 0.846, which is above the 0.70 benchmark for acceptable internal consistency reliability (Lucas et al., Citation1996). As revealed in the Table results, the lowest composite reliability (CR) value of 0.823 is well above the suggested value of 0.6 (Hulland, Citation1999), while the lowest obtained average variance extracted (AVE) value of 0.659 is also above the recommended value of 0.4 (Anderson & Gerbing, Citation1988). This shows the accomplishment of convergent validity, and further confirms the excellent internal consistency and reliability of the measuring instruments used. As such, a sufficient level of discriminating validity was revealed by all the variables. These results have generally provided evidence of acceptable levels of reliability of the research scale (Chinomona & Chinomona, Citation2013). Lucas et al. (Citation1996) states that discriminant validity refers to items measuring different concepts. Table presents the results of the discriminant validity analysis.
Table 2. Sample demographic characteristics
Table 3. Reliability and validity
Table 4. Discriminant validity (HTMT)
In terms of discriminant validity, all the correlation coefficients of this study fell below 0.70, thereby confirming the theoretical uniqueness of each variable in this research (Lucas et al., Citation1996). In addition, discriminant validity was evaluated using the heterotrait-monotrait ratio (HTMT) criterion (Table ), despite recommendations from previous studies (Henseler et al., Citation2016; Verkijika & De Wet, Citation2018) indicating that HTMT is more suitable to evaluate discriminant validity than Fornell—Larcker’s commonly used criteria. When taking a more conservative position, discriminant validity is reached when the HTMT value is below 0.9 or 0.85 (Neneh, Citation2019; Verkijika & De Wet, Citation2018). Table reveals that the highest obtained HTMT value is 0.791, which is below the conservative value of 0.85. As such, all the constructs meet the criteria for discriminant validity.
12.3. Structural model assessment
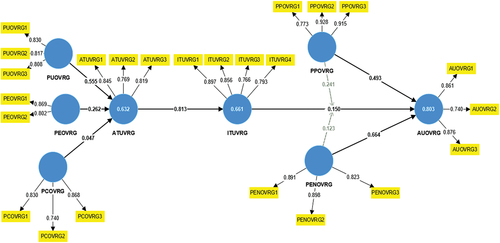
Inner model (structural model) (Figure ) was assessed to test the relationship between the endogenous and exogenous variables. The path coefficients were obtained by applying a non-parametric, bootstrapping routine (Vinzi et al., Citation2010). Precisely, a consistent bootstrapping approach was used because of its reflective—reflective nature. The subsamples selected to run the bootstrapping were 5000, as seen in Figure and Table . The fitness of the model was assessed using the goodness of fit (GoF) and the standardised root mean square residual (SRMR). These indices will be elucidated in the subsequent sections.
12.4. Assessment of the goodness of fit (GoF)
Overall, R2 for attitudes towards use of virtual reality glasses, actual use of virtual reality glasses and intention towards use of virtual reality glasses in Figure indicate that the research model explains 63.2%, 80.3% and 66.1% respectively, of the variance in the endogenous variables. The following formulae was given by Tenenhaus et al. (Citation2005) and the global GoF statistic for the research model was calculated using the equation:
Where AVE represents the average of all AVE values for the research variables while R2 represents the average of all R2 values in the full path model. The calculated global GoF is 0.69, which exceeds the threshold of GoF > 0.36 suggested by Wetzels et al. (Citation2009). Therefore, it can be concluded that the research model has a good overall fit.
12.5. Common method bias (CMB)
For PLS-SEM, common method bias (CMB) is detected through a full collinearity assessment approach (Kock, Citation2015). VIF values should be lower than the 3.3 threshold (Hair et al., Citation2011; Kock, Citation2015). This is indicative that the model is free from common method bias. Any value greater than 3.3 means the model is affected by CMB. Therefore, following standard procedures in business research, the variance inflation factor (VIF) values were computed instead of reporting the collinearity issues in this work. As shown in Table , multicollinearity was evaluated by looking at the variance inflation factor (VIF) and the findings showed that VIF values of all constructs were less than 3.3 (Kock & Lynn, Citation2012). The outcome thus supported the notion that CMB does not seem to be a problem in the investigation.
12.6. The standardised root mean square residual (SRMR)
The SRMR is an index of the average standardised residuals between the observed and the hypothesised covariance matrices (Chen, Citation2007). The SRMR is a measure of estimated model fit. When SRMR = <0.08, then the study model has a good fit (Hu & Bentler, Citation1998); with a lower SRMR being a better fit. The theoretical model’s SRMR was 0.07, which revealed that the model had a good fit, whereas the Chi-Square was equal to 1918.087 and NFI equal to 0.900 was also measured, meeting the recommended threshold for NFI (Maziriri et al., Citation2023).
12.6.1. Coefficient of determination (R2)
The coefficients of determination, or R2 values, were used to assess the research model’s explanatory power. The R2 values for attitudes towards use of virtual reality glasses (R2 = 0.632),
actual use of virtual reality glasses (R2 = 0.803) and intention towards use of virtual reality glasses (R2 = 0.661) were greater than the recommended criterion benchmark of 0.10 (Xu & Li, Citation2008). Thus, the results showed that the exogenous constructs in the research model accurately explained the endogenous constructs.
12.6.2. Predictive relevance (Q2)
In addition to R2 as a predictive criterion, Sarstedt et al. (Citation2021) recommend that researchers examine Q2 to assess the predictive relevance of the structural model. Predictive applicability of constructs must be positive and with values greater than zero (Hair et al., Citation2019). The size of the Q2 effect (in Table ) allows evaluating how an exogenous construct contributes to an endogenous latent construct Q2 as a measure of predictive relevance, which can be small (0.02), medium (0.15) or large (0.35). The Q2 values are explained in Table . The study obtained a Q2 of 0.347 for attitudes towards use of virtual reality glasses, 0.293 for Actual use of virtual reality glasses and 0.254 for Intention towards use of virtual reality glasses, which is within the required limit and supports that the path model’s predictive relevance was adequate for the endogenous construct.
Table 5. Coefficient of determination (R2), effect size (f2) and predictive relevance (Q2)
12.7. Effect size (f2)
Effect size (f2) is a measurement that tells the impact of change in the R2 value when a specified exogenous construct is ignored in the model (Hair et al., Citation2019). An effect size f 2 0.30, 0.3
f 2
0.50 and f 2 >0.50 is thought to represent a weak, moderate and strong effect, respectively.
Effect size is calculated using the following equation:
where, R2 is the coefficient of determination.
From Table , f 2 values for attitudes towards use of virtual reality glasses, actual use of virtual reality glasses and intention towards use of virtual reality glasses are considered strong.
12.8. Path model
The PLS estimation path coefficients values and the item loadings for the research construct, are shown in Figure .
Figure 4. Structural model.
12.9. Hypotheses testing results
After evaluating and concluding the hypothesised measurement and structural model, the next action was to evaluate the cause-and-effect relationships among latent variables through path analysis (Nusair & Hua, Citation2010). In addition, Nusair and Hua (Citation2010) observe that SEM states that specific latent variables directly or indirectly influence other specific latent variables with the model, causing estimation results that depict how these latent variables are associated. For this study, estimation results obtained through hypothesis testing are illustrated in Table . The table demonstrates the proposed hypotheses, path coefficients, t-statistics and whether a hypothesis is rejected or supported. According to Beneke and Blampied (Citation2012), t-values indicate whether a significant relationship exists between variables in the model and path coefficients, demonstrating the strength of the relationships in the model. In addition, Chin (Citation1998) also suggests that t > 1.96 indicates a relationship significance and that higher path coefficients indicate strong relationships among latent variables. Drawing from the results in Table , H1 (β = 0.555; t-stat =8.073), H2 (β = 0.262; t-stat =5.278), H4 (β = 0.813; t-stat =13.969), H5 (β = 0.150; t-stat = 2.173), H6 (β = 0.493; t-stat = 6.937), H7(β = 0.664; t-stat = 9.134), H8 (β = 0.241 t-stat = 4.975) and H9 (β = 0.123 t-stat = 1.997), are supported significantly because the t-statistics are greater than 1.96. However, H3 (β = 0.047; t-stat = 1.174) was rejected as the relationship between perceived credibility of virtual reality glasses and attitudes towards use of virtual reality glasses was insignificant. The reason behind an insignificant relationship perceived credibility of virtual reality glasses and attitudes towards use of virtual reality glasses could be as a result of general nature of beliefs held by customers towards adoption of new emerging technologies in the African context (Kim et al., Citation2020). Further to this, the African continent, specifically in South Africa, desires diversity, is more active and engaged in “physical” trip preparation than prior generations, and is open to use a range of means to get travel information (Xiang et al., Citation2015). This is so because perceived credibility is closely related to the concept of trust, which relates to individual confidence or reliance (Ryan, Citation2020). It is also imperative to note that all the hypothetical relationships presented in the Table found support from the empirical results. Referring to the Chin’s (Citation1998) criterion, model is rated as moderate and is generally considered strong effect size, with variance R2 = 63.2 per cent in ATUVRG, R2 = 66.1 per cent in ITUVRG, and R2 = 80.3 per cent in AUOVRG.
Table 6. Results of structural equation model analysis
12.10. Discussion of results
This study presents a valuable and unique contribution to the field by expanding upon the well-established TAM (Awal et al., Citation2023). By investigating the moderating roles of perceived enjoyment and perceived performance, the study delves into unexplored territory regarding the intention and actual use of virtual reality glasses for identifying travel destinations among Generation Y students in South Africa. The inclusion of perceived enjoyment as a moderating factor offers insights into the pleasure and satisfaction derived from using virtual reality glasses, the intention to use them for travel destination identification. Similarly, the examination of perceived performance as a moderator explores the perception of virtual reality glasses’ effectiveness in accurately and efficiently fulfilling this task. These unique moderating roles shed light on the nuanced dynamics of Generation Y consumers in South Africa, enhancing our understanding of the factors influencing their adoption and usage of virtual reality glasses in the context of travel planning.
Statistical analysis showed that the perceived usefulness of virtual reality glasses has a positive and significant impact on attitudes towards the use of virtual reality glasses. These results propose that virtual reality is a useful tool for Generation Y users and promotes effective destination marketing. By recognizing the perceived usefulness of virtual reality glasses, millennials can harness the power of VR technology to enrich their lives, for instance the exploration of new destinations. Perceived usefulness is the key predictor positively influencing attitudes towards and intention to use VR glasses.
It was also shown that the perceived ease of use of virtual reality glasses had a significant and substantial effect on attitudes towards the use VR glasses. The statistical analysis reveals that when Generation Y individuals perceive virtual reality glasses as easy to use, they positively influence their attitudes towards using them to determine tourist destinations. This indicates that the level of ease associated with operating VR glasses plays a significant role in shaping their perception of this technology and its potential benefits for selecting travel destinations. Also, businesses in the tourism industry could consider incorporating VR technology and promoting the ease of use of VR glasses to target Generation Y travellers. By emphasizing the simplicity and user-friendliness of these devices, they may be able to attract and engage this demographic. The link between perceived ease of use and attitude toward utilising the technology are consistent with the findings of Faqih (Citation2022) and Kim et al. (Citation2021), who found that perceived ease of use had a substantial and favourable influence on attitude and behavioural intention. This is consistent with Pottle’s (Citation2019) statement that VR glasses users would be more amenable to embracing technology if they had a higher appreciation for the programme. Moreover, the results align with the contention of Egger and Neuburger (Citation2020) that consumers who find the use of technology (both mental and physical) effortless are likely to be more inclined to rely heavily on the use of VR glasses than they do to rely on the traditional way of destination marketing.
The study also found that the relationship between perceived credibility of virtual reality glasses and actual use of virtual reality glasses is insignificant. This means that the Generation Y participants’ perception of how trustworthy or reliable virtual reality glasses are does not have a significant impact on their actual usage of the technology. In other words, even if they believe the glasses to be credible, it does not necessarily translate into increased adoption or usage. This result is refuted by the work of Vuong and Khanh (Citation2020) who found that perceived credibility significantly impacts attitudes towards use. Similarly, this discovery differs from the research conducted by Rahaman et al. (Citation2022), which demonstrated that credibility of information is a predictor that helps individuals assess the usefulness of the information when choosing a product or service. In addition, the finding is rebutted with the outcomes by Ying et al. (Citation2022) who highlighted that consumers prefer to emphasize the effectiveness of information if they think it to be highly reputable. Therefore, the observations from the results indicate that the non-significant findings of perceived credibility and actual usage suggest that a specific number of positive or negative crucial occurrences must be present for the use of virtual reality glasses. This observation pattern is demonstrated in research conducted by Su et al. (Citation2020), who discovered that the stronger effect of perceived credibility is due to the fundamental role of trust mediated by perceived credibility.
In addition, the study found that attitudes towards use of virtual reality glasses have a positive and a significant impact on intention towards use of virtual reality. Firstly, the positive impact suggests that individuals within the Generation Y cohort generally hold favourable attitudes towards virtual reality glasses. This could be attributed to various factors, such as their familiarity with technology and their inclination towards adopting new and innovative experiences. It indicates that they view virtual reality glasses as appealing and potentially valuable tools for immersive experiences. Secondly, the significant impact suggests that attitudes towards virtual reality glasses play a crucial role in shaping the intention to use them. In other words, the more positive the attitudes held by individuals within the Generation Y cohort, the more likely they are to express an intention to use virtual reality. This finding underscores the importance of understanding and influencing attitudes when it comes to promoting the adoption and usage of virtual reality technology among this specific group. These results align with Crofton et al. (Citation2019) who found that attitudes towards using VR glasses were directly and positively influenced by both perceived usage and perceived usability of that technology.
Intention towards use of virtual reality glasses has also been found to enhance actual use of virtual reality glasses. In other words, the study found that when members of the Generation Y cohort expressed a stronger intention to use virtual reality glasses, they were more likely to follow through with their intentions and use the glasses. This finding is significant because it highlights the importance of understanding users’ intentions and motivations when studying the adoption and use of virtual reality technology. It suggests that if organizations or developers want to increase the actual use of virtual reality glasses among Generation Y individuals, they should focus on strategies that enhance their intention to use the technology. The results provide valuable insights for researchers, marketers, and developers interested in understanding the factors influencing the adoption and use of virtual reality glasses, particularly within the Generation Y cohort. By considering and promoting factors that drive intention, such as highlighting the benefits, convenience, or novelty of virtual reality experiences, organizations can potentially increase the usage and acceptance of virtual reality glasses among this specific demographic. These results mirror the work of Dangi et al. (Citation2021), who also suggests that BI of third generation (3 G) cellular services positively impacts AU behavior. Furthermore, this supports the findings of Hanafi et al. (Citation2020) who explicate that intention to use multimedia teaching materials was significantly reinforced by attitudes towards using multimedia teaching materials. In addition, the findings are in harmony with the results of Wu et al. (Citation2020) who echoed that intention is a key element in technology use. The results suggest that generation Y consumers are inclined to have positive opinions about wearing virtual reality glasses.
It was also found out that perceived performance of virtual reality glasses positively and significantly impacts actual use of virtual reality glasses. The findings suggest that the Generation Y cohort’s beliefs about the effectiveness, capabilities, and overall quality of virtual reality glasses play a crucial role in determining their adoption and usage patterns. When they have positive perceptions of the glasses’ performance, they are more inclined to engage with the technology and incorporate it into their daily lives. This implies that in order to promote the usage of virtual reality glasses among Generation Y individuals, it is important to focus on enhancing their perception of the device’s performance. This could involve highlighting its features, capabilities, and potential benefits through effective marketing, user testimonials, or demonstrations. These results agree well with the observations by Tortorella et al. (Citation2019) as well as Zhu and Deng (Citation2020) who discovered that perceived performance based on certain attributes is the most important predictor of customer attitudes in the tourism industry. Conversely, the results are congruent with the work of Lin and Yeh (Citation2022) and Buhalis et al. (Citation2019), who found that VR glasses in the tourism industry empower customers to enable meaningful, personalized, richer experiences. Indeed, the wider use of state-of-the-art technology improves the perceived performance of VR glasses and how generation Y customers perceive its quality in providing services (Noohani & Magsi, Citation2020) Therefore, these findings suggest that generation Y consumers prefer technology-enabled service encounters because they perceive better performance as more convenient, efficient, and user-friendly.
This study also found that the perceived enjoyment of virtual reality glasses positively and significantly influences the actual use of virtual reality glasses. These results suggest that among the Generation Y cohort, the level of enjoyment experienced when using virtual reality glasses strongly and significantly impacts their actual usage of these devices. In other words, if individuals within this demographic find virtual reality glasses enjoyable, they are more likely to use them regularly. In the tourism field, these findings are replicated in recent studies, which found that experiencing an entertaining virtual tour and developing awareness of a tourism site aids future travel decision-making (Karim et al., Citation2020; Lekgau et al., Citation2021; Shaukat et al., Citation2022; Zhang et al., Citation2022). This implies that Generation Y consumers are more willing to interact with VR glasses if the system is user-friendly and entertaining. Indeed, the results of this analysis are consistent with the fact that fun usually acts as a positive stimulus to increase users’ intention to play mobile games (Saleem et al., Citation2022).
The statistical analysis showed that the perceived performance of using virtual glasses for identifying travel destinations moderates or strengthens the relationship between intention towards the use of virtual reality glasses for identifying travel destinations and the actual use of virtual reality glasses for identifying travel destinations. The results of the statistical analysis indicate that if Generation Y individuals perceive the virtual glasses to be effective in identifying travel destinations, it will likely strengthen their intention to use the glasses for this purpose, ultimately leading to an increased likelihood of using the virtual reality glasses for travel destination identification. This finding aligns with few international studies (Brack & Benkenstein, Citation2014; Dewar & Kavussanu, Citation2011) that have determined the moderating effect of the perceived performance variable in different contexts. As there are gaps in research on the moderating effect of perceived performance of using virtual reality glasses for identifying travel destinations on the nexus between intention towards the use of virtual reality glasses for identifying travel destinations and the actual use of virtual reality glasses for identifying travel destinations, this study adds a fresh understanding or adds new theoretical knowledge by broadening our understanding of perceived performance as a factor that can stimulate the potential tourist’s intention towards the use of virtual reality glasses for identifying travel destinations. Understanding how the moderating variable (perceived performance of using virtual reality glasses for identifying travel destinations) interacts with the nexus between intention towards the use of virtual reality glass for identifying travel destinations and the actual use of virtual reality glasses for identifying travel destinations is important. For instance, the practical implication of the findings of this study is that if potential tourists perceive the performance of virtual reality glasses positively, their intention to use virtual reality glasses for identifying travel destinations will be positive. Therefore, this will result in using virtual reality glasses to identify travel destinations.
The relative influence of intention towards the use of virtual reality glasses for identifying travel destinations on the actual use of virtual reality glasses for identifying travel destinations is contingent upon the perceived enjoyment of using virtual reality glasses for identifying travel destinations. H9 was statistically significant (p < 0.05) and therefore supported. These results indicate that among the Generation Y cohort, the level of enjoyment experienced when using virtual glasses to identify travel destinations significantly impacts the relationship between their intention to use virtual reality glasses for this purpose and their actual usage. In other words, if Generation Y individuals find the experience enjoyable, it will likely enhance their intention to use the virtual reality glasses and ultimately increase their likelihood of actually using them to identify travel destinations. In a study entitled “Will virtual reality be a double-edged sword? Exploring the moderation effects of the expected enjoyment of a destination on travel intention”, Li and Chen (Citation2019) found out that the relationship between tourists’ perceived ease of use and the usefulness of virtual reality on their travel intention is significantly moderated by expected enjoyment of the enjoyment. As there are gaps in research on the moderating effect of perceived enjoyment on the relationship between intention towards the use of virtual reality glasses for identifying travel destinations and the actual use of virtual reality glasses for identifying travel destinations, this study adds new insights to the body of literature. For instance, the practical implication of the findings of the study is that when the expected enjoyment of the destination is high, higher perceived enjoyment of virtual reality glasses for identifying travel destinations leads to high travel intention and actual use of virtual reality glasses for identifying travel destinations. Therefore, the findings of this study provide evidence that virtual reality glasses for identifying travel destinations will encourage tourists’ travel intention and actual use under certain conditions.
12.11. The interaction plot for the perceived performance of virtual reality glasses moderating variable
To assess the moderating role of perceived performance, this study used a product-indicator-method (PIM) using PLS-SEM (Chin, Citation2010). PIM was used because the suggested moderating construct was continuous (Rigdon et al., Citation1998). Cohen’s (Citation1988) rules were used to assess the moderating effects. Regarding H8 (perceived performance moderates the intention—actual use of virtual reality glasses’ relationship), the interaction terms (β = 0.241, p = 0.000) were significant (Table , Figure ). Hence, H8 was supported.
The interaction plot in Figure presents a better understanding of this association. The slope for the link between intention and actual use moderated by perceived performance of virtual reality glasses showed that the relationship became stronger when there was high perceived performance (Figure ). More specifically, as illustrated in Figure , when perceived performance is high, the impact of intention on actual use of virtual reality glasses tends to be stronger. Figure shows that actual use of virtual reality glasses increases with an increase in intention towards use of virtual reality glasses. However, the increase is more pronounced for individuals (Generation Y consumers) with a high level of perceived performance compared to those with a low level of perceived performance.
Figure 5. Moderation effect of perceived performance of virtual reality glasses.
12.12. The interaction plot for the perceived enjoyment of virtual reality glasses moderating variable
Moreover, the study proposed and empirically supported the view that a perceived enjoyment would be beneficial for the establishment of intention towards use of virtual reality glasses and actual use of virtual reality glasses. This was supported by the significance of the interaction term PENOVRG x ITUVRG ->AUOVRG (β = 0.123, p = 0.030), thus supporting hypothesis H9. The nature of this interaction is presented in Figure .
Figure 6. Moderation effect of perceived enjoyment.
From Figure , it is observed that as intention towards use of virtual reality glasses increases, its influence on the actual use of virtual reality glasses is more pronounced for individuals with a high level of perceived enjoyment of virtual reality glasses than for those with low levels of perceived enjoyment of virtual reality glasses.
12.13. Theoretical implications
This study contributes theoretically to the domain with the assistance of extending the original TAM. By extending the TAM model and incorporating perceived enjoyment and perceived performance, this study contributes to the literature by providing a more comprehensive and contextually relevant framework. To the best of the authors’ knowledge, no significant study was conducted earlier by incorporating actual use of virtual reality glasses and perceived performance and perceived enjoyment of virtual reality glasses in TAM model together to extend and modify the existing original research paradigm as well as to predict Generation Y consumers’ actual use of virtual reality glasses for identifying travel destinations especially in an emerging economic context.
The present study’s theoretical framework uses an extended TAM model which provides a comprehensive framework for understanding the factors that influence Generation Y consumers’ intentions to adopt and use virtual reality glasses for identifying travel destinations. By incorporating perceived enjoyment as a moderating factor, the study seeks to explore how the pleasure and satisfaction experienced by Generation Y consumers when using virtual reality glasses can influence their intention to use them for identifying travel destinations. It is hypothesized that if perceived enjoyment is high, it will strengthen the positive relationship between intention and actual use of virtual reality glasses for identifying travel destinations, indicating that the more enjoyable the experience, the more likely Generation Y consumers in South Africa will use virtual reality glasses for identifying travel destinations. Rosli et al. (Citation2023) stated that the uses of an extended TAM by incorporating some sorts of individual features of the study respondents to develop theoretical framework of the study accelerate the application of a robust theory in the field of social science research. Thus, this study has noteworthy theoretical contribution especially in the IT domain which will create opportunity for future re-extension and re-modification of originality developed TAM to ensure more rigorous study.
12.14. Practical implications
The findings from this study will not only advance theoretical knowledge but also offer practical implications for marketers, destination management organizations, and technology developers seeking to understand and cater to the needs and preferences of Generation Y consumers in South Africa when it comes to utilizing virtual reality glasses for travel destination determination. Firstly, understanding the role the role of perceived enjoyment can guide marketers and destination management organizations in designing virtual reality experiences that are engaging, immersive and enjoyable for Generation Y consumers. By enhancing the pleasure and satisfaction derived from using virtual reality glasses, practitioners can increase the likelihood of these consumers intention to use them for identifying travel destinations. Additionally, the study’s focus on perceived performance offers practical insights into the effectiveness and efficiency of virtual reality glasses in accurately showcasing tourism destinations. Practitioners can leverage this information to highlight the reliability and credibility of virtual reality experiences in helping users make informed decisions about their travel plans. By emphasizing the perceived performance of virtual reality glasses, practitioners can build trust and confidence among Generation Y consumers, leading to a higher likelihood of actual usage for travel destination identification. Furthermore, the study underscores the benefits of virtual reality glasses in determining tourism destinations. Practitioners can emphasize these advantages in their marketing efforts, highlighting how virtual reality glasses provide a realistic and immersive experience that allows Generation Y consumers to explore and evaluate different destinations before making travel decisions. By showcasing the benefits of virtual reality glasses, practitioners can attract Generation Y consumers by offering them a unique and interactive way to engage with tourism offerings. Overall, the practical implications of this study revolve around enhancing the design and promotion of virtual reality experiences for tourism destination identification. By considering the factors of perceived enjoyment and perceived performance, practitioners can create more engaging more engaging and effective virtual reality solutions, ultimately leading to increased adoption and usage of virtual reality glasses among Generation Y consumers in the context of travel planning.
12.15. Limitations and directions for future research
As with all previous studies, the current research has some limitations. First, it is a cross-sectional investigation that does not illustrate how users’ Intention towards use and actual use of virtual reality glasses behavior can be changed over time, as this research represents only a particular time frame. Therefore, it is recommended to conduct longitudinal research. The study also has limitations which may affect the generalisability of the results, since they can only be applied to the population studied. Complementary research studies can be done in other parts of the world to be able to come up with cross-cultural comparisons, as well as methodological validation. Despite the current study’s limitations, the results have contributed to the better understanding of the factors influencing the intentions to use virtual reality glasses and the actual use of virtual reality glasses. The results hopefully may influence further future research study inquiries.
13. Conclusion
This research introduces a fresh look related to 4IR technology precisely virtual reality glasses by the extended TAM model. The study was also carried out in a field that has received little attention: the utilization of virtual reality within the tourism industry. The study was carried out in an emerging country such as South Africa, where the Generation Y cohort’s use of virtual reality glasses has received limited research efforts. The results of this study may be useful given the existing literature on the subject, which will lead to a better understanding of the link between the use of virtual reality glasses and their perceived performance and enjoyment. In addition, implications of the expanded theory can clarify how Generation Y interacts with virtual reality glasses and assist in designing and marketing VR glasses more effectively for this generation. This could help tourism destinations optimize their virtual reality technology and increase customer loyalty. Furthermore, it could also help shape the future of the tourism industry as virtual reality technology is increasingly being integrated into the customer experience. As a result, this could lead to the creation of tailored adoption strategies for VR technology among the Generation Y cohort.
Disclosure statement
No potential conflict of interest was reported by the author(s).
Additional information
Notes on contributors
Eugine Tafadzwa Maziriri
Eugine Tafadzwa Maziriri (Ph.D) is currently a Senior Lecturer in the Department of Business Management at the University of Johannesburg (UJ) in Johannesburg, South Africa. He is a Y rated scientist of the National Research Foundation (NRF). He is a entrepreneurship, small business management and entrepreneurial marketing researcher who has produced several papers in these fields in prestigious journals such European Journal of Innovation Management (Emerald Insight, UK), European Journal of Management Studies (Emerald Insight, UK), Gender in Management: An International Journal (Emerald Insight, UK), Journal of Public Affairs (Wiley, USA), Data in Brief (Elsevier), Global Journal of Emerging Market Economies (SAGE, London, UK), Arab Gulf Journal of Scientific Research (Emerald Insight, UK), PSU Research Review: An International Interdisciplinary Journal (Emerald Insight, UK), Cogent Business and Management, and Cogent Psychology (Taylor & Francis, England & Wales, UK), among others. He has also presented papers at local and international conferences. Furthermore, he has supervised over 25 honour students, 10 master’s students and 2 PhD students. He earned his PhD in Business Sciences from the University of Witwatersrand, Johannesburg, South Africa. Also, he sits on the editorial board of the Southern African Journal of Entrepreneurship and Small Business Management (SAJESBM). Moreover, he currently has 1231 citations to his research works, and reflect a Google scholar h-index of 19 and an i-10 index of 27. Email: [email protected]
Matilda Modjadji Mashapa
Matilda Mashapa Matilda Modjadji Mashapa is a lecturer and PhD candidate at the School of Tourism and Hospitality, University of Johannesburg. She holds a Masters in Tourism and hospitality management from the Vaal University of Technology. Her research interests are tourism technologies, consumer behaviour and sustainability. She is a member of the International Federation for IT and Travel and Tourism (IFITT). Email: [email protected]
Brighton Nyagadza
Brighton Nyagadza (CIM, Ph.D) is a full time lecturer and A/Chairperson department of marketing (digital marketing) at Marondera University of Agricultural Sciences and Technology (MUAST), Zimbabwe, full member of the Marketers Association of Zimbabwe (MAZ), an Associate of The Chartered Institute of Marketing (ACIM), United Kingdom and Power Member of the Digital Marketing Institute (DMI), Dublin, Ireland. He has published several book chapters in Routledge books of Taylor & Francis Publishers, New York (USA), Emerald Insight, United Kingdom (UK), Lexington books of the Rowan & Littlefield Publishers, Maryland (USA) and in reputable international journals such as Journal of Digital Media & Policy (Intellect), Sustainable Technology & Entrepreneurship (Elsevier), Journal of Fashion Marketing & Management (Emerald), Journal of Environmental Media (Intellect), European Journal of Innovation Management (Emerald), Africa Review (Brill), Journal of Entrepreneurship In Emerging Economies (Emerald), Tourism Critiques: Practice & Theory (Emerald), Journal of Asian & African Studies (SAGE), Youth & Society (SAGE), Quality Assurance in Education (Emerald), PSU Research Review (Emerald), International Journal of Public Sector Management (Emerald), The Marketing Review (Westburn), among others. Brighton sits on various international academic and national strategic boards including the Mashonaland East Province Zimbabwe National Development Strategy (NDS) Committee (2021-2025) – ICT & Human Capital Development cohort. Email: [email protected]
Brian Mabuyana
Brian Mabuyana holds an M.Com in Business Management from the Nelson Mandela University. He is a PhD candidate in Business Management at the University of the Free State. His research interests are chat banking, digital marketing, branding, entrepreneurship and consumer behaviour. Email: [email protected]
References
- Ajzen, I., & Fishbein, M. (1975). A Bayesian analysis of attribution processes. Psychological Bulletin, 82(2), 261. https://doi.org/10.1037/h0076477
- Ali, S. A. E. (2020). Gamification impact on enhancing visiting entertainment destination: The case of Siwa Oasis. International Journal of Heritage, Tourism, and Hospitality, 14(3), 270–31. https://doi.org/10.21608/ijhth.2020.153626
- Anderson, J. C., & Gerbing, D. W. (1988). Structural equation modeling in practice: A review and recommended two-step approach. Psychological Bulletin, 103(3), 411. https://doi.org/10.1037/0033-2909.103.3.411
- Awal, M. R., Arzin, T. A., Islam, M. M., & Hasan, M. T. (2023). Understanding railway passengers’ E-ticketing usage intention in an emerging economic context: Application of an extended technology acceptance model. Arab Gulf Journal of Scientific Research. https://doi.org/10.1108/AGJSR-12-2022-0294
- Baby, A., & Kannammal, A. (2020). Network path analysis for developing an enhanced TAM model: A user-centric e-learning perspective. Computers in Human Behavior, 107, 106081. https://doi.org/10.1016/j.chb.2019.07.024
- Balogun, V., Thompson, A., & Sarumi, O. (2010). A 3D geo-spatial virtual reality system for virtual tourism. The Pacific Journal of Science and Technology, 11, 601–609.
- Beneke, J., & Blampied, S. (2012). Driving consumer perceptions through Facebook: An investigation into empowering brands in the 21st century. In J. M. M. van den Berg (Ed.), Conference proceedings of the 24th annual conference of SAIMS – 2012 (pp. 47–61) Stellenbosch University, Stellenbosch, September 09-11, 2012.
- Bordnick, P. S., Carter, B. L., & Traylor, A. C. (2011). What virtual reality research in addictions can tell us about the future of obesity assessment and treatment. Journal of Diabetes Science and Technology, 5(1), 265–271. https://doi.org/10.1177/193229681100500210
- Brack, D. A., & Benkenstein, M. (2014). Responses to other similar customers in a service setting–analyzing the moderating role of perceived performance risk. Journal of Services Marketing, 28(2), 138–146. https://doi.org/10.1108/JSM-05-2012-0089/
- Buhalis, D., Harwood, T., Bogicevic, V., Viglia, G., Beldona, S., & Hofacker, C. (2019). Technological disruptions in services: Lessons from tourism and hospitality. Journal of Service Management, 30(4), 484–506. https://doi.org/10.1108/JOSM-12-2018-0398
- Chakraborty, U. (2019). The impact of source credible online reviews on purchase intention: The mediating roles of brand equity dimensions. Journal of Research in Interactive Marketing, 13(2), 142–161. https://doi.org/10.1108/JRIM-06-2018-0080
- Chang, C. W., Yeh, S. C., & Li, M. (2020). The adoption of a virtual reality–assisted training system for mental rotation: A partial least square structural equation modeling approach. JMIR Serious Games, 8(1), 14548. https://doi.org/10.2196/14548
- Chen, F. F. (2007). Sensitivity of goodness of fit indexes to lack of measurement invariance. Structural Equation Modeling: A Multidisciplinary Journal, 14(3), 464–504. https://doi.org/10.1080/10705510701301834
- Cheong, R. (1995). The virtual threat to travel and tourism. Tourism Management, 16(6), 417–422. https://doi.org/10.1016/0261-5177(95)00049-T
- Chin, W. W. (1998). Commentary: Issues and opinion on structural equation modeling. MIS Quarterly, 22(1), vii–xvi.
- Chin, W. W. (2010). How to write up and report PLS analyses. In Handbook of partial least squares (pp. 655–690). Springer Berlin Heidelberg. https://doi.org/10.1007/978-3-540-32827-8_29
- Chinomona, R., & Chinomona, E. (2013). The influence of employees’ perceptions of organizational politics on turnover intentions in Zimbabwe’s SME sector. South African Journal of Business Management, 44(2), 15–24. https://doi.org/10.4102/sajbm.v44i2.156
- Cohen, J. (1988). Statistical power analysis for the behavioral sciences (2nd ed.). Lawrence Erlbaum Associates.
- Cohen, E., & Cohen, S. A. (2012). Authentication: Hot and cool. Annals of Tourism Research, 3(3), 1295–1314. https://doi.org/10.1016/j.annals.2012.03.004
- Crofton, E. C., Botinestean, C., Fenelon, M., & Gallagher, E. (2019). Potential applications for virtual and augmented reality technologies in sensory science. Innovative Food Science & Emerging Technologies, 56, 102178. https://doi.org/10.1016/j.ifset.2019.102178
- Dabholkar, P. A. (1996). Consumer evaluations of new technology-based self-service options: An investigation of alternative models of service quality. International Journal of Research in Marketing, 13(1), 29–51. https://doi.org/10.1016/0167-8116(95)00027-5
- D’Ambra, J., & Wilson, C. S. (2004). Explaining perceived performance of the World Wide Web: Uncertainty and the task‐technology fit model. Internet Research, 14(4), 294–310. https://doi.org/10.1108/10662240410555315
- Dangi, R., Lalwani, P., Choudhary, G., You, I., & Pau, G. (2021). Study and investigation on 5G technology: A systematic review. Sensors, 22(1), 26. https://doi.org/10.3390/s22010026
- Davis, F. D. (1989). Perceived usefulness, perceived ease of use, and user acceptance of information technology. MIS Quarterly, 13(3), 319–340. https://doi.org/10.2307/249008
- de Kervenoael, R., Hasan, R., Schwob, A., & Goh, E. (2020). Leveraging human-robot interaction in hospitality services: Incorporating the role of perceived value, empathy, and information sharing into visitors’ intentions to use social robots. Tourism Management, 78, 104042. https://doi.org/10.1016/j.tourman.2019.104042
- Dewar, A. J., & Kavussanu, M. (2011). Achievement goals and emotions in golf: The mediating and moderating role of perceived performance. Psychology of Sport and Exercise, 12(5), 525–532. https://doi.org/10.1016/j.psychsport.2011.05.005
- Diamantopoulos, A., & Winklhofer, H. M. (2001). Index construction with formative indicators: An alternative to scale development. Journal of Marketing Research, 38(2), 269–277. https://doi.org/10.1509/jmkr.38.2.269.18845
- Doney, P. M., & Cannon, J. P. (1997). An examination of the nature of trust in buyer–seller relationships. Journal of Marketing, 61(2), 35–51. https://doi.org/10.1177/002224299706100203
- Egger, R., & Neuburger, L. (2020). Augmented, virtual, and mixed reality in tourism. Handbook of E-Tourism, 1–25.
- Faqih, K. M. (2022). Factors influencing the behavioral intention to adopt a technological innovation from a developing country context: The case of mobile augmented reality games. Technology in Society, 69, 101958. https://doi.org/10.1016/j.techsoc.2022.101958
- Filieri, R. (2015). What makes online reviews helpful? A diagnosticity-adoption framework to explain informational and normative influences in e-WOM. Journal of Business Research, 68(6), 1261–1270. https://doi.org/10.1016/j.jbusres.2014.11.006
- Filieri, R. (2016). What makes an online consumer review trustworthy? Annals of Tourism Research, 58, 46–64. https://doi.org/10.1016/j.annals.2015.12.019
- Fraering, M., & Minor, M. S. (2006). Sense of community: An exploratory study of US consumers of financial services. International Journal of Bank Marketing, 24(5), 284–306. https://doi.org/10.1108/02652320610681738
- Franque, F. B., Oliveira, T., Tam, C., & Santini, F. D. O. (2021). A meta-analysis of the quantitative studies in continuance intention to use an information system. Internet Research, 31(1), 123–158. https://doi.org/10.1108/INTR-03-2019-0103
- Golja, T., & Paulišić, M. (2021). Managing-technology enhanced tourist experience: The case of scattered hotels in Istria. Management: Journal of Contemporary Management Issues, 26(1), 63–95. https://doi.org/10.30924/mjcmi.26.1.5
- Gumpo, C. I. V., Chuchu, T., Maziriri, E. T., & Madinga, N. W. (2020). Examining the usage of Instagram as a source of information for young consumers when determining tourist destinations. South African Journal of Information Management, 22(1), 1–11. https://doi.org/10.4102/sajim.v22i1.1136
- Gupta, K. P., Manrai, R., & Goel, U. (2019). Factors influencing adoption of payments banks by Indian customers: Extending UTAUT with perceived credibility. Journal of Asia Business Studies, 13(20), 173–195. https://doi.org/10.1108/JABS-07-2017-0111
- Gursoy, D., Chi, O. H., Lu, L., & Nunkoo, R. (2019). Consumers acceptance of artificially intelligent (AI) device use in service delivery. International Journal of Information Management, 49, 157–169. https://doi.org/10.1016/j.ijinfomgt.2019.03.008
- Guttentag, D. A. (2010). Virtual reality: Applications and implications for tourism. Tourism Management, 31(5), 637–651. https://doi.org/10.1016/j.im.2013.12.003
- Hair, J. F., Ringle, C. M., & Sarstedt, M. (2011). PLS-SEM: Indeed, a silver bullet. Journal of Marketing Theory & Practice, 19(2), 137–149. https://doi.org/10.2753/MTP1069-6679190202
- Hair, J. F., Risher, J. J., Sarstedt, M., & Ringle, C. M. (2019). When to use and how to report the results of PLS-SEM. European Business Review, 31(1), 2–24. https://doi.org/10.1108/EBR-11-2018-0203
- Hanafi, Y., Murtadho, N., Ikhsan, M. A., & Diyana, T. N. (2020). Reinforcing Public University student’s worship education by developing and implementing mobile-learning Management system in the ADDIE Instructional design model. International Journal of Interactive Mobile Technologies (iJim), 14(2), 215–241. https://doi.org/10.3991/ijim.v14i02.11380
- Hannam, K., Butler, G., & Paris, C. M. (2014). Developments and key issues in tourism mobilities. Annals of Tourism Research, 44, 171–185. https://doi.org/10.1016/j.annals.2013.09.010
- Henseler, J., Hubona, G., & Ray, P. A. (2016). Using PLS path modeling in new technology research: Updated guidelines. Industrial Management and Data Systems, 116(1), 2–20. https://doi.org/10.1108/IMDS-09-2015-0382
- Herz, M., & Rauschnabel, P. A. (2019). Understanding the diffusion of virtual reality glasses: The role of media, fashion and technology. Technological Forecasting and Social Change, 138, 228–242. https://doi.org/10.1016/j.techfore.2018.09.008
- Holdack, E., Lurie-Stoyanov, K., & Fromme, H. F. (2020). The role of perceived enjoyment and perceived informativeness in assessing the acceptance of AR wearables. Journal of Retailing and Consumer Services, 65, 102259. https://doi.org/10.1016/j.jretconser.2020.102259
- Hu, L. T., & Bentler, P. M. (1998). Fit indices in covariance structure modeling: Sensitivity to underparameterized model misspecification. Psychological Methods, 3(4), 424–453. https://doi.org/10.1037/1082-989X.3.4.424
- Hulland, J. (1999). Use of partial least squares (PLS) in strategic management research: A review of four recent studies. Strategic Management Journal, 20(2), 195–204. https://doi.org/10.1002/(SICI)1097-0266(199902)20:2<195:AID-SMJ13>3.0.CO;2-7
- Hyun, J. S., Woodman, G. F., Vogel, E. K., Hollingworth, A., & Luck, S. J. (2009). The comparison of visual working memory representations with perceptual inputs. Journal of Experimental Psychology: Human Perception and Performance, 35(4), 11–40. https://doi.org/10.1037/a0015019
- Jayawardena, C., Albattat, A., & Jaharadak, A. A. (2022). Issues and challenges in technology application in the Asian tourism industry. Handbook of Technology Application in Tourism in Asia, 1125–1142.
- Jayawardena, N. S., Thaichon, P., Quach, S., Razzaq, A., & Behl, A. (2023). The persuasion effects of virtual reality (VR) and augmented reality (AR) video advertisements: A conceptual review. Journal of Business Research, 160, 113739. https://doi.org/10.1016/j.jbusres.2023.113739
- Jou, M., & Wang, J. (2013). Investigation of effects of virtual reality environments on learning performance of technical skills. Computers in Human Behavior, 29(2), 433–438. https://doi.org/10.1016/j.chb.2012.04.020
- Jung, T., Chung, N., & Leue, M. C. (2015). The determinants of recommendations to use augmented reality technologies: The case of a Korean theme park. Tourism Management, 49, 75–86. https://doi.org/10.1016/j.tourman.2015.02.013
- Jung, T., Tom Dieck, M. C., Lee, H., & Chung, N. (2016). Effects of virtual reality and augmented reality on visitor experiences in museum. Information & Communication Technologies in Tourism, 621–635.
- Kang, H. J., Shin, J., & Ponto, K. (2020). How 3D virtual reality stores can shape consumer purchase decisions: The roles of informativeness and playfulness. Journal of Interactive Marketing, 49(1), 70–85. https://doi.org/10.1016/j.intmar.2019.07.002
- Karim, M. W., Haque, A., Ulfy, M. A., Hossain, M. A., & Anis, M. Z. (2020). Factors influencing the use of E-wallet as a payment method among Malaysian young adults. Journal of International Business and Management, 3(2), 1–12.
- Kim, J., & Forsythe, S. (2008). Adoption of virtual try-on technology for online apparel shopping. Journal of Interactive Marketing, 22(2), 45–59. https://doi.org/10.1002/dir.20113
- Kim, J. H., Kim, M., Park, M., & Yoo, J. (2021). How interactivity and vividness influence consumer virtual reality shopping experience: The mediating role of telepresence. Journal of Research in Interactive Marketing, 15(3), 502–525. https://doi.org/10.1108/JRIM-07-2020-0148
- Kim, D., & Ko, Y. J. (2019). The impact of virtual reality (VR) technology on sport spectators’ flow experience and satisfaction. Computers in Human Behavior, 93, 346–356. https://doi.org/10.1016/j.chb.2018.12.040
- Kim, M. J., Lee, C.-K., & Jung, T. (2020). Exploring consumer behavior in virtual reality tourism using an extended stimulus-organism-response model. Journal of Travel Research, 59(1), 69–89. https://doi.org/10.1177/0047287518818915
- Kim, J. H., & Song, H. (2020). The influence of perceived credibility on purchase intention via competence and authenticity. International Journal of Hospitality Management, 90, 102617. https://doi.org/10.1016/j.ijhm.2020.102617
- Kock, N. (2015). Common method bias in PLS-SEM: A full collinearity assessment approach. International Journal of E-Collaboration, 11(4), 1–10. https://doi.org/10.4018/ijec.2015100101
- Kock, N., & Lynn, G. (2012). Lateral collinearity and misleading results in variance-based SEM: An illustration and recommendations. Journal of the Association for Information Systems, 13(7), 546–580. https://doi.org/10.17705/1jais.00302
- Lekgau, R. J., Harilal, V., & Feni, A. (2021). Reimagining tourism: COVID-19 and the potential for virtual tourism in South Africa. African Journal of Hospitality, Tourism & Leisure, 10(4), 1516–1532. https://doi.org/10.46222/ajhtl.19770720.176
- Lemon, K. N., & Verhoef, P. C. (2016). Understanding customer experience throughout the customer journey. Journal of Marketing, 80(6), 69–96. https://doi.org/10.1509/jm.15.0420
- Li, T., & Chen, Y. (2019). Will virtual reality be a double-edged sword? Exploring the moderation effects of the expected enjoyment of a destination on travel intention. Journal of Destination Marketing & Management, 12, 15–26. https://doi.org/10.1016/j.jdmm.2019.02.003
- Lin, L. Z., & Yeh, H. R. (2022). Using ZMET to explore consumers’ cognitive model in virtual reality: Take the tourism experience as an example. Current Issues in Tourism, 26(14), 1–15. https://doi.org/10.1080/13683500.2022.2084048
- Lo, W. H., & Cheng, K. L. B. (2020). Does virtual reality attract visitors? The mediating effect of presence on consumer response in virtual reality tourism advertising. Information Technology & Tourism, 22(4), 537–562. https://doi.org/10.1007/s40558-020-00190-2
- Lok, C. K. (2015). Adoption of smart card-based e-payment system for retailing in Hong Kong using an extended technology acceptance model. E-Services Adoption: Processes by Firms in Developing Nations (Advances in Business Marketing and Purchasing), 23, 255–466. https://doi.org/10.1108/S1069-09642015000023B003
- Loureiro, S. M. C., Guerreiro, J., Eloy, S., Langaro, D., & Panchapakesan, P. (2019). Understanding the use of virtual reality in marketing: A text mining-based review. Journal of Business Research, 100, 514–530. https://doi.org/10.1016/j.jbusres.2018.10.055
- Lucas, R. E., Diener, E., & Suh, E. (1996). Discriminant validity of well-being measures. Journal of Personality and Social Psychology, 71(3), 616. https://doi.org/10.1037/0022-3514.71.3.616
- Lues, H., & Klerk, N. D. (2017). Gender differences in brand loyalty towards fashion brands among Generation Y students. International Journal of Business and Management Studies, 9(2), 52–68. https://dergipark.org.tr/en/pub/ijbms/issue/36089/405220
- Lugosi, P. (2016). Socio-technological authentication. Annals of Tourism Research, 58, 100–113. https://doi.org/10.1016/j.annals.2016.02.015
- Marakarkandy, B., Yajnik, N., & Dasgupta, C. (2017). Enabling internet banking adoption: An empirical examination with an augmented technology acceptance model (TAM). Journal of Enterprise Information Management, 30(2), 263–294. https://doi.org/10.1108/JEIM-10-2015-0094
- Marino, M. I., Bilge, N., Gutsche, R. E., Jr., & Holt, L. (2020). Who is credible (and where)? Using virtual reality to examine credibility and bias of perceived race/ethnicity in urban/suburban environments. Howard Journal of Communications, 31(3), 297–315. https://doi.org/10.1080/10646175.2020.1714514
- Mashapa, M. M., & Dube, K. K. (2023). Tourism Recovery strategies from COVID 19 within parks in Western Cape, South Africa. In COVID 19, Tourists Destination and Prospects for Recovery: Volume Two, An African Perspective (pp. 205–223). Springer International.
- Maziriri, E. T., Nyagadza, B., Mabuyana, B., Rukuni, T. F., & Mapuranga, M. (2023). Marketing cereal to the generation Z cohort: What are the key drivers that stimulate consumer behavioural intentions in South Africa? Young Consumers, ahead-of-print. https://doi.org/10.1108/YC-10-2022-1625
- Maziriri, E. T., Nyagadza, B., Mapuranga, M., & Maramura, T. C. (2022). Habitual Facebook use as a prognosticator for life satisfaction and psychological well-being: Social safeness as a moderator. Arab Gulf Journal of Scientific Research, 40(2), 153–179. https://doi.org/10.1108/AGJSR-04-2022-0011
- McLean, G., AlYahya, M., Barhorst, J. B., & Osei-Frimpong, K. (2023). Examining the influence of virtual reality tourism on consumers’ subjective wellbeing. Tourism Management Perspectives, 46. https://doi.org/10.1016/j.tmp.2023.101088
- Mdletshe, S., Tlapana, T., & Hawkins-Mofokeng, R. (2023). Adoption of Facebook as a Communication tool amongst University millennials in KwaZulu-Natal. African Journal of Inter/Multidisciplinary Studies, 5(1), 1–9. https://doi.org/10.51415/ajims.v5i1.1104
- Melián-González, S., Gutiérrez-Taño, D., & Bulchand-Gidumal, J. (2021). Predicting the intentions to use chatbots for travel and tourism. Current Issues in Tourism, 24(2), 192–210. https://doi.org/10.1080/13683500.2019.1706457
- Molino, M., Cortese, C. G., & Ghislieri, C. (2020). The promotion of technology acceptance and work engagement in industry 4.0: From personal resources to information and training. International Journal of Environmental Research and Public Health, 17(7), 2438. https://doi.org/10.3390/ijerph17072438
- Neneh, B. N. (2019). From entrepreneurial intentions to behavior: The role of anticipated regret and proactive personality. Journal of Vocational Behavior, 112, 311–324. https://doi.org/10.1016/j.jvb.2019.04.005
- Neuburger, L., Beck, J., & Egger, R. (2018). The ‘Phygital’tourist experience: The use of augmented and virtual reality in destination marketing. Tourism Planning and Destination Marketing, 183–202.
- Nikhashemi, S. R., Knight, H. H., Nusair, K., & Liat, C. B. (2021). Augmented reality in smart retailing: A (n)(A) Symmetric approach to continuous intention to use retail brands’ mobile AR apps. Journal of Retailing and Consumer Services, 60, 102464. https://doi.org/10.1016/j.jretconser.2021.102464
- Noohani, M. Z., & Magsi, K. U. (2020). A review of 5G technology: Architecture, security and wide applications. International Research Journal of Engineering & Technology (IRJET), 7(5), 3440–3471.
- Ntshangase, S. D., & Ezeuduji, I. O. (2022). The impact of entrepreneurship education on tourism students’ entrepreneurial intention in South Africa. Journal of Teaching in Travel & Tourism, 23(3), 1–19. https://doi.org/10.1080/15313220.2022.2132343
- Nusair, K., & Hua, N. (2010). Comparative assessment of structural equation modeling and multiple regression research methodologies: E-commerce context. Tourism Management, 31(3), 314–324. https://doi.org/10.1016/j.tourman.2009.03.010
- Nyagadza, B. (2021). Fourth Industrial Revolution. Management Education and Automation, 3, 29.
- Nyagadza, B., Chuchu, T., & Chigora, F. (2022). 9 technology application in tourism Events. Digital Transformation and Innovation in Tourism Events.
- Nyagadza, B., Pashapa, R., Chare, A., Mazuruse, G., & Hove, P. K. (2022). Digital technologies, Fourth Industrial Revolution (4IR) & global value Chains (GVCs) nexus with emerging economies’ future industrial innovation dynamics. Cogent Economics & Finance, 10(1), 2014654. https://doi.org/10.1080/23322039.2021.2014654
- Onderdijk, K. E., Bouckaert, L., Van Dyck, E., & Maes, P. J. (2023). Concert experiences in virtual reality environments. Virtual Reality, 27(3), 2383–2396. https://doi.org/10.1007/s10055-023-00814-y
- Palinkas, L. A., Horwitz, S. M., Green, C. A., Wisdom, J. P., Duan, N., & Hoagwood, K. (2015). Purposeful sampling for qualitative data collection and analysis in mixed method implementation research. Administration and Policy in Mental Health and Mental Health Services Research, 42(5), 533–544. https://doi.org/10.1007/s10488-013-0528-y
- Pantano, E. (2014). Innovation drivers in retail industry. International Journal of Information Management, 34(3), 344–350. https://doi.org/10.1016/j.ijinfomgt.2014.03.002
- Pantano, E., & Servidio, R. (2011). An exploratory study of the role of pervasive environments for promotion of tourism destinations. Journal of Hospitality & Tourism Technology, 2(1), 50–65. https://doi.org/10.1108/17579881111112412
- Pasanen, K., Pesonen, J., Murphy, J., Heinonen, J., & Mikkonen, J. (2019). Comparing tablet and virtual reality glasses for watching nature tourism videos. In Information and Communication Technologies in Tourism 2019: Proceedings of the International Conference in Nicosia. Cyprus, January 30–February 1, 2019 (pp. 120–131). Springer International Publishing.
- Pencarelli, T., Gabbianelli, L., & Savelli, E. (2020). The tourist experience in the digital era: The case of Italian millennials. Sinergie Italian Journal of Management, 38(3), 165–190. https://doi.org/10.7433/s113.2020.10
- Pestek, A., & Sarvan, M. (2020). Virtual reality and modern tourism. Journal of Tourism Futures, 7(2), 245–250. https://doi.org/10.1108/JTF-01-2020-0004
- Pottle, J. (2019). Virtual reality and the transformation of medical education. Future Healthcare Journal, 6(3), 181. https://doi.org/10.7861/fhj.2019-0036
- Poushneh, A. (2018). Augmented reality in retail: A trade-off between user’s control of access to personal information and augmentation quality. Journal of Retailing and Consumer Services, 41, 169–176. https://doi.org/10.1016/j.jretconser.2017.12.010
- Rahaman, M. A., Hassan, H. K., Asheq, A. A., & Islam, K. A. (2022). The interplay between eWOM information and purchase intention on social media: Through the lens of IAM and TAM theory. PloS One, 17(9), 0272926. https://doi.org/10.1371/journal.pone.0272926
- Rauniar, R., Rawski, G., Yang, J., & Johnson, B. (2014). Technology acceptance model (TAM) and social media usage: An empirical study on Facebook. Journal of Enterprise Information Management, 27(1), 6–30. https://doi.org/10.1108/JEIM-04-2012-0011
- Rauschnabel, P. A., & Ro, Y. K. (2016). Augmented reality smart glasses: An investigation of technology acceptance drivers. International Journal of Technology Marketing, 11(2), 123–148. https://doi.org/10.1504/IJTMKT.2016.075690
- Reger, G. M., Koenen-Woods, P., Zetocha, K., Smolenski, D. J., Holloway, K. M., Rothbaum, B. O., Difede, J., Rizzo, A. A., Edwards-Stewart, A., Skopp, N. A., Mishkind, M., Reger, M. A., & Gahm, G. A. (2016). Randomized controlled trial of prolonged exposure using imaginal exposure vs. virtual reality exposure in active duty soldiers with deployment-related posttraumatic stress disorder (PTSD). Journal of Consulting and Clinical Psychology, 84(11), 946. https://doi.org/10.1037/ccp0000134
- Rigdon, E. E., Schumacker, R. E., & Wothke, W. (1998). A comparative review of interaction and nonlinear modeling, interaction and nonlinear effects in structural equation modeling (Lawrence Erlbaum Associates, G.A., Eds).
- Rosli, M. S., Saleh, N. S., Md Ali, A., & Abu Bakar, S. (2023). Factors determining the acceptance of E-wallet among gen Z from the lens of the extended technology acceptance model. Sustainability, 15(7), 5752. https://doi.org/10.3390/su15075752
- Ryan, M. (2020). In AI we trust: Ethics, artificial intelligence, and reliability. Science and Engineering Ethics, 26(5), 2749–2767. https://doi.org/10.1007/s11948-020-00228-y
- Saleem, M., Kamarudin, S., Shoaib, H. M., & Nasar, A. (2022). Retail consumers’ behavioral intention to use augmented reality mobile apps in Pakistan. Journal of Internet Commerce, 21(4), 497–525. https://doi.org/10.1080/15332861.2021.1975427
- Sarstedt, M., Ringle, C. M., & Hair, J. F. (2021). Partial least squares structural equation modeling. In Handbook of market research (pp. 587–632). Springer International Publishing. https://doi.org/10.1007/978-3-319-57413-4_15
- Shao, J., Li, X., Morrison, A. M., & Wu, B. (2016). Social media micro-film marketing by Chinese destinations: The case of Shaoxing. Tourism Management, 54, 439–451. https://doi.org/10.1016/j.tourman.2015.12.013
- Sharma, S., Singh, G., Pratt, S., & Narayan, J. (2021). Exploring consumer behavior to purchase travel online in Fiji and Solomon Islands? An extension of the UTAUT framework. International Journal of Culture, Tourism and Hospitality Research, 15(2), 227–247. https://doi.org/10.1108/IJCTHR-03-2020-0064
- Shaukat, M. H., Shah, S., Ali, R., & Ramkissoon, H. (2022). Mapping stakeholder role in building destination image and destination brand: Mediating role of stakeholder brand engagement. Tourism Analysis, 28(1), 29–46. https://doi.org/10.3727/108354222X16618132626722
- Shehade, T., & Stylianou-Lambert, T. (2020). Virtual reality in museums: Exploring the experiences of museum professionals. Applied Sciences, 10(11), 4031. https://doi.org/10.3390/app10114031
- Sinciya, P. O., Orethu, J. A., Philip, M. A., Prakash, N., & Jacob, J. (2023. Multipurpose immersive virtual reality environment. Proceedings of the 2023 2nd International Conference on Applied Artificial Intelligence and Computing (ICAAIC), Kumamoto, Japan (pp. 855–860). IEEE.
- Singh, A. K., & Sharma, P. (2022). A study of Indian Gen X and millennials consumers’ intention to use FinTech payment services during COVID-19 pandemic. Journal of Modelling in Management, 18(4), 1177–1203. https://doi.org/10.1108/JM2-02-2022-0059
- Solmaz, S., Kester, L., & Van Gerven, T. (2023). An immersive virtual reality learning environment with CFD simulations: Unveiling the virtual Garage concept. Education and Information Technologies, 1–34. https://doi.org/10.1007/s10639-023-11747-z
- Spreer, P., & Kallweit, K. (2014). Augmented reality in retail: Assessing the acceptance and potential for multimedia product presentation at the PoS. Transactions on Marketing Research, 1(1), 20–35. https://doi.org/10.15764/MR.2014.01002
- Su, L., Lian, Q., & Huang, Y. (2020). How do tourists’ attribution of destination social responsibility motives impact trust and intention to visit? The moderating role of destination reputation. Tourism Management, 77, 103970. https://doi.org/10.1016/j.tourman.2019.103970
- Syakier, W. A., & Hanafiah, M. H. (2022). Tour guide performances, tourist satisfaction and behavioural intentions: A study on tours in Kuala Lumpur city centre. Journal of Quality Assurance in Hospitality & Tourism, 23(3), 597–614. https://doi.org/10.1080/1528008X.2021.1891599
- Tait, M., Nkoyi, A., & Van der Walt, F. (2019). Predicting the attitude towards electronic banking continued usage intentions among rural banking customers in South Africa. South African Journal of Information Management, 21(1), 1–8. https://doi.org/10.4102/sajim.v21i1.1016
- Talwar, S., Kaur, P., Nunkoo, R., & Dhir, A. (2022). Digitalization and sustainability: Virtual reality tourism in a post pandemic world. Journal of Sustainable Tourism, 1–28. https://doi.org/10.1080/09669582.2022.2029870
- Tamilmani, K., Rana, N. P., Nunkoo, R., Raghavan, V., & Dwivedi, Y. K. (2022). Indian travellers’ adoption of Airbnb platform. Information Systems Frontiers, 1–20.
- Tenenhaus, M., Vinzi, V. E., Chatelin, Y. M., & Lauro, C. (2005). PLS path modelling. Computational Statistics & Data Analysis, 48(1), 159–205. https://doi.org/10.1016/j.csda.2004.03.005
- Tormala, Z. L., & Petty, R. E. (2004). Source credibility and attitude certainty: A metacognitive analysis of resistance to persuasion. Journal of Consumer Psychology, 14(4), 427–442. https://doi.org/10.1207/s15327663jcp1404_11
- Tortorella, G. L., Giglio, R., & Van Dun, D. H. (2019). Industry 4.0 adoption as a moderator of the impact of lean production practices on operational performance improvement. International Journal of Operations & Production Management, 39(6), 860–886. https://doi.org/10.1108/IJOPM-01-2019-0005
- Venkatesh, V., & Davis, F. D. (2000). A theoretical extension of the technology acceptance model: Four longitudinal field studies. Management Science, 46(2), 186–204. https://doi.org/10.1287/mnsc.46.2.186.11926
- Verkijika, S. F., & De Wet, L. (2018). E-government adoption in sub-Saharan Africa. Electronic Commerce Research and Applications, 30, 83–93. https://doi.org/10.1016/j.elerap.2018.05.012
- Vinzi, V. E., Chin, W. W., Henseler, J., & Wang, H. (2010). Handbook of partial least squares. 201. https://doi.org/10.1007/978-3-540-32827-8
- Vishwakarma, P., Mukherjee, S., & Datta, B. (2020). Travelers’ intention to adopt virtual reality: A consumer value perspective. Journal of Destination Marketing & Management, 17, 100456. https://doi.org/10.1016/j.jdmm.2020.100456
- Vitaliev, V. (2016). VR around the… world. Engineering & Technology, 11(3), 33–33. https://doi.org/10.1049/et.2016.0312
- Vlačić, E., Dabić, M., Daim, T., & Vlajčić, D. (2019). Exploring the impact of the level of absorptive capacity in technology development firms. Technological Forecasting and Social Change, 138, 166–177. https://doi.org/10.1016/j.techfore.2018.08.018
- Vuong, B. N., & Khanh, G. H. N. (2020). The impact of perceived brand globalness on consumers’ purchase intention and the moderating role of consumer ethnocentrism: An evidence from Vietnam. Journal of International Consumer Marketing, 32(1), 47–68. https://doi.org/10.1080/08961530.2019.1619115
- Wallace, L. G., & Sheetz, S. D. (2014). The adoption of software measures: A technology acceptance model (TAM) perspective. Information & Management, 51(2), 249–259. https://doi.org/10.1016/j.im.2013.12.003
- Wathen, C. N., & Burkell, J. (2002). Believe it or not: Factors influencing credibility on the Web. Journal of the American Society for Information Science and Technology, 53(2), 134–144. https://doi.org/10.1002/asi.10016
- Wetzels, M., Odekerken-Schröder, G., & Van Oppen, C. (2009). Using PLS path modeling for assessing hierarchical construct models: Guidelines and empirical illustration. MIS Quarterly, 33(1), 177–195. https://doi.org/10.2307/20650284
- Wiltshier, P., & Clarke, A. (2017). Virtual cultural tourism: Six pillars of VCT using co-creation, value exchange and exchange value. Tourism and Hospitality Research, 17(4), 372–383. https://doi.org/10.1177/1467358415627301
- Wirth, M., Gradl, S., Sembdner, J., Kuhrt, S., & Eskofier, B. M. (2018). Evaluation of interaction techniques for a virtual reality reading room in diagnostic radiology. Proceedings of the 31st annual ACM symposium on user interface software and technology, Berlin, German (pp. 867–876).
- Won, D., Chiu, W., & Byun, H. (2022). Factors influencing consumer use of a sport-branded app: The technology acceptance model integrating app quality and perceived enjoyment. Asia Pacific Journal of Marketing & Logistics, 35(5), 1112–1133. https://doi.org/10.1108/APJML-09-2021-0709
- Woo, E., Kim, H., & Uysal, M. (2015). Life satisfaction and support for tourism development. Annals of Tourism Research, 50, 84–97. https://doi.org/10.1016/j.annals.2014.11.001
- Wu, S. T., Chiu, C. H., & Chen, Y. S. (2020). The influences of innovative technological introduction on interpretive experiences of exhibition: A discussion on the intention to use augmented reality. Asia Pacific Journal of Tourism Research, 25(6), 662–677. https://doi.org/10.1080/10941665.2020.1752754
- Xiang, Z., Magnini, V. P., & Fesenmaier, D. R. (2015). Information technology and consumer behavior in travel and tourism: Insights from travel planning using the internet. Journal of Retailing and Consumer Services, 22, 244–249. https://doi.org/10.1016/j.jretconser.2014.08.005
- Xu, Z., & Li, H. (2008). Political freedom, economic freedom, and income convergence: Do stages of economic development matter? Public Choice, 135(3–4), 183–205. https://doi.org/10.1007/s11127-007-9253-y
- Ying, T., Tang, J., Ye, S., Tan, X., & Wei, W. (2022). Virtual reality in destination marketing: Telepresence, social presence, and tourists’ visit intentions. Journal of Travel Research, 61(8), 1738–1756. https://doi.org/10.1177/00472875211047273
- Zhang, T., Chen, J., & Hu, B. (2019). Authenticity, quality, and loyalty: Local food and sustainable tourism experience. Sustainability, 11(12), 3437. https://doi.org/10.3390/su11123437
- Zhang, S. N., Li, Y. Q., Ruan, W. Q., & Liu, C. H. (2022). Would you enjoy virtual travel? The characteristics and causes of virtual tourists’ sentiment under the influence of the COVID-19 pandemic. Tourism Management, 88, 104429. https://doi.org/10.1016/j.tourman.2021.104429
- Zhu, H., & Deng, F. (2020). How to influence rural tourism intention by risk knowledge during COVID-19 containment in China: Mediating role of risk perception and attitude. International Journal of Environmental Research and Public Health, 17(10), 3514. https://doi.org/10.3390/ijerph17103514
- Zhu, Z., Zhang, X., Wang, J., & Chen, S. (2023). Research on the influence of online photograph reviews on tourists’ travel intentions: Rational and irrational perspectives. Asia Pacific Journal of Marketing & Logistics, 35(1), 17–34. https://doi.org/10.1108/APJML-08-2021-0547