
Abstract
The study aims to systematically review the role of big data visualization in the auditing field. Employing a qualitative approach, the research utilized the Systematic Literature Review method to gather pertinent data. The study used 35 published articles extracted from different journals and reputed publishers, which served as the sample. This research provides an overview of the data visualization trend literature in auditing and describes the associated capabilities and practices. The result showed a fluctuating pattern in the publication years, highlighting a relatively recent research area, with the highest volume noted in 2021. The findings indicated that most articles used qualitative methods, such as conceptual or case study research. This suggests that empirical research is needed to add to the body of knowledge of data visualization in auditing. Furthermore, the study identified nine of the main capabilities of data visualization to improve audit quality. The study offers valuable perspectives for both practitioners and researchers, detailing the progress made to date and identifying future avenues of inquiry within the discipline. The study contributes to extending the literature on accounting information systems and auditing and provides a knowledge gap for further analysis.
1. Introduction
This research explores the literature focusing on big data visualization in auditing. A Chartered Global Management Accounting (CGMA) survey stated that 87% of CFOs and financial professionals agreed that this data would change the business world in approximately 10 years (CGMA, Citation2013). Likewise, accounting firms declare that big data is increasingly essential to their assurance practice (Alles & Gray, Citation2016). Big data and its related technology are predicted to transform the auditor’s way from traditional to modern audit. Several prior studies have revealed the big data theme in auditing (Alles & Gray, Citation2016; D. A. Appelbaum et al., Citation2018; Earley, Citation2015; Gepp et al., Citation2018; Krieger et al., Citation2021; Manita et al., Citation2020; F. Tang et al., Citation2017), but little known from previous researchers that have focused on data visualization.
Big data should be well-processed to gain meaningful insights through some techniques, including visualizing the analytic results. The literature mentioned that auditors cannot fully integrate the numerous advantages of using big data (Hamdam et al., Citation2021). An emerging concern affecting auditors in a big data environment is how auditors engage in cognitive processes, particularly in analyzing output presented in various formats (Hamdam et al., Citation2021). To address these cognitive issues, data visualization has been identified as a valuable tool (Alawadhi, Citation2015), leveraging visual elements (Tableau, Citation2019). Data visualization helps auditors increase their awareness, attention, and vigilance when processing information (Rose et al., Citation2017). It transforms the output of big data analysis into visual representations, thereby reducing cognitive load and enabling better understanding through graphics and visuals (Alawadhi, Citation2015).
Data visualization has been acknowledged by researchers and practitioners as a means to enhance the quality of audit practices (American Institute of Certified Public Accountants [AICPA], Citation2015; Brown-Liburd et al., Citation2015; Chang & Luo, Citation2021; Richins et al., Citation2017). It is widely believed that there has been no potential negative impact of data visualization on the audit field (Chang & Luo, Citation2021). The data visualization complements the traditional audit to evaluate the audit evidence (A. M. Rose et al., Citation2021; Yoon et al., Citation2015). Auditors can employ data visualization in various stages of audit processes, including accepting or continuing audit engagements; planning; risk assessment; tests of controls; and tests of substantives (AICPA, Citation2015). Moreover, Hamdam et al. (Citation2021) and A. Rose et al. (Citation2017) have constructed research frameworks that explore the utilization of data visualization by auditors for judgment and decision-making purposes, aiming to uncover the extensive advantages it brings to the field of auditing.
Prior studies have also identified various potential capabilities in data visualization that demonstrate its potential impact on the quality of audits. For example, it enhances the effectiveness and efficiency of audit procedures (Yoon et al., Citation2015) by converting extensive and intricate datasets into visual representations to extract meaningful insights (Chang & Luo, Citation2021). Auditors invest more time and effort in comprehending and identifying data patterns when utilizing tabular formats. In contrast, Lurie and Mason (Citation2007) discovered that the human brain processes information more rapidly when presented graphically. Additionally, traditional financial statement auditing practices primarily employ a problem-driven approach when analyzing structured data with limited datasets. However, the advent of big data visualization opens possibilities for exploratory analysis in audit practices, particularly with unstructured data (Richins et al., Citation2017).
This study identifies and consolidates data visualization topics from previous research, introducing them as a novel area of concern in accounting and auditing literature. Assessing the current state of data visualization studies in auditing is necessary for future research endeavors. However, existing literature highlighted that while big data has made significant strides in business organizations, its implementation in audits has been slower compared to other practice areas. This can be attributed to the unique challenges faced by auditing that are not applicable to other domains. Furthermore, the impact and operational changes brought about by the rapid growth of data in auditing practices are still uncertain (Hamdam et al., Citation2021). Multiple studies have undertaken Systematic Literature Reviews (SLRs) investigating big data within the context of auditing, such as those by Ahmad (Citation2019), Hezam et al. (Citation2023), and Mugwira (Citation2022). Nevertheless, there is a noticeable absence of emphasis on data visualization as an integral component of the big data discourse among those SLRs, which stands as the central theme of this study.
Considering that fact, this research aims to systematically review the literature on big data visualization in the auditing field. The following are the research objectives: (1) to determine the trend of literature on the use of data visualization in the auditing field and (2) to determine the associated capabilities and practices. The research contributes to increasing the amount of literature and mapping the extent of state of the art on implementing big data in auditing. The study’s findings involved extracting and synthesizing the literature trend by examining publishing outlets, publications over time, research methods, and approaches, as well as the types of audits investigated. The study addressed nine primary capabilities of data visualization that can enhance audit quality. Additionally, the study revealed the application of data visualization during the audit processes observed by prior studies.
The present study is organized as follows: Section 2 introduces the literature review, section 3 describes the methodology, section 4 provides the result and discussion, and section 5 presents the conclusion and further study.
2. Literature review
The term big data was first introduced in 2011 by Chen et al. (Citation2012) (Liang & Liu, Citation2018). Big data is expected to proliferate in the digital transformation era in the Industrial Revolution 4.0 (Moll & Yigitbasioglu, Citation2019). The big data has not been consistently defined, hence, it is still confusing and unclear (Dagilienė & Klovienė, Citation2019; Vasarhelyi et al., Citation2015). Vasarhelyi et al. (Citation2015) defined it as a large amount of data fundamentally related. According to Brown-Liburd et al. (Citation2015), it consists of large, unstructured, and complex financial and non-financial data. In general, many parties defined it as the high volume, velocity, variety, and veracity of information (Hamdam et al., Citation2021). Prior studies significantly discussed the literature on the role of big data in the audit process. Moreover, it is changing the way auditors collect and evaluate audit evidence; and make judgments and decisions (Brown-Liburd et al., Citation2015). Hamdam et al. (Citation2021) predicted changes in audit practice, specifically in substantive tests, risk assessment, and analytical procedures.
Big data is processed using techniques sometimes referred to as Big Data Analytics (BDA) to gain meaningful and new knowledge (Dagilienė & Klovienė, Citation2019). Data analytics refers to tools developed to understand big data (Gepp et al., Citation2018). It is essential that the process of analyzing data sources from different databases in a structured and unstructured format is large and varied. This large and varied data source proposes to find information that can assist organizations in making real-time business decisions (Gepp et al., Citation2018). For auditors, data analytics is a series of processes used to determine and communicate patterns and valuable information to help auditors find conclusions and assist in decision-making (Brown-Liburd et al., Citation2015). The use of Computer Assisted Audit Techniques (CAAT) and Microsoft Excel in traditional audit practice is considered unable to effectively and efficiently analyze big data (Brown-Liburd et al., Citation2015).
Data visualization techniques are employed to present the outcomes of big data processing in a manner that allows readers to easily comprehend the information. Data visualization is a set of analytics tools considered part of technology adoption (Buchheit et al., Citation2020). It involves illustrating and combining datasets to find hidden patterns needed to obtain the core of information (A. Rose et al., Citation2017). Data visualization helps users find relevant and meaningful patterns of information for decision-making (Hamdam et al., Citation2021). The data visualization presents insights that involve the user’s cognitive processes and human visual abilities through graphics (D. Appelbaum et al., Citation2017) to gain better insights, provide satisfactory conclusions, and improve audit judgment (Alawadhi, Citation2015). Cognitive processes created from big data visualization provide arousal and stimulus for individuals (A. M. Rose et al., Citation2021). This will enable auditors to increase awareness, attention, and vigilance in processing information (A. Rose et al., Citation2017).
Auditors face many issues in big data implementation, such as ambiguity of information, overload, and difficulty in using audit standards that have not entered the realm of big data (Brown-Liburd et al., Citation2015; Yoon et al., Citation2015). Nevertheless, a significant challenge lies in identifying the most effective strategies for auditors to manage vast datasets and generate high-quality information to enhance their professional judgment (Yoon et al., Citation2015). Prior studies have emphasized the critical role of data visualization in the effective utilization of big data in auditing (AICPA, Citation2015; Brown-Liburd et al., Citation2015; Chang & Luo, Citation2021; Richins et al., Citation2017). For example, Chang and Luo (Citation2021) and Yoon et al. (Citation2015) discussed big data visualization as a complement to traditional audit evidence, specifically when it is deemed insufficient in detecting the level of conformity of established criteria. Therefore, based on previous studies, this research focuses on finding the data visualization literature trend and potential benefits of data visualization in auditing.
3. Methodology
The Systematic Literature Review (SLR) method was used in this qualitative investigation. In contrast to the quantitative approach, which commonly adheres to a deductive pattern by assessing theories related to a certain subject, the qualitative method functions in the opposite direction (Sekaran & Bougie, Citation2016). A study is referred to as qualitative when it predominantly depends on qualitative instruments like descriptive analysis rather than advanced statistical methods (Strijker et al., Citation2020). The current investigation is categorized as qualitative since it involves a comprehensive review of published research and the execution of descriptive analyses related to the topic.
Engaging in SLR entails a methodical exploration and assessment of elements pertinent to the research subject. This approach falls under the category of investigative science, with the aim of enhancing the value of reviews (Tranfield et al., Citation2003). It serves as a viable strategy for pinpointing areas characterized by either substantial or insufficient evidence (Petticrew & Roberts, Citation2006). SLR assumes a pivotal role in shaping novel interventions, influencing innovative methodological developments, and providing direction for upcoming research pursuits. The primary objective of a systematic review is to unveil all relevant evidence meeting preset conditions to address a particular issue (Snyder, Citation2019). Such reviews prove particularly valuable in situations of uncertainty as they enable a thorough examination of all pertinent studies. The ascendancy of systematic reviews has accelerated, given the growing recognition of their effectiveness in distilling extensive research information into a manageable and insightful format (Petticrew & Roberts, Citation2006).
To ensure minimal bias, an SLR employs a study protocol that outlines a comprehensive plan for the designated topic (Tranfield et al., Citation2003). The present study meticulously adhered to the study protocols outlined by Tranfield et al. (Citation2003) and Kitchenham (Citation2004), who have provided systematically review procedures guideline and widely embraced by a multitude of SLR authors, such as Alatawi et al. (Citation2023), Almaqtari et al. (Citation2020), Nguyen et al. (Citation2020), Hazaea et al. (Citation2021), Mauludina et al. (Citation2023) and Mauludina, Azis, et al. Citation(2023). Commencing the SLR protocol involves the identification of its objectives, serving as a fundamental cornerstone for the thorough process (Tranfield et al., Citation2003; Achdiat et al., Citation2022). Following this, two research questions were framed to expand the existing comprehension of the role of data visualization in the context of auditing. These questions are articulated as follows:
RQ1: What are the publishing outlets, publications by years, and research methods and approaches that prior studies used to discuss data visualization in auditing?
RQ2: what are data visualization capabilities and practices in auditing that prior studies have addressed?
3.1. Articles identification and Boolean search
The study used several keywords to search articles related to data visualization in auditing. The keywords are used to connect with the next stages in which the articles are sorted, assessed, extracted, and synthesized. Then, the study used the key terms only until the related articles were reached. ‘Big Data’, ‘Data Visualization’, and ‘Audit’ were used as the keywords. Those keywords were set at the outset regardless of the area or aspect of the research. The study used some Boolean search operators as it plays a vital role in facilitating the retrieval of articles pertinent to research questions. Employing Boolean AND allowed for the linking of diverse concepts, effectively honing the scope of the search. Furthermore, the study incorporated sophisticated Boolean operators, including factors like material type and publication date. The emphasis of the study was specifically on scrutinizing published articles, purposefully disregarding any irrelevant documents from the consideration set. The articles for the search were restricted to those published starting from 2011, corresponding with the term ‘big data’ entering the research lexicon, as introduced by Chen et al. (Citation2012). This delineation was further reinforced by systematic reviews and bibliometric research conducted by Ain et al. (Citation2019) and Ardito et al. (Citation2019). The study utilized reputable databases such as Emerald Insight, ScienceDirect, Taylor & Francis Online, Willey Online Library, and SAGE Journals. These databases encompass diverse academic fields and subject areas, enabling researchers to discover pertinent articles. Numerous journals included in these databases are listed in renowned academic databases like Scopus and Web of Science. Furthermore, the studies originating from these databases have been referenced by other studies, indicating their influence on subsequent publications. The search was conducted electronically by putting the keywords through the outset and manually through article references.
3.2. Quality assessment
The sampled articles underwent evaluation before essential information was extracted and analyzed in accordance with the research objectives. The study applied some criteria for inclusion and exclusion to select pertinent and high-quality papers, encompassing the following:
Articles that were duplicates, not in English, lacked a research basis, not available in full-text, unrelated to the research question were excluded.
Published articles addressing the research question were included.
Studies that described the data visualization theme in auditing were included.
Other types of materials rather than published articles were not taken into account for inclusion in the study.
The first query exploration resulted in 490 records: 470 articles were obtained automatically from databases’ search and 20 papers were obtained from cited references of articles. Articles that failed to meet the specified selection criteria and quality assessment were then excluded from consideration. 82 papers that are not research-based were excluded, hence, only 408 were screened by assessing the abstract and full text. The initial screening eliminated 318 articles due to their lack of relevance to the research questions. Subsequently, a more detailed screening was conducted on the remaining 90 articles before synthesizing the final set of 35 articles. The PRISMA flow diagram was used to present the research selection ().
Figure 1. PRISMA flow diagram for system review process.
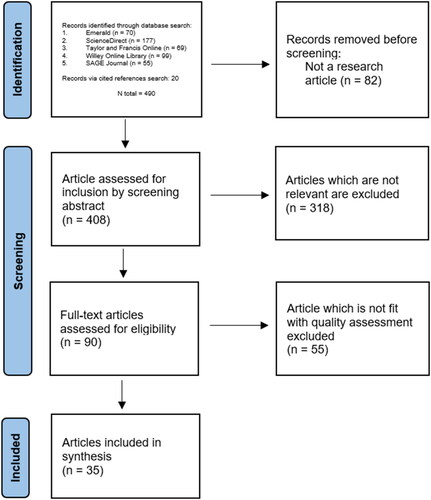
This research delved into the particular and relatively nascent advancements in the field of auditing. The selection of the 35 articles for this study was based on their relevance to the research question, serving as representatives of the current state of the related topic. Even though the exploration of the topic is still in its early stages, SLR can assist in identifying gaps and guiding future research efforts, considering that previous studies on the issue have been conducted (Petticrew & Roberts, Citation2006). This study is the first comprehensive review of big data visualization in the field of auditing. It is crucial to accumulate knowledge proactively rather than waiting for sufficient evidence to accumulate at a later date. Conducting a review on a topic in its early-stage development is an essential initial step in designing new interventions and evaluations. Furthermore, there have been previous SLR articles that also reviewed less than 50 articles to explore relatively new topics, as studied by Knudsen (Citation2020) and Mauludina et al. (Citation2023).
3.3. Data extraction and synthesis
The selection of articles was completed, and diverse techniques and tools were utilized to extract necessary data from the chosen papers such as content analysis and Microsoft Excel. Furthermore, the obtained articles were subjected to descriptive analysis and systematically examined through a comprehensive interpretive approach aimed at addressing the research objectives. The ensuing part will showcase the discussion and outcome derived from the investigated studies.
4. Results and discussion
This section consists of five subsections. The first to the third subsection provides the answer to the first research question which asks about publishing outlets, publication by years, and research methods and approaches. The fourth to fifth subsection provides the answer to the second research question which asks about data visualization capabilities and practices in auditing based on prior studies.
4.1. Publishing outlets
Presented in this subsection is a summary of the retrieved papers, organized according to journals, publishers, and citations. shows that the majority of the published papers were from the International Journal of Accounting Information Systems, Managerial Auditing Journal, and Journal of Information Systems. These journals contributed six, five, and four papers, representing 17%, 14%, and 11% of the total, respectively. With regards to the publishers, the greatest quantity of research articles, amounting to 13, has been published in Elsevier, followed by Emerald Publishing which has 11 papers. Furthermore, the results show that Elsevier journals have the highest number of citations; 2917, followed by the American Accounting Association (640), and Emerald Publishing (632). The results indicate that those journals are leading in discussing data visualization in auditing.
Table 1. Journal’s distribution and publishers’ citations.
shows the detailed journals and publishers with the description of each article’s number of citations and publication period. The reason behind providing the number of citations is to show the article with high citations, which indicates the leading articles in discussing the related topics. The most cited articles were (Saggi & Jain, Citation2018) which has 512 citations, followed by Gepp et al. (Citation2018) (411), Earley (Citation2015) (358), Manita et al. (Citation2020) (344), Sledgianowski et al. (Citation2017) (287), and the rest of articles have less than 200 citations.
Table 2. Journals, publishers, citations, and years.
4.1.1. Most influential authors and references
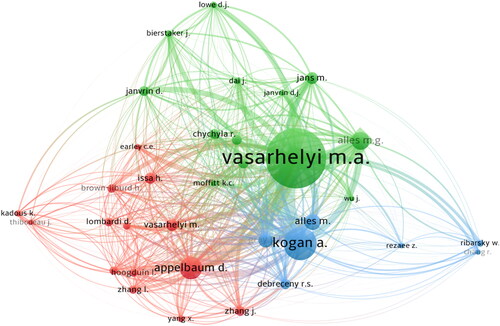
The VOSviewer tool has been employed to conduct an analysis and assist in the generation of visual representations showcasing the most prominent authors and frequently cited references within the sample articles. This software is a popular choice among scholars for performing bibliometric analyses, with its application evident in studies within the realm of big data, as demonstrated by works such as those by Ardito et al. (Citation2019), Liang and Liu (Citation2018), and Varma et al. (Citation2021). A co-citation analysis was conducted to pinpoint authors and references with shared interests in the field. This involves identifying pairs of authors or articles that are cited together by the same article, indicating a relatedness in their work. The first visualization () examines the co-citation of authors cited within the literature. The findings highlight Vasarhelyi, M. A., Alles, M. G., Kogan, A., and Appelbaum, D. as the most frequently co-cited and influential figures in this research area.
Figure 2. Co-citation analysis of cited authors.
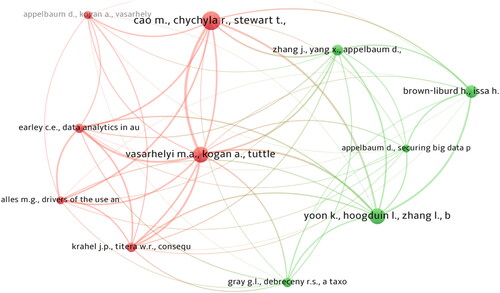
The subsequent graphic () investigates the co-citation of frequently cited references. This visualization presents the references that have been cited over five times. The outcome suggested that these citations predominantly concentrate on big data within accounting and auditing. Nevertheless, the literature being cited bifurcates into two distinct thematic and focal areas. The first group (colored red) concentrates on the wider consequences and the adoption of big data in the realms of auditing and accounting, as seen in works like Cao et al. (Citation2015) discussing ‘Big Data Analytics in Financial Statement Audits’, Vasarhelyi et al. (Citation2015) offering an ‘Overview of Big Data in Accounting’, and Krahel and Titera (Citation2015) examining the ‘Effects of Big Data and Formalization on Accounting and Auditing Standards’. Conversely, the second grouping (colored green) zeroes in on the precise roles of big data within auditing, scrutinizing its influence on auditing methodologies and the nature of audit evidence. This is exemplified by Yoon et al. (Citation2015): ‘Big Data as Complementary Audit Evidence’, Brown-Liburd et al. (Citation2015): ‘Behavioral Consequences of Big Data on Auditors’ Decisions and Judgments’, and Zhang et al. (Citation2015): ‘Optimizing Big Data Analysis for Continuous Auditing’.
Figure 3. Co-citation analysis of cited references.
4.2. Publication by years
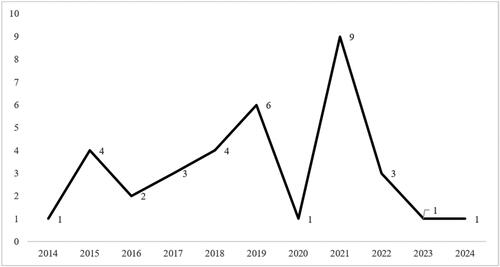
shows publication by years that no articles before 2014 covered the study’s topic. Moreover, there was a fluctuating trend of published articles from 2014 to 2024. The most published articles were in 2021, followed by 2019 with values of 9 and 6 in percentages of 26% and 17%.
Figure 4. Publications by years.
4.3. Research methods and approaches
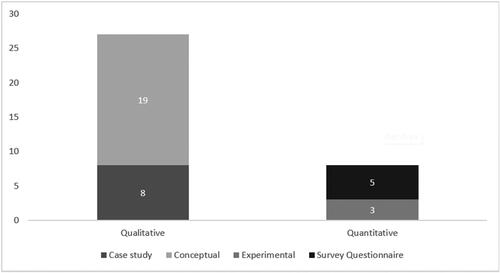
Based on research methods and approaches, the majority of studies used qualitative methods with conceptual and case study approaches with 19 and 8 papers indicating 54% and 23%, followed by quantitative with survey questionnaire and experimental approaches with 5 and 3 papers indicating 14% and 9%, respectively as shown in . The results suggest that prior studies still focused on building the knowledge foundation. Moreover, it needs more empirical research to examine and strengthen the prior studies.
Figure 5. Research methods and approaches.
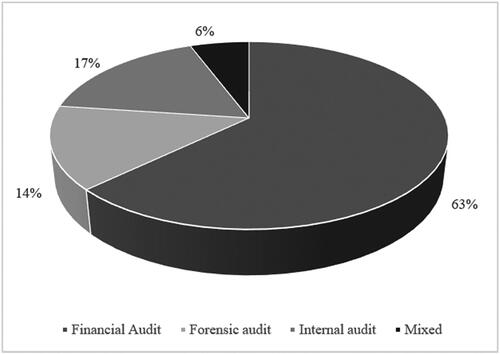
Regarding the sampling units/object of research investigated by prior studies, presents the type of audits that researchers focus on. These studies were distributed as 22 papers (63%) on financial audits, 6 papers (17%) on internal audits, 5 papers (14%) on forensic audits, and two papers (6%) on mixed areas. The results indicate many prospective studies for the next researchers in embedding data visualization beyond the financial audit.
Figure 6. Audit types.
4.4. Data visualization capabilities
The extracted data were coded and analyzed to identify data visualization capabilities in auditing. Data visualization is expected to provide various perspectives in collecting and evaluating audit evidence to improve the quality of auditor decision-making and audit quality (Earley, Citation2015). It is a process inseparable from big data analytics to create value realization (Saggi & Jain, Citation2018). Therefore, the codification of the data visualization capabilities shown in is likely to overlap with the general capabilities of data analytics.
Table 3. Capabilities of data visualization in the auditing field.
Research on the growing complexity of business, where thousands of data are created daily, led to the capability of discovering new and meaningful patterns, anomalies, and suspicious information (Lokanan, Citation2019; Singh & Best, Citation2016). The technology capable of analyzing patterns to gain new and meaningful information in decision-making is needed to determine data complexity. The benefit of data analysis and visualization lies in its ability to simplify complex and challenging metrics into easily comprehensible principal components, making the issues under investigation more immediately clear (Ma, Citation2023). Auditing practices with data visualization implementation have more opportunities to discover outliers, discrepancies, exceptions, trends, discontinuities, and correlations from clients’ data sourced from financial and non-financial reports. A. M. Rose et al. (Citation2021) provided evidence supporting the idea that well-design visualization assists auditors to focus on, analyze, and retain to more pertinent information.
This process is also introduced as the data discovery stage (Lokanan, Citation2019), which focuses on finding patterns and trends using several visualization techniques, such as association, classification, clustering, and sequence analysis. The exploratory and explanatory analysis are the two patterns used to determine meaningful information from big data (Alzamil et al., Citation2021; Chang & Luo, Citation2021; Raveh et al., Citation2020). These are also known as supervised and unsupervised learning processes (Richins et al., Citation2017). Auditors do not need to prepare business questions and guidelines for the data analysis process in the exploratory process. This is because this approach aims to determine as much hidden information as possible with minimum human intervention, such as dependence on the pre-labeling of data (S. Li et al., Citation2021). It increases the possibility of gaining more information since there are no boundaries of perspective. In addition, exploratory analysis tells auditors where to direct attention (Alzamil et al., Citation2021). This contrasts with explanatory analysis, where auditors need to use an initial interest in the client’s data to determine the focus of the problem.
In an exploratory analysis, the data used tend to be aggregate or population-oriented and not predefined clearly. In the audit context, Chang and Luo (Citation2021) stated that auditors could perform an exploratory analysis before collecting and evaluating audit evidence to explore data relationships from various perspectives. Guo et al. (Citation2021) examined the Accounting Graph Topology (AGT) data analysis using thousands of journal entries by extracting data within- and between-entry information. It used case research data from a hotel in the southwestern United States with the journal entries for fiscal years 2019 and 2020. The research obtained 18.951 entries with 37.905-line items, including all debit and credit lines. The result showed that 74 unique accounts need to be considered further to check auditors’ potential misstatements or fraud.
Werner et al. (Citation2021) gave another example by investigating the internal control implementation using process mining techniques. The analysis uses the recorded event log data extracted from an Enterprise Resource Planning (ERP) or workflow management system. After conducting the business process (event log) analysis, they were visualized using graphical representations. Werner et al. (Citation2021) examined the mined process for the procurement of the audited entity to analyze uncommon or infrequent flow activities. The result observed that the 1.737 entries flowed from the purchase order modification to invoice posting are uncommon activities.
Data visualization is expected to provide more data than the usual ones used by auditors in the sampling process. This indicates that the more data used in the discovery stage, the greater the patterns found. Guo et al. (Citation2021) and Werner et al. (Citation2021) above illustrate that data populations can be utilized to provide insight to auditors, utilizing accounting and event logs data over a certain period. The probability of auditors finding more patterns is more considerable than only analyzing a small amount (H. Li et al., Citation2018). Auditors can penetrate the sampling method commonly used during the audit processes. There are significant differences between the problem of detecting anomalies in huge data populations and analyzing suspicious transactions in smaller data sets (Dilla & Raschke, Citation2015). It is because of the increased potential that auditors can find more appropriate audit evidence, hence, it is presumably able to provide a higher level of assurance on the financial statements (Jacky & Sulaiman, Citation2022) and add value to stakeholders (Gepp et al., Citation2018). Big data has a characteristic that represents the high ‘volume’ of data, which can be analyzed to explore its potential applications (A. Rose et al., Citation2017).
Along with the increasing volume of audit evidence and technology that enables data visualization (Dilla & Raschke, Citation2015), auditors can increase efficiency in terms of time and cost needed to determine the correct patterns (Singh & Best, Citation2015). It also relates to other capabilities, such as various data forms, analysis by sophisticated tools, and interactive visualization by real-time dashboarding with the integrated application. The increase in efficiency and effectiveness enables auditors to conduct more frequent audits in high-risk areas and enhance the reliability of the results (H. Li et al., Citation2018). As a profit-seeking organization, the audit company naturally seeks to conduct an audit process in the most efficient way (Dagilienė & Klovienė, Citation2019). Therefore, data visualization is expected to minimize the likelihood of incorrect conclusions to achieve efficiency and effectiveness.
Auditors can perform big data analysis and visualization using sophisticated analytical techniques to obtain an output capable of creating descriptive, predictive, and prescriptive analyses (Saggi & Jain, Citation2018). The audit data analytics technique has undergone a paradigm shift (Alles & Gray, Citation2016), enabling auditors to concentrate on more intricate aspects and engage in tasks of greater value, rather than dedicating their efforts to routine tasks (Krieger et al., Citation2021). D. A. Appelbaum et al. (Citation2018) created the framework of audit analytics named External Audit Analysis (EAA Framework) to catch up with the data analytics development in every phase of the audit engagement.
Numerous research examined the utilization of sophisticated analysis in auditing or fraud contexts. Haggerty et al. (Citation2014) studied a tag cloud and social network analysis, Werner et al. (Citation2021) created the framework and embedded the process mining analysis in every audit engagement, and S. Li et al. (Citation2021) introduced Artificial Neural Network (ANN) in conducting the analytical procedure. Furthermore, Singh and Best (Citation2016) used node-link analysis to investigate the accounts payable, Singh and Best (Citation2019) performed link analysis to investigate anti-money laundering, Alzamil et al. (Citation2021) examined k-means and hierarchical analysis to identify the pattern of the governmental report, Guo et al. (Citation2021) conducted social network analysis to investigate the journal entries by introducing the Accounting Graph Topology (AGT), and Ma (Citation2023) employed multiple data mining algorithms for the purpose of big data auditing, with a particular focus on leveraging association rule mining and time series analysis techniques.
The sophisticated analysis provides additional evidence that supports the audit. For example, Haggerty et al. (Citation2014) conducted a tag cloud and social network analysis using case research on thousands of online data through EnronData.org and found 275 emails, 515 actors, and 50,198 words. The tag cloud analysis only showed a word that appears more than 20 times and two prominent names, ‘Skilling’ and ‘Sera’. It was corroborated by the numerous network diagrams sent through ‘Sera’. The results of the analysis are helpful for a more in-depth investigation. S. Li et al. (Citation2021) provided a new approach to performing analytical procedures with Artificial Neural Network analysis by comparing three methods: financial ratios, regression analysis, and Artificial Neural Networks. The comparison showed that the use of Artificial Neural Networks leads to a higher level of reliability in alerting auditors to material errors and unusual economic events.
The data visualization is expected to provide a visual description of structured and unstructured information. Structured data is generally in the tabular form of daily transactions in the general ledger of the company’s accounting information system. Most unstructured data is non-financial data taken from various sources such as social media, email, websites, meeting reports, performance reports, news, personal relationships, and company information systems. A. Rose et al. (Citation2017) and A. M. Rose et al. (Citation2021) introduced the implementation of unstructured data in their experimental research in the audit field. The results showed that unstructured data increases emotional arousal and can enhance the ability to recognize disconfirming evidence. Gepp et al. (Citation2018) stated that the future of auditing will be beneficial by implementing the text’s Natural Language Processing (NLP) analysis. For example, identifying key personnel in email correspondence, multiple contracts, and other online information.
The traditional auditing practice is limited to analyzing financial data as a management assertion for gathering and evaluating audit evidence. Meanwhile, the use of unstructured data to conduct an audit is close to the implementation of modern auditing. It represents other big data characteristics called ‘variety’ and ‘veracity’ in collecting and evaluating audit evidence (J. Tang & Karim, Citation2019). Combining the two types of data makes it possible to have an overview and add a more comprehensive and meaningful understanding of the company’s business processes for auditors (Lokanan, Citation2019; A. Rose et al., Citation2017; Sledgianowski et al., Citation2017). For example, auditors have the option to utilize big data visualizations gathered from social networks, news articles, or forums dedicated to product discussions to understand the auditee’s sales trends in cases where its sales forecasts are missing or substandard (Yoon et al., Citation2015).
The data analytics result is then presented through a dashboard visualization in a real-time manner. Information is displayed in a multi-view visualization capable of cognitively promoting auditors by providing a real-time analysis (Chang & Luo, Citation2021) on the dashboard for better understanding (Gepp et al., Citation2018). The dashboard organizes and visualizes the information in an easy way to read and interpret (Singh & Best, Citation2016). The data can be obtained from the local operating system in the computer, one or more running applications, and remote sites on the web (Singh & Best, Citation2016). The dashboard integrates the data from multiple sources into a unified display (Dilla & Raschke, Citation2015; Singh & Best, Citation2016) to capitalize on human cognition and perception (Singh & Best, Citation2016).
The information visualized through the dashboard allows auditors to conduct continuous auditing and monitoring while constantly surveilling the transaction data in real or near-real-time (Singh & Best, Citation2016). The main objective of the continuous auditing and monitoring is to enable auditors to provide assurance on the management assertion shortly after business activities take place (Singh & Best, Citation2015). Rakipi et al. (Citation2021) emphasized the enhancement of auditors’ risk management capabilities through the application of data analytics and visualization in continuous auditing and monitoring. In concordance, Smidt et al. (Citation2019) suggested that incorporating data analytics tools into auditing methodologies advances continuous auditing to its utmost level of maturity. Continuous auditing and monitoring practices are likely to become particularly relevant in this digitalization age and grow into the future of audit (Cao et al., Citation2015; Jacky & Sulaiman, Citation2022). D. A. Appelbaum et al. (Citation2018) argued that there are numerous potential data analysis techniques for continuous activities in their EAA framework. The potential advantages of continuous auditing and monitoring systems render them notably more effective, efficient, and rapid compared to conventional auditing tools (Singh & Best, Citation2015). The primary aim of these continuous assurance activities is to enable auditors to become more integrated with the daily internal operations of the auditee, moving beyond reliance on historical audit data (D. Appelbaum et al., Citation2016).
Singh and Best (Citation2016) provided an example of implementing real-time dashboarding related to account payable transactions with several indicators: account payable system summary, transaction codes performed by users, the number of users who violated segregation of duties, and total invoice and payment proceeds. Others include top-five vendor invoices and payments, an overview of banking-related activities, a comparison between the actual vendor invoice and expected values, and a fraud risk index. It demonstrated the critical indicators related to analyses that were easy to read and understand. The purpose of data visualization through this dashboard is to integrate information from various sources into one unified display and capitalize on human cognition (Singh & Best, Citation2016). The dashboard needs to be made with interactive features, such as dropdown lists and drag and drop, making it easier for auditors to highlight important information.
Interactive data visualization enables decision-makers to specify the format representation, select the most relevant information, and navigate the selected data at various levels (Dilla & Raschke, Citation2015). presents a variety of interactive techniques designed to tailor visualizations to user preferences. The table is divided into two primary functions of visualization. The first category, data representation tools, enables users to alter how data is displayed according to their needs. This category includes tools such as Encode, Reconfigure, and Connect. The second category, data selection tools, allows users to choose and emphasize specific data they wish to visualize. This group includes Select, Elaborate/Abstract, Filter, and Explore.
Table 4. Interactive visualization techniques.
Finally, the combined capabilities led to the determination of the data visualization process to make better, faster, and more confident decisions. It supports visual thinking because the visualization makes good use of the eyes and assists the brain, leading to new insight that cannot be matched by the traditional approach (Dilla & Raschke, Citation2015). Data analytics and visualization are expected to generate deeper insights, better decision-making, higher quality audits, and more value-added for the clients (Alzamil et al., Citation2021; Chang & Luo, Citation2021; Jacky & Sulaiman, Citation2022).
4.5. Data visualization within the audit processes
The auditing field topics in the article samples of this research are the financial statement, internal, and forensic/investigative audits. The most common type of audit discussed in the selected papers is the financial statement audit, with a percentage of 68%, followed by forensic and internal audits. The variety of audit types has different purposes. The financial audit focuses on determining whether the financial statements are stated according to the established criteria (Arens et al., Citation2023; Werner et al., Citation2021). The internal audit focuses on helping management achieve organizational goals by analyzing and improving its controls and performance. The forensic audit focuses on fraud examination, including anti-corruption, anti-bribery, business valuation, litigation support, expert witness, and cyber security (Rezaee & Wang, Citation2019). Auditors then gather evidence to conduct those audits and make the report based on the purpose.
The financial statement audit starts when the management assertion is available, contrasting with forensic and internal audits. The internal audit can be conducted during the whole financial year. The audit process contains several phases: planning, testing, and reporting. The planning includes understanding the entity and its environment, as well as identifying and assessing the risk of material misstatement. The testing contains tests of control, tests of substantive, and tests of details of balances. Auditors make the reports in the final step of the audit, specifically, in the financial audit, they form an opinion on financial statements (Arens et al., Citation2023; Werner et al., Citation2021). For 60% of article samples, data visualization was utilized in the planning phases. The use of visualization can optimize the client’s business and industry understanding activities, perform preliminary analytical procedures, and conduct risk assessments to identify significant risks due to fraud and error. The risk identification can be obtained from the patterns resulting from the data analysis by combining financial and non-financial transactions. Data visualization at the audit planning stage helps determine many indications of a suspicious risk of material misstatement or fraud and is used to determine the relevant audit procedures. D. A. Appelbaum et al. (Citation2018) and Chang and Luo (Citation2021) stated that data visualization could be implemented in the whole audit process, which complements the audit practice. The stream also appears from the research on the internal audit topic (H. Li et al., Citation2018; Rakipi et al., Citation2021; Smidt et al., Citation2019; F. Tang et al., Citation2017) since the internal audit can be conducted during the financial year.
Auditors use several tools or applications to provide data visualization. A mainstream application such as Audit Command Language (ACL) has become market-leading for producing data visualization (Smidt et al., Citation2019). It performs the visualization beyond standard charts and tables. Other popular applications used are Caseware IDEA and Tableau (Dilla & Raschke, Citation2015; Smidt et al., Citation2019). With regards to risk-based audit practice, it can be optimized by utilizing the data visualization tools and capabilities due to their great potential to find better information to determine risk. The main goal is to conduct preliminary judgment on the client in the most efficient way possible. It can reduce the time and cost required for auditors to complete audit activities. The data visualization can increase auditors’ probability of effectively conducting the audit and improving its quality.
5. Conclusion and further study
The present study offers a thorough overview of the literature on data visualization within the auditing field. The study stands as the inaugural review that delves into the trends and practices of data visualization literature, drawing insights from preceding studies. The results revealed a total of 35 relevant articles published across various journals and publishers. Notably, the study found that Elsevier emerged as the most influential publisher, garnering the highest number of citations in the scholarly pertaining to the subject matter. The VOSviewer analysis revealed that prominent authors cited in the sampled articles include Vasarhelyi, M. A., Alles, M. G., Kogan, A., and Appelbaum, D. Furthermore, co-citation analysis indicated that citations primarily concentrate on big data’s influence in accounting and auditing, splitting into two main themes: general implications for the field and specific effects on audit practices and evidence. The study trend demonstrated a variable pattern in the years of publication since it was a relatively new topic of research area, with the highest volume observed in 2021. Most of papers employed qualitative methods and conceptual approaches. It suggested that prior studies put emphasis on establishing a foundational understanding. Furthermore, the analysis observed that the financial audit was the most frequently discussed in prior studies when discussing data visualization, followed by the internal audit.
The research identified several data visualization capabilities from prior studies that will improve the audit quality: (1) discover new and meaningful patterns, anomalies, and suspicious information; (2) enable to analyze large data set; (3) improve the efficiency and effectiveness;; (4) enable the conduction of sophisticated analysis; (5) combine structured and unstructured data; (6) increase accuracy and reliability; (7) real-time dashboarding: continuous auditing and continuous monitoring; (8) enable to provide a dashboard with interactive visualization; and (9) make a better, faster, and confident decision. In addition, most data visualization utilization was placed at the audit planning stage, which was expected to increase the efficiency and effectiveness of the overall audit process.
The study has significant implications for practitioners and academicians. For practitioners, the literature points out that data visualization is practicable for any type of audit and any part of audit processes. The data visualization supports the transformation of audit processes from traditional to modern audits, leading to continuous auditing and monitoring practices. It implies that every stakeholder in auditing (e.g. auditors, companies, and professional association) may consider complementing the existing audit with data visualization. The auditors can optimize existing tools using data visualization to collect and evaluate audit evidence and improve audit quality. The companies as auditees should realize that the auditors will use digital data as a primary source of information to apply the data visualization. This suggests the necessity of digitalization growth in the whole of companies’ business processes. The audit profession should provide technical guidance and direction on which parts of the audit can be improved by data visualization. Moreover, audit firms recently started investing significant resources into research designed to explore potential applications of big data visualizations, which are among the fastest-growing practice areas at the larger offices of the Big 4 firms (A. Rose et al., Citation2017).
The research extended the accounting information system and auditing literature, revealing the research gap for academicians. The study contributes to enhancing the current of the state of the art of data visualization in auditing. It directs future researchers toward unhighlighted areas unnoticed by prior studies. The results showed that the data visualization topics in auditing are still in the early stages. It indicates more research is required to extend the discussion and shape the body of knowledge. Further research needs to highlight more empirical studies regarding prior studies’ pre-built conceptual research of data visualization. Future researchers can investigate research outside of the financial audit field to give a broader perspective on data visualization studies and practices. Future research is recommended to bring more insights and focus into the area that is related to the topic, such as big data and data analytics; information processing issues such as auditor’s ability to deal with large amounts of data; investor expectation and board of directors’ perception on modern audit; and data visualization role in the continuous auditing and continuous monitoring practices. Nevertheless, the research comes with certain limitations. Firstly, there is a chance that pertinent sources may have been unintentionally omitted from the selected electronic database, potentially impacting the extensiveness of this SLR. Secondly, despite the implementation of meticulous research procedures, there remains a possibility of bias in the research (Tranfield et al., Citation2003).
Author contributions
Conceptualization, M.A.M., S.M., S.W., H.S.; methodology, M.A.M.; data analysis, M.AM., S.M.; drafting, M.A.M.; reviewing, S.M., S.W., H.S. All authors have reviewed and consented to the finalized form of the manuscript for publication.
Acknowledgement
We express our gratitude to Prof. Yudi Azis (Department of Management, Universitas Padjadjaran, Indonesia) and Citra Sukmadilaga, Ph.D. (Department of Accounting, Universitas Padjadjaran, Indonesia) for their significant contributions to the quality and comprehensiveness of this article.
Disclosure statement
No potential conflict of interest was reported by the author(s).
Data availability statement
The sharing of data is not relevant to this study since no new data were generated or analyzed.
Additional information
Funding
Notes on contributors
Muhammad Alam Mauludina
Muhammad Alam Mauludina is a doctoral candidate at Department of Accounting, Universitas Padjadjaran, Indonesia and a lecturer in Accounting, Vocational School of IPB University, Indonesia.
Sri Mulyani
Sri Mulyani is a lecturer at Department of Accounting, Universitas Padjadjaran, Indonesia.
Srihadi Winarningsih
Srihadi Winarningsih is a lecturer at Department of Accounting, Universitas Padjadjaran, Indonesia.
Hendra Susanto
Hendra Susanto is currently working as a Board Member of the Audit Board of the Republic of Indonesia and a lecturer at Department of Accounting, Universitas Sriwijaya, Indonesia.
References
- Aboud, A., & Robinson, B. (2022). Fraudulent financial reporting and data analytics: An explanatory study from Ireland. Accounting Research Journal, 35(1), 21–36. https://doi.org/10.1108/ARJ-04-2020-0079
- Achdiat, I., Mulyani, Sri., Azis, Y., & Sukmadilaga, C. (2022). Roles of organizational learning culture in promoting innovation. Learning Organization, 30(1), 76–92. https://doi.org/10.1108/TLO-01-2021-0013.
- Ahmad, F. (2019). A systematic review of the role of Big Data Analytics in reducing the influence of cognitive errors on the audit judgement. Revista de Contabilidad, 22(2), 187–202. https://doi.org/10.6018/rcsar.382251
- Ain, N. U., Vaia, G., DeLone, W. H., & Waheed, M. (2019). Two decades of research on business intelligence system adoption, utilization and success – A systematic literature review. Decision Support Systems, 125(April), 113113. https://doi.org/10.1016/j.dss.2019.113113
- Alatawi, I. A., Ntim, C. G., Zras, A., & Elmagrhi, M. H. (2023). CSR, financial and non-financial performance in the tourism sector: A systematic literature review and future research agenda. International Review of Financial Analysis, 89(June), 102734. https://doi.org/10.1016/j.irfa.2023.102734
- Alawadhi, A. (2015). The application of data visualization in auditing. Rutgers University.
- Alles, M., & Gray, G. L. (2016). Incorporating big data in audits: Identifying inhibitors and a research agenda to address those inhibitors. International Journal of Accounting Information Systems, 22, 44–59. https://doi.org/10.1016/j.accinf.2016.07.004
- Almaqtari, F. A., Al-Hattami, H. M., Al-Nuzaili, K. M. E., & Al-Bukhrani, M. A. (2020). Corporate governance in India: A systematic review and synthesis for future research. Cogent Business & Management, 7(1), 1803579. https://doi.org/10.1080/23311975.2020.1803579
- Alzamil, Z. S., Appelbaum, D., Glasgall, W., & Vasarhelyi, M. A. (2021). Applications of data analytics: Cluster analysis of not-for-profit data. Journal of Information Systems, 35(3), 199–221. https://doi.org/10.2308/ISYS-2020-025
- American Institute of Certified Public Accountants. (2015). Audit analytics and continuous audit: Looking toward the future. American Institute of Certified Public Accountants, Inc. http://www.aicpa.org/InterestAreas/FRC/AssuranceAdvisoryServices/DownloadableDocuments/AuditAnalytics_LookingTowardFuture.pdf
- Appelbaum, D., Kogan, A., & Vasarhelyi, M. A. (2017). Big data and analytics in the modern audit engagement: Research needs. AUDITING: A Journal of Practice & Theory, 36(4), 1–27. https://doi.org/10.2308/ajpt-51684
- Appelbaum, D. A., Kogan, A., & Vasarhelyi, M. A. (2018). Analytical procedures in external auditing: A comprehensive literature survey and framework for external audit analytics. Journal of Accounting Literature, 40(1), 83–101. https://doi.org/10.1016/j.acclit.2018.01.001
- Appelbaum, D., Kozlowski, S., Vasarhelyi, M. A., & White, J. (2016). Designing CA/CM to fit not-for-profit organizations. Managerial Auditing Journal, 31(1), 87–110. https://doi.org/10.1108/MAJ-10-2014-1118
- Ardito, L., Scuotto, V., Del Giudice, M., & Petruzzelli, A. M. (2019). A bibliometric analysis of research on Big Data analytics for business and management. Management Decision, 57(8), 1993–2009. https://doi.org/10.1108/MD-07-2018-0754
- Arens, A. A., Elder, R. J., Beasley, M. S., & Hogan, C. E. (2023). Auditing and assurance services (18th ed.). Pearson.
- Brown-Liburd, H., Issa, H., & Lombardi, D. (2015). Behavioral implications of Big Data’s impact on audit judgment and decision making and future research directions. Accounting Horizons, 29(2), 451–468. https://doi.org/10.2308/acch-51023
- Buchheit, S., Dzuranin, A. C., Hux, C., & Riley, M. E. (2020). Data visualization in local accounting firms: Is slow technology adoption rational? Current Issues in Auditing, 14(2), A15–A24. https://doi.org/10.2308/ciia-2019-501
- Cao, M., Chychyla, R., & Stewart, T. (2015). Big Data analytics in financial statement audits. Accounting Horizons, 29(2), 423–429. https://doi.org/10.2308/acch-51068
- CGMA. (2013). From insight to impact: Unlocking opportunities in big data, http://www.cgma.org/Resources/Reports/DownloadableDocuments/From_insight_to_impact-executive_summary.pdf
- Chang, C. J., & Luo, Y. (2021). Data visualization and cognitive biases in audits. Managerial Auditing Journal, 36(1), 1–16. https://doi.org/10.1108/MAJ-08-2017-1637
- Chen, H., H.L. Chiang, R., & C. Storey, V. (2012). Business intelligence and analytics: From big data to big impact. MIS Quarterly, 36(4), 1165–1188. https://doi.org/10.2307/41703503
- Christensen, T., Rose, A. M., Rose, J. M., & Sanderson, K. (2022). Effects of data visualizations on jurors’ judgments. Behavioral Research in Accounting, 34(1), 23–41. https://doi.org/10.2308/BRIA-2021-005
- Dagilienė, L., & Klovienė, L. (2019). Motivation to use big data and big data analytics in external auditing. Managerial Auditing Journal, 34(7), 750–782. https://doi.org/10.1108/MAJ-01-2018-1773
- De Santis, F., & D’Onza, G. (2021). Big data and data analytics in auditing: In search of legitimacy. Meditari Accountancy Research, 29(5), 1088–1112. https://doi.org/10.1108/MEDAR-03-2020-0838
- Dilla, W. N., & Raschke, R. L. (2015). Data visualization for fraud detection: Practice implications and a call for future research. International Journal of Accounting Information Systems, 16, 1–22. https://doi.org/10.1016/j.accinf.2015.01.001
- Earley, C. E. (2015). Data analytics in auditing: Opportunities and challenges. Business Horizons, 58(5), 493–500. https://doi.org/10.1016/j.bushor.2015.05.002
- Gepp, A., Linnenluecke, M. K., O’Neill, T. J., & Smith, T. (2018). Big data techniques in auditing research and practice: Current trends and future opportunities. Journal of Accounting Literature, 40(1), 102–115. https://doi.org/10.1016/j.acclit.2017.05.003
- Guo, K. H., Yu, X., & Wilkin, C. (2021). A picture is worth a thousand journal entries: Accounting graph topology for auditing and fraud detection. Journal of Information Systems, 36(2), 53–81. https://doi.org/10.2308/ISYS-2021-003
- Haggerty, J., Haggerty, S., & Taylor, M. (2014). Forensic triage of email network narratives through visualisation. Information Management & Computer Security, 22(4), 358–370. https://doi.org/10.1108/IMCS-11-2013-0080
- Hamdam, A., Jusoh, R., Yahya, Y., Abdul Jalil, A., & Zainal Abidin, N. H. (2021). Auditor judgment and decision-making in big data environment: A proposed research framework. Accounting Research Journal, 35(1), 55–70. https://doi.org/10.1108/ARJ-04-2020-0078
- Hazaea, S. A., Zhu, J., Al-Matari, E. M., Senan, N. A. M., Khatib, S. F. A., & Ullah, S. (2021). Mapping of internal audit research in China: A systematic literature review and future research agenda. Cogent Business & Management, 8(1), 1–23. https://doi.org/10.1080/23311975.2021.1938351
- Hezam, Y. A. A., Anthonysamy, L., & Suppiah, S. D. K. (2023). Big Data analytics and auditing: A review and synthesis of literature. Emerging Science Journal, 7(2), 629–642. https://doi.org/10.28991/ESJ-2023-07-02-023
- Jacky, Y., & Sulaiman, N. A. (2022). The use of data analytics in external auditing: A content analysis approach. Asian Review of Accounting, 30(1), 31–58. https://doi.org/10.1108/ARA-11-2020-0177
- Kitchenham, B. (2004). Procedures for performing systematic reviews. Keele University and NICTA.
- Knudsen, D.-R. (2020). Elusive boundaries, power relations, and knowledge production: A systematic review of the literature on digitalization in accounting. International Journal of Accounting Information Systems, 36, 100441. https://doi.org/10.1016/j.accinf.2019.100441
- Krahel, J. P., & Titera, W. R. (2015). Consequences of Big Data and formalization on accounting and auditing standards. Accounting Horizons, 29(2), 409–422. https://doi.org/10.2308/acch-51065
- Krieger, F., Drews, P., & Velte, P. (2021). Explaining the (non-) adoption of advanced data analytics in auditing: A process theory. International Journal of Accounting Information Systems, 41, 100511. https://doi.org/10.1016/j.accinf.2021.100511
- Li, H., Dai, J., Gershberg, T., & Vasarhelyi, M. A. (2018). Understanding usage and value of audit analytics for internal auditors: An organizational approach. International Journal of Accounting Information Systems, 28, 59–76. https://doi.org/10.1016/j.accinf.2017.12.005
- Li, S., Fisher, R., & Falta, M. (2021). The effectiveness of artificial neural networks applied to analytical procedures using high level data: A simulation analysis. Meditari Accountancy Research, 29(6), 1425–1450. https://doi.org/10.1108/MEDAR-06-2020-0920
- Liang, T. P., & Liu, Y. H. (2018). Research landscape of business intelligence and Big Data analytics: A bibliometrics study. Expert Systems with Applications, 111(128), 2–10. https://doi.org/10.1016/j.eswa.2018.05.018
- Lokanan, M. E. (2019). Data mining for statistical analysis of money laundering transactions. Journal of Money Laundering Control, 22(4), 753–763. https://doi.org/10.1108/JMLC-03-2019-0024
- Lurie, N. H., & Mason, C. H. (2007). Visual representation: Implications for decision making. American Behavioral Scientist, 71, 160–177. https://doi.org/10.1177/0002764204266234
- Ma, R. (2023). Construction of a social audit platform based on big data for “industry price, quality and credit.” Applied Mathematics and Nonlinear Sciences, 8(2), 1339–1354. https://doi.org/10.2478/amns.2023.1.00039
- Manita, R., Elommal, N., Baudier, P., & Hikkerova, L. (2020). The digital transformation of external audit and its impact on corporate governance. Technological Forecasting and Social Change, 150, 119751. https://doi.org/10.1016/j.techfore.2019.119751
- Mauludina, M. A., Azis, Y., Sukmadilaga, C., & Susanto, H. (2023). Determinants of SOE’s performance: A systematic literature review. Cogent Business & Management, 10(2), 1–31. https://doi.org/10.1080/23311975.2023.2234138
- Mauludina, M. A., Mulyani, S., & Adrianto, Z. (2023). Critical success factors for implementation of self-service business intelligence in management accounting. Academic Journal of Interdiciplinary Studies, 12(3), 291–307.
- Moll, J., & Yigitbasioglu, O. (2019). The role of internet-related technologies in shaping the work of accountants: New directions for accounting research. The British Accounting Review, 51(6), 100833. https://doi.org/10.1016/j.bar.2019.04.002
- Mugwira, T. (2022). Internet related technologies in the auditing profession: A WOS bibliometric review of the past three decades and conceptual structure mapping. Revista de Contabilidad, 25(2), 201–216. https://doi.org/10.6018/rcsar.428041
- Nguyen, T. H. H., Ntim, C. G., & Malagila, J. K. (2020). Women on corporate boards and corporate financial and non-financial performance: A systematic literature review and future research agenda. International Review of Financial Analysis, 71(June), 101554. https://doi.org/10.1016/j.irfa.2020.101554
- Petticrew, M., & Roberts, H. (2006). Systematic reviews in the social sciences: A practical guide. Blackwell Publishing. https://doi.org/10.1002/9780470754887
- Rakipi, R., De Santis, F., & D’Onza, G. (2021). Correlates of the internal audit function’s use of data analytics in the big data era: Global evidence. Journal of International Accounting, Auditing and Taxation, 42, 100357. https://doi.org/10.1016/j.intaccaudtax.2020.100357
- Raveh, E., Ofek, Y., Bekkerman, R., & Cohen, H. (2020). Applying Big Data visualization to detect trends in 30 years of performance reports. Evaluation, 26(4), 516–540. https://doi.org/10.1177/1356389020905322
- Rezaee, Z., & Wang, J. (2019). Relevance of big data to forensic accounting practice and education. Managerial Auditing Journal, 34(3), 268–288. https://doi.org/10.1108/MAJ-08-2017-1633
- Richins, G., Stapleton, A., Stratopoulos, T. C., & Wong, C. (2017). Big data analytics: Opportunity or threat for the accounting profession. Journal of Information Systems, 31(3), 63–79. https://doi.org/10.2308/isys-51805
- Rose, A., Rose, J. M., Sanderson, K.-A., & Thibodeau, J. (2017). When should audit firms introduce analyses of Big Data into the audit process? Journal of Information Systems, 31(3), 81–99. https://doi.org/10.2308/isys-51837
- Rose, A. M., Rose, J. M., Rotaru, K., Sanderson, K.-A., & Thibodeau, J. (2021). Effects of data visualization choices on psychophysiological responses, judgment and audit quality. Journal of Information Systems, 36(1), 53–79. https://doi.org/10.2308/ISYS-2020-046
- Saggi, M. K., & Jain, S. (2018). A survey towards an integration of big data analytics to big insights for value-creation. Information Processing & Management, 54(5), 758–790. https://doi.org/10.1016/j.ipm.2018.01.010
- Sekaran, U., & Bougie, R. (2016). Research methods for business: A skill-building approach (7th ed.). Wiley.
- Singh, K., & Best, P. (2016). Interactive visual analysis of anomalous accounts payable transactions in SAP enterprise systems. Managerial Auditing Journal, 31(1), 35–63. https://doi.org/10.1108/MAJ-10-2014-1117
- Singh, K., & Best, P. (2019). Anti-money laundering: Using data visualization to identify suspicious activity. International Journal of Accounting Information Systems, 34, 100418. https://doi.org/10.1016/j.accinf.2019.06.001
- Singh, K., & Best, P. J. (2015). Design and implementation of continuous monitoring and auditing in SAP enterprise resource planning. International Journal of Auditing, 19(3), 307–317. https://doi.org/10.1111/ijau.12051
- Sledgianowski, D., Gomaa, M., & Tan, C. (2017). Toward integration of Big Data, technology and information systems competencies into the accounting curriculum. Journal of Accounting Education, 38, 81–93. https://doi.org/10.1016/j.jaccedu.2016.12.008
- Smidt, L., Ahmi, A., Steenkamp, L., van der Nest, D. P., & Lubbe, D. (2019). A maturity-level assessment of generalised audit software: Internal audit functions in Australia. Australian Accounting Review, 29(3), 516–531. https://doi.org/10.1111/auar.12252
- Snyder, H. (2019). Literature review as a research methodology: An overview and guidelines. Journal of Business Research, 104(August), 333–339. https://doi.org/10.1016/j.jbusres.2019.07.039
- Strijker, D., Bosworth, G., & Bouter, G. (2020). Research methods in rural studies: Qualitative, quantitative and mixed methods. Journal of Rural Studies, 78(June), 262–270. https://doi.org/10.1016/j.jrurstud.2020.06.007
- Tableau. (2019). What is data visualization? Definition, examples, and learning resources. https://www.tableau.com/learn/articles/data-visualization
- Tang, F., Norman, C. S., & Vendrzyk, V. P. (2017). Exploring perceptions of data analytics in the internal audit function. Behaviour & Information Technology, 36(11), 1125–1136. https://doi.org/10.1080/0144929X.2017.1355014
- Tang, J., & Karim, K. E. (2019). Financial fraud detection and big data analytics – Implications on auditors’ use of fraud brainstorming session. Managerial Auditing Journal, 34(3), 324–337. https://doi.org/10.1108/MAJ-01-2018-1767
- Tranfield, D., Denyer, D., & Smart, P. (2003). Towards a methodology for developing evidence-informed management knowledge by means of systematic review. British Journal of Management, 14(3), 207–222. https://doi.org/10.1007/978-3-030-92836-0_28
- Varma, A., Piedepalumbo, P., & Mancini, D. (2021). Big data and accounting: A bibliometric study. International Journal of Digital Accounting Research, 21(September)2020), 203–238. https://doi.org/10.4192/1577-8517-v21_8
- Vasarhelyi, M. A., Kogan, A., & Tuttle, B. M. (2015). Big data in accounting: An overview. Accounting Horizons, 29(2), 381–396. https://doi.org/10.2308/acch-51071
- Werner, M., Wiese, M., & Maas, A. (2021). Embedding process mining into financial statement audits. International Journal of Accounting Information Systems, 41, 100514. https://doi.org/10.1016/j.accinf.2021.100514
- Yan, X. (2024). Research on big data audit based on financial shared service model. Applied Mathematics and Nonlinear Sciences, 9(1), 1–14. https://doi.org/10.2478/amns.2023.2.00604
- Yi, J. S., Kang, Y. A., Stasko, J. T., & Jacko, J. A. (2007). Toward a deeper understanding of the role of interaction in information visualization. IEEE Transactions on Visualization and Computer Graphics, 13(6), 1224–1231. https://doi.org/10.1109/TVCG.2007.70515
- Yoon, K., Hoogduin, L., & Zhang, L. (2015). Big Data as a complementary audit evidence. Accounting Horizons, 29(2), 431–438. https://doi.org/10.2308/acch-51076
- Zhang, J., Yang, X., & Appelbaum, D. (2015). Toward effective big data analysis in continuous auditing. Accounting Horizons, 29(2), 469–476. https://doi.org/10.2308/acch-51070