
 ?Mathematical formulae have been encoded as MathML and are displayed in this HTML version using MathJax in order to improve their display. Uncheck the box to turn MathJax off. This feature requires Javascript. Click on a formula to zoom.
Abstract
Simple, precise, selective, and expeditious spectrophotometric methods have been developed for the determination of itopride (ITO), midodrine (MID), diclofenac (DIC), mesalamine (MES), and sumatriptan (SUM) in their pure form as well as in pharmaceutical preparations. The method was based on ion-pair complex formation between the drugs and anionic dye, bromothymol blue in an acidic medium (pH 2.0–4.0). The yellow colored complexes formed were quantitatively extracted into chloroform and measured at 411, 410, 413, 412, and 414 nm wavelength for ITO, MID, DIC, MES, and SUM, respectively. Beer’s law was obeyed in the concentration range of 3.0–30 µg/mL for ITO, 1.0–20 µg/mL for MID, 1.5–40 µg/mL for DIC, 1.2–12 µg/mL for MES, and 0.5–15 µg/mL for SUM. The stoichiometry of the complexes formed between the drugs and the dye was 1:1 as determined by Job’s method of continuous variation. The association constant (KIP) of the ion-pair complexes formed was evaluated using Benesi–Hildebrand equation. Limit of detection, limit of quantification, and Sandell’s sensitivity of the methods were also estimated. The proposed methods were successfully employed for the determination of these drugs in their pharmaceutical dosage forms.
Public Interest Statement
The work described in this article highlights the importance of one of the most widely used analytical technique like spectrophotometry. This has been the technique of choice for analysts and researchers to estimate drugs in quality control labs as it is simple, economical, and gives acceptable results. Five drugs, namely itopride, midodrine, diclofenac, mesalamine, and sumatriptan have been reliably determined using spectrophotometry by utilizing a simple phenomenon of ion-pair complex formation between the drugs and a commonly used dye, bromothymol blue. The results were extensively validated as per standard guidelines and the method was successfully used to analyze these drugs in their commercial formulations with acceptable accuracy and precision.
1. Introduction
Spectrophotometry-based methods are widely used for the analysis of bulk drugs and in the quality control of marketed pharmaceutical dosage forms as they are much simpler, rapid, cost-effective, and less labor intensive in comparison to other methods. These method provide accurate, precise, and fast results and find extensive use, especially when expensive equipments like HPLC, HPTLC, GC, and electrophoresis are not easily accessible (Gouda, Kotb El-Sayed, Amin, & El Sheikh, Citation2013; Rojas & Ojeda, Citation2009; Siddiqui, Alothman, & Rahman, Citation2013). The estimation of drugs by spectrophotometry can be achieved either by direct measurement of UV light absorption (zero order or derivative spectra) or through some chemical reactions like complex formation (ion-pair, charge-transfer) with specific reagents, oxidation–reduction process, and catalysis (Siddiqui et al., Citation2013).
Itopride (ITO) hydrochloride, a benzamide derivative is novel gastroprokinetic agent which possess acetylcholine esterase inhibitory (ACHE) as well as dopamine D2 receptor antagonist activity. It is useful for the symptomatic treatment of various gastrointestinal disorders, including functional dyspepsia and gastroesophageal reflux disease (Yoon et al., Citation2014). It functions by increasing acetylcholine concentrations which lowers the esophageal sphincter pressure, stimulates gastric motility, accelerates gastric emptying, and improves gastroduodenal coordination (Huang, Lv, Zhang, Fan, & Meng, Citation2012).
Midodrine (MID) hydrochloride is a vasopressor and a prodrug which is preferably used for the treatment of symptomatic orthostatic hypotension. Its active metabolite desglymidodrine is an alpha 1-adrenoceptor agonist and exerts its actions via activation of the alpha-adrenergic receptors of the arteriolar and venous vasculature, producing an increase in vascular tone and elevation of blood pressure (Biaggioni, Citation2014; Izcovich, Gonzalez Malla, Manzotti, Catalano, & Guyatt, Citation2014).
Diclofenac (DIC) sodium is a non-steroidal anti-inflammatory drug which is widely used as an analgesic, antipyretic, and anti-inflammatory agent. The primary mechanism of action is by preventing prostaglandin synthesis by inhibition of cyclooxygenase. Further, it is reported to exhibit bacteriostatic activity by inhibiting bacterial DNA synthesis (Dutta et al., Citation2000).
Mesalamine (MES) belongs to a class of drugs known as aminosalicylates. It is an anti-inflammatory drug used to treat inflammatory bowel disease, such as ulcerative colitis and as first-line therapy for mild-to-moderate Crohn’s disease. It helps to lessen symptoms of ulcerative colitis such as diarrhea, rectal bleeding, and stomach pain (Nanda & Moss, Citation2012; Sandborn, Feagan, & Lichtenstein, Citation2007).
Sumatriptan (SUM) succinate belongs to a class of tryptamine-based drugs used in the acute treatment of migraine headaches and was the first antimigraine agent to be approved by the US FDA in 1991 (Deleu & Hanssens, Citation2000). Triptans acts by selectively binding to serotonin type-1D receptors (serotonin agonist). They block vasoconstriction and transmission of signals to the trigeminal nucleus and thus prevent peripheral sensitization (Khoury & Couch, Citation2010).
Extensive literature survey reveals different analytical methods for the determination of ITO (Choudhary, Goyel, & Khokra, Citation2009; Gupta, Joshi, Chawla, & Wadodkar, Citation2010; Khalil, Citation2013; Ptáček, Klíma, & Macek, Citation2009; Suganthi, John, & Ravi, Citation2008; Thiruvengada Rajan et al., Citation2010; Walash, Ibrahim, Eid, & El Abass, Citation2013; Zate, Kothawade, Gajbe, Pramod, & Boraste, Citation2010), MID (El-Gindy, Sallam, & Abdel-Salam, Citation2008; Elzanfaly, Zaazaa, & Merey, Citation2013; Sattar, Rezk, Badawy, & Khattab, Citation2013; Yoshida et al., Citation2003), DIC (Abdel-Hamid, Novotny, & Hamza, Citation2001; Hosseinzadeh, Maleki, & Matin, Citation2007; Khaskheli et al., Citation2009; Lala, D’Mello, & Naik, Citation2002; Matin, Farajzadeh, & Jouyban, Citation2005; Mazurek & Szostak, Citation2008), MES (Chandra et al., Citation2011; Darak, Karadi, Arshad, & Raju, Citation2011; Hamdon, Zakaria, & AL-Hamdany, Citation2012; Jejurkar & Jejurkar, Citation2012; Reddy, Prabhavathi, Reddy, & Reddy, Citation2011; Jejurkar, Tapar, Game, Birari, & Ghenge, Citation2011; Sama, Gurupadayya, & Kumar, Citation2011; Singh, Patel, & Gupta, Citation2010; Zakaria, Citation2013) and SUM (Ge, Tessier, Neirinck, & Zhu, Citation2004; Kalyana & Raghubabu, Citation2010, Citation2011a, Citation2011b, Citation2011c; Kalyana, Rupakumari, Ramarao, & Raghubabu, Citation2011; Prashanth, Basavaiah, & Raghu, Citation2013; Shah, Suhagia, Shah, & Shah, Citation2008; Sharma, Citation2013) in pharmaceutical preparations and biological samples. These methods have employed different analytical techniques like spectrophotometry, spectrofluorometry, ion-selective electrodes, ICP-AES, FT-Raman, HPTLC, HPLC-UV, HPLC-fluorescence, and LC-MS/MS.
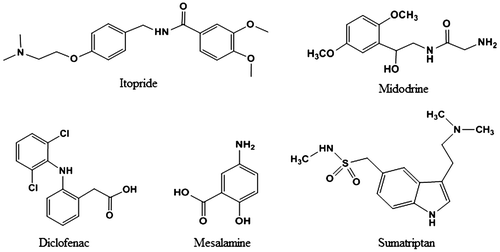
The main aim of the present work was to develop specific, rapid, and cost-effective methods for the determination of selected drugs (ITO, MID, DIC, MES, and SUM) in pure form and in tablet formulation by UV–Visible spectrophotometry. The chemical structures of the studied drugs are shown in Figure . An anionic dye, bromothymol blue (BTB), was used in these methods to form ion-pair complexes with the drugs under acidic conditions, which were further extracted into chloroform. The methods gave accurate and precise results with an advantage of speed and simplicity and can be readily applied in quality control labs.
Figure 1. Chemical structures of the drugs.
2. Experimental
2.1. Equipment
A Jasco V-570 double beam UV–Visible spectrophotometer from Jasco International Co. Ltd (Tokyo, Japan) was used for the measurement of spectra using 10-mm matched quartz cell. Accuracy of wavelength was within ±0.5 nm and for all the methods bandwidth was kept constant at 1 nm. Spectra manager software version 1.53.01 was used for data processing. A digital pH meter of Li 127 Elico from Elico Ltd (Hyderabad, India) was used to measure the pH. Sartorius GD503 (Bradford, MA, USA) analytical balance, having a readability of 0.0001 g was employed for weighing of substances. Varivol II micropipettes from HiMedia Laboratories Pvt. Ltd (Mumbai, India) with a varying volume capacity of 0.5–5.0 mL were utilized for accurate and precise transfer of solutions.
2.2. Reagents and materials
Reference standards of itopride hydrochloride (99.33%), midodrine hydrochloride (99.13%), diclofenac sodium (98.69%), mesalamine (99.60%), and sumatriptan succinate (98.77%) were purchased from Clearsynth Labs Pvt. Ltd (Mumbai, India). For extraction, spectroscopic grade chloroform was obtained from Mallinckrodt Baker, S.A.de C.V. (Estado de Mexico, Mexico). Analytical grade bromothymol blue (BTB) was procured from S. D. Fine Chem. (Mumbai, India) and used without further purification. Deionized water used in the study was prepared using Milli-Q water purification system from Millipore (Bangalore, India). Pharmaceutical formulations, Ganaton® (Itopride hydrochloride) 50-mg tablet, Abbott Japan Co. (Tokyo, Japan), ProAmatine® (midodrine hydrochloride)10 mg tablets, Shire US Inc. (Newport, USA), Voltaren® (diclofenac sodium) 50 mg tablets, Novartis Pharmaceuticals Australia Pty Ltd (NSW, Australia), Walasa® (mesalamine) 400 mg tablet, Wallace Pharmaceuticals Ltd (Goa, India) and Sumitrx® (sumatriptan succinate) 50 mg tablets, Sun Pharmaceutical Industries Ltd (Mumbai, India) were obtained from commercial sources.
2.3. Solution preparation
Standard stock solutions of the drugs (1.0 mg/mL) were prepared in deionized water. Further, their working solutions in the calibration concentration range were prepared by suitable dilution of the stock solution with water. The stock solution of BTB solution (0.10%) was prepared in deionized water.
2.4. General extraction procedure
Into a series of glass tubes, 1.0 mL of working solutions of the drugs in the concentration range, (ITO (15–150 µg/mL), MID (5–100 µg/mL), DIC (7.5–200 µg/mL), MES (6.0–60 µg/mL), and SUM (2.5–75 µg/mL)) were transferred. The pH of the solutions was set using 0.1 M HCl (pH 2.0 for ITO, MID and DIC; pH 3.0 for MES and pH 4.0 for SUM), followed by addition of 1.0 mL of 0.10% BTB solution. The volume in each tube was adjusted to 5.0 mL with deionized water and then extracted using 5.0-mL chloroform in a vortex mixer for 2.0 min. The layers were allowed to separate after complete extraction and the yellow colored chloroform layer containing the ion-pair complex of the drugs was measured against their respective reagent blank solutions. The reagent blank was prepared in a similar manner without the drug. All extractions were carried out at room temperature (25 ± 0.5°C).
2.5. Sample preparation for formulations
Twenty tablets of each drug (ITO, MID, DIC, MES, and SUM) were separately weighed and grounded into fine powered. An amount equivalent to one tablet (50 mg for ITO, DIC and SUM, 10 mg for MID and 400 mg for MES) was accurately weighed and transferred to 100-mL (500 mL for MES) volumetric flasks containing 50-mL deionized water (250 mL for MES). The contents of the flasks were sonicated for 15 min to dissolve the drugs and the volume was completed with deionized water. The resulting solutions were filtered through 0.45 μ membrane filter and diluted appropriately with water before measurements.
3. Results and discussion
Literature presents several extractive spectrophotometric methods based on ion-pair complex formation for the estimation of drugs in their pharmaceutical preparations. Association of two oppositely charged species at a suitable pH results in the formation of an ion-pair complex. Quantitation of several pharmaceutical compounds can be done by ion-pair extractive spectrophotometry. The ion-pair complexes formed by interaction of basic moieties having primary, secondary, or tertiary amino group with different anionic dyes in aqueous medium can be readily extracted into immiscible organic diluents. Reported procedures have utilized different dyes like methyl orange for ITO (Choudhary et al., Citation2009), ninhydrin for MID (El-Gindy et al., Citation2008), bromocresol green and bromocresol purple for MES (Darak et al., Citation2011), and naphthalene blue 12 BR and methylene blue for SUM (Kalyana & Raghubabu, Citation2011c). Figure shows the selected drugs have primary, secondary, or tertiary amino groups which can be easily protonated under acidic conditions. Ion-pairs formed with the anionic dye, BTB, can be readily used for determination of these drugs in bulk and pharmaceutical dosage forms. In the present work, spectrophotometric methods have been developed based on the extraction of ion-pairs of ITO, MID, DIC, MES, and SUM with BTB into chloroform from acidic solutions. Further, for quantitative measurements different conditions like wavelength for measurement, pH, organic diluents, BTB concentration, and shaking time were optimized for maximum stability of ion-pair complexes. The absorption spectra of the drugs and BTB are shown in Figure . The absorption maxima for ITO, MID, DIC, MES, SUM, and BTB were observed at 257, 291, 276, 301, 283, and 411 nm, respectively.
Figure 2. Representative absorption spectra of studied drugs (ITO (20 µg/mL), MID (120 µg/mL), DIC (20 µg/mL), MES (30 µg/mL), and SUM (100 µg/mL)) and BTB (0.1%) in aqueous medium.
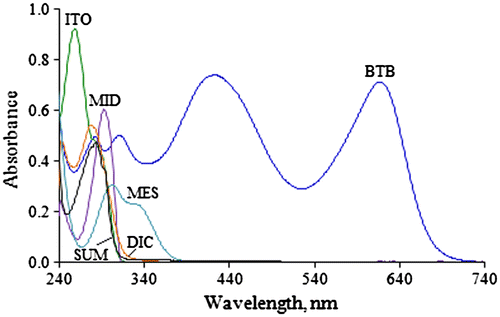
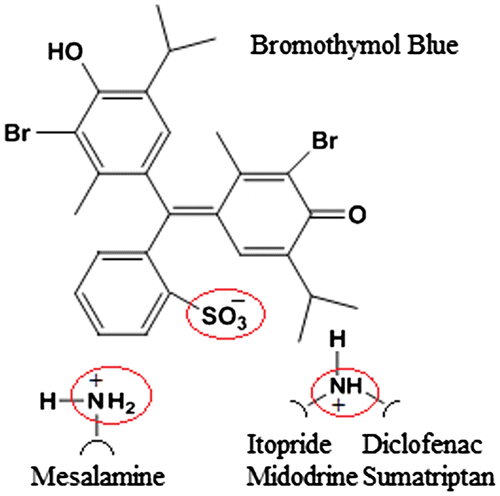
Figure (a–e) shows the absorbance of ion-pair complexes of these drugs with BTB in chloroform. For quantitative measurements, the selected wavelengths were 411, 410, 413, 412, and 414 nm for ITO, MID, DIC, MES, and SUM, respectively. The response obtained at these wavelengths was reproducible and linear. The suggested mechanism of drugs and BTB ion-pair complex formation is illustrated in Figure .
Figure 3. Ion-pair complex formation of BTB with (a) ITO (3.0–30 µg/mL), (b) MID (1.0–20 µg/mL), (c) DIC (1.5–40 µg/mL), (d) MES (1.2–12 µg/mL), and (e) SUM (0.5–15 µg/mL)] in chloroform.
![Figure 3. Ion-pair complex formation of BTB with (a) ITO (3.0–30 µg/mL), (b) MID (1.0–20 µg/mL), (c) DIC (1.5–40 µg/mL), (d) MES (1.2–12 µg/mL), and (e) SUM (0.5–15 µg/mL)] in chloroform.](/cms/asset/583283ae-7dcf-44ae-b9bb-cf162bb50f40/oach_a_1075852_f0003_oc.gif)
Figure 4. Plausible mechanism of ion-pair complex formation between the drugs and the anionic dye, bromothymol blue.
3.1. Optimization of extraction conditions
3.1.1. Selection of extraction solvent
To study the effect of extracting solvent on ion-pair complexes, the following solvents were investigated ethyl acetate, chloroform, carbon tetrachloride, and dichloromethane. It was found that chloroform offered enhanced efficiency for color intensity as well provided selective extraction in comparison to the other solvents and hence it was selected in the present work. Moreover, to achieve quantitative recovery for all the complexes one extraction was adequate.
3.1.2. Effect of pH
The effect of pH on the formation of ion-pairs was examined by varying the pH from 2.0 to 6.0 using 0.1 M HCl. The results obtained above pH 6.0 were not reproducible. The maximum absorbance of the complexes was found at pH 2.0 for ITO, MID, and DIC, respectively, pH 3.0 for MES and pH 4.0 for SUM, under the optimized conditions.
3.1.3. Effect of BTB concentration
The effect of BTB concentration on the color intensity of the complexes was tested by varying the concentration from 0.01 to 0.20% at the selected wavelengths. Best results were obtained with 0.10% BTB for all the complexes. However, an excess dye (>0.10%) did not affect the color intensity of the complex as well the absorbance.
3.1.4. Effect of shaking mode and time
The affect of different approaches for extracting the ion-pair complexes was assessed by employing a magnetic stirrer, a vortex mixture, and a separating funnel. Although quantitative results were obtained in all three modes of extraction, slightly higher absorbance values were found during vortex mixing. Further, shaking times ranging from 1.0 to 5.0 min was studied and the optimum time for maximum extraction was 2.0 min for all ion-pair complexes.
3.1.5. Effect of temperature and stability of the ion-pair complexes
Temperature effect on ion-pair complexes was studied at 25, 30, and 35°C. It was found that the complexes were stable up to 30°C with negligible change in the absorbance values. Due to the volatile nature of the solvent above this temperature, there was a slight increase (~2–3%) in the absorbance of the complexes. Nevertheless, best results were found at 25°C and all the complexes were stable for a minimum period of 24 h.
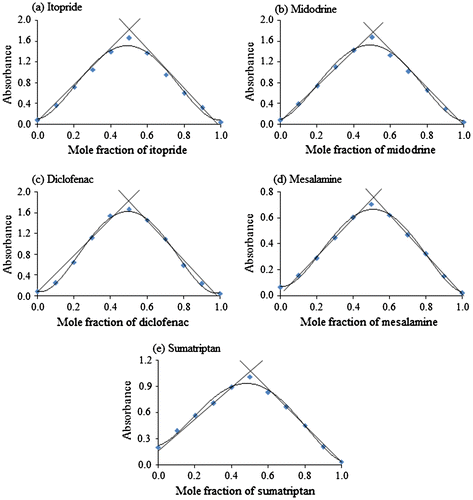
3.1.6. Stoichiometry of ion-pair complexes
Job’s method of continuous variation was employed to determine the composition of the ion-pair complexes (Job, Citation1928). For this, solutions of identical concentrations (1.5 × 10⁻³ M) of the drugs and BTB were prepared and mixed in varying volume ratios such that the total volume of each solution was constant. The absorbance of the resulting complexes was measured at 411, 410, 413, 412, and 414 nm for ITO, MID, DIC, MES, and SUM, respectively. The absorbance values were plotted against the mole fraction of the drugs. The stoichiometry observed for each drug–dye ion-pair complex was 1:1 as evident from the results in Figure .
Figure 5. Job’s plot for ion-pair complexes of BTB with (a) ITO, (b) MID, (c) DIC, (d) MES and (e) SUM in chloroform (1.5 × 10⁻³ M).
3.1.7. Association constants of ion-pair complexes
The association constants for the ion-pair complexes formed between the drugs and the dye were estimated using Benesi–Hildebrand equation (Benesi & Hildebrand, Citation1949) as shown below
where [BTB] and [Drug] are the total concentration of bromothymol blue and drug, respectively, AC is the absorbance of the complex, εC is the molar absorptivity of the ion-pair complex, and KIP is the association constant of drug–dye ion-pair complex. The values for KIP were obtained from the slope of lines obtained by plotting [BTB]/AC against 1/[Drug] for all the drugs. All the plots were linear as shown in Figure .
Figure 6. Benesi–Hildebrand plots for association constants of ion-pair complexes between the drugs and BTB.
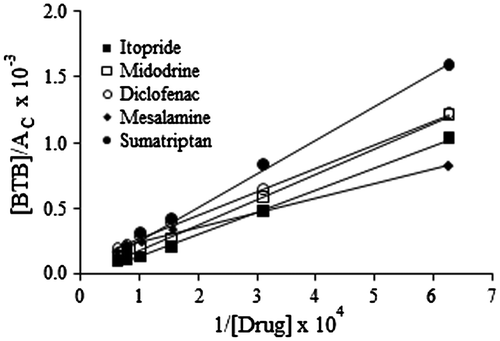
Gibbs free energy (∆G°) values were also computed for the ion-pair complexes according to the relationship, where, KIP is the association constant of drug–dye ion-pair complex, R is the gas constant (8.314 J/mol K), and T is the temperature in Kelvin. Negative values of ∆G° indicate that the reactions were spontaneous and thermodynamically favored (Table ).
Table 1. Association constants of the ion-pair complexes between the drugs and BTB
3.2. Method validation results
3.2.1. Analytical characteristics of the method
The linearity of the methods was established by preparing calibration standards at the following concentrations, 3.0, 6.0, 12.0, 18.0, 24.0, and 30.0 µg/mL concentrations for ITO, 1.0, 4.0, 8.0, 12.0, 16.0, and 20.0 µg/mL for MID, 1.5, 5.0, 10.0, 15.0, 20.0, and 40.0 µg/mL for DIC, 1.2, 2.4, 4.8, 7.2, 9.6, and 12.0 µg/mL for MES and 0.5, 1.0, 2.5, 5.0, 10.0, and 15.0 µg/mL for SUM. A linear relationship was found between the measured absorbance and the concentration range studied for each drug as shown in Figure , with correlation coefficients (r2) ≥ 0.9979. The LOD (limit of detection) and LOQ (limit of quantitation) were calculated using the expression, 3.3s/S and 10s/S, respectively, where “s” is the standard deviation of the blank and “S” is the slope of the calibration line (ICH Harmonised Tripartite Guideline, Citation2005; Shrivastava & Gupta, Citation2011). LOD is defined as the lowest concentration of an analyte that can be reliably detected but not necessarily quantified, while LOQ is taken as the lowest concentration that can be determined with acceptable accuracy and precision, under the optimized experimental conditions. Beer’s law range, molar absorptivity, Sandell’s sensitivity, LOD and LOQ values, slope and intercept of linear graphs for all the drugs are presented in Table .
Figure 7. Calibration curves for ITO, MID, DIC, MES, and SUM at 411, 410, 413, 412, and 414 nm, respectively.
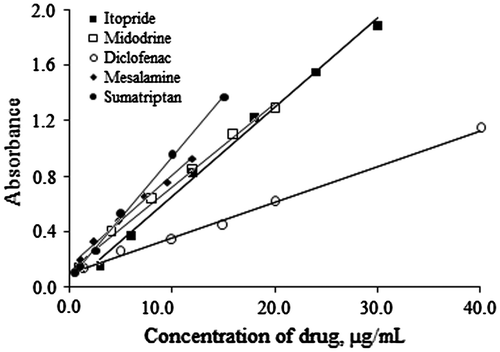
Table 2. Optical characteristics and analytical data for the studied drugs
3.2.2. Accuracy and precision
Quality control (QC) samples were prepared at four concentration levels to evaluate the accuracy and precision of the methods. The concentration levels were 9.00, 12.0, 18.0, and 24.0 µg/mL for ITO, 3.00, 8.00, 12.0, and 16.0 µg/mL for MID, 4.50, 16.0, 24.0, and 32.0 µg/mL for DIC, 3.50, 5.00, 7.50, and 10.0 µg/mL for MES, and 1.50, 6.00, 9.00, and 120.0 µg/mL for SUM. Intra-day and inter-day accuracy (%relative error) and precision (%relative standard deviation, RSD) were determined at these concentration levels using six replicates and the results are shown in Table . The %RSD for intra-day and inter-day varied from 0.49 to 4.04 and 0.67 to 4.49, respectively, for all the drugs. The results indicate acceptable accuracy and precision of the proposed methods for the analysis of these drugs.
Table 3. Intra- and inter-day accuracy and precision data for the selected drugs
3.2.3. Analysis of pharmaceutical formulations
Standard addition technique was employed to check the accuracy (recovery) of the proposed methods. In this experiment, a definite amount of pre-analyzed tablet samples were spiked with pure drug at three levels and the total amount of the drug was found using the proposed methods. This study was performed with five replicates at each level. The recovery of the pure drug was quantitative with %RSD values ranging from 0.19 to 4.01 for all the drugs (Table ). Interference study was also done to check the selectivity of the present method in the presence of commonly used excipients in tablet formulations. This experiment was done by adding the excipients (amount equivalent to five times the upper limit of quantitation of each drug) such as corn starch, microcrystalline cellulose, magnesium stearate, lactose, silicon dioxide, titanium dioxide, and iron oxide individually at two QC levels (lowest and highest concentration) for all the drugs. The results confirm that their presence did not interfere in the quantitative determination of these drugs.
Table 4. Determination of drugs in dosage forms by standard addition method (n = 5)
Additionally, the validity of the proposed method was evaluated by comparing the results obtained using reference methods for each drug with tablet formulations. Table shows that the results obtained were in close agreement and were compared statistically using Student’s t-test for accuracy and F-test for precision at 95% confidence level. The calculated “t” and “F” values were well below the tabulated values (t = 2.77 and F = 6.39, for four degrees of freedom). This proves that the developed methods are not statistically different from the reference method with respect to accuracy and precision.
Table 5. Statistical comparison of the proposed method with reference method for the determination of drugs in tablet formulations (n = 5)
3.2.4. Comparison with reported work
The extractive spectrophotometric methods developed for ITO with methyl orange (Choudhary et al., Citation2009), MES with bromocresol green and bromocresol purple (Darak et al., Citation2011), and SUM with naphthalene blue 12 BR and methylene blue (Kalyana & Raghubabu, Citation2011c) are much less sensitive with an LOQ of 10 µg/mL for ITO, 20/25 µg/mL for MES, and 4.0 µg/mL for SUM as compared to the present methods. Moreover, these methods describe studies related to the analysis of drugs in pharmaceutical preparation with no information about the association constant of ion-pair complexes, their stability, and stoichiometry. For MID and DIC, there are a few direct spectrophotmetric methods available in the literature. In one such method, the primary amino group of MID is reacted with ninhydrin in methanol to give a purple colored complex (El-Gindy et al., Citation2008). Similarly for DIC, a direct method has been proposed by reacting the drug with conc. HNO3 followed by measurement of the yellow colored product (Matin et al., Citation2005). Nevertheless, both these methods may not be adequately selective in the presence of diverse matrix components as demonstrated in the present work.
4. Conclusion
In the proposed method, ion-pair complexes of selected drugs with bromothymol blue were studied under the optimized extraction conditions. Electrostatic interaction takes place between the sulfonic acid group of BTB and primary/secondary nitrogen groups present in drugs. The developed and validated methods are selective, rapid, and economical and the results obtained showed acceptable precision and accuracy, and recovery of the drugs. Additionally, all the drugs were successfully estimated in their pure forms as well as in their respective formulations without any interference from the commonly used additives and excipients.
Acknowledgment
The authors are thankful to the Department of Chemistry, Gujarat University for providing instrumental facilities and infrastructure to carry out this research work.
Additional information
Funding
Notes on contributors
Pranav S. Shrivastav
Our research group belongs to the Analytical Chemistry Division of the Department of Chemistry, Gujarat University, Ahmedabad, Gujarat, India, with strong interest in the area of pharmaceutical analysis and bioanalysis for more than a decade. We have active collaboration with many pharmaceutical industries and contract research organizations in Ahmedabad. Currently, the main research domains include (i) development and validation of LC-MS/MS-, UPLC-, HPLC-, HPTLC-based methods for the estimation of drugs and their metabolites in biological matrices, (ii) optimization of sample extraction protocols for efficient extraction of drugs and their metabolites from complex biological fluids, (iii) assessment of matrix effects and drug stability in biological fluids, (iv) application of validated protocols for bioequivalence study in healthy volunteers with new formulations, (v) reinforcing confidence in developed bioanalytical methods through incurred sample reanalysis as per standard guidelines.
References
- Abdel-Hamid, M. E., Novotny, L., & Hamza, H. (2001). Determination of diclofenac sodium, flufenamic acid, indomethacin and ketoprofen by LC-APCI-MS. Journal of Pharmaceutical and Biomedical Analysis, 24, 587–594.
- Benesi, H. A., & Hildebrand, J. H. (1949). A spectrophotometric investigation of the interaction of iodine with aromatic hydrocarbons. Journal of the American Chemical Society, 71, 2703–2707.
- Biaggioni, I. (2014). New developments in the management of neurogenic orthostatic hypotension. Current Cardiology Reports, 16, 542–549.
- Chandra, B. S., Bhogela, S. S., Shaik, M., Vadlamudi, C. S., Chappa, M., & Maddirala, N. S. (2011). Simple and sensitive spectrophotometric methods for the analysis of mesalamine in bulk and tablet dosage forms. Química Nova, 34, 1068–1073.
- Choudhary, B., Goyel, A., & Khokra, S. L. (2009). New visible spectrophotometric method for estimation of itopride hydrochloride from tablets formulations using methyl orange reagent. International Journal of Pharmacy and Pharmaceutical Sciences, 1, 159–162.
- Darak, V., Karadi, A. B., Arshad, M., & Raju, S. A. (2011). Simple extractive spectrophotometric determination of mesalamine by acid-dye complexation methods in solid dosage form. Research Journal of Pharmacy and Technology, 4, 962–964.
- Deleu, D., & Hanssens, Y. (2000). Current and emerging second-generation triptans in acute migraine therapy: A comparative review. The Journal of Clinical Pharmacology, 40, 687–700.
- Dutta, N. K., Annadurai, S., Mazumdar, K., Dastidar, S. G., Kristiansen, J. E., Molnar, J., … Amaral, L. (2000). The anti-bacterial action of diclofenac shown by inhibition of DNA synthesis. International Journal of Antimicrobial Agents, 14, 249–251.
- El-Gindy, A., Sallam, S., & Abdel-Salam, R. A. (2008). Spectrophotometric method for determination of midodrine hydrochloride using ninhydrin in pharmaceutical formulations. Analytical Chemistry an Indian Journal, 7, 73–78.
- Elzanfaly, E. S., Zaazaa, H. E., & Merey, H. A. (2013). Ion selective phosphotungestate and β-cyclodextrin based membrane electrodes for stability-indicating determination of midodrine hydrochloride. Acta Chimica Slovencia, 60, 256–262.
- Ge, Z., Tessier, E., Neirinck, L., & Zhu, Z. (2004). High performance liquid chromatographic method for the determination of sumatriptan with fluorescence detection in human plasma. Journal of Chromatography B, 806, 299–303.
- Gouda, A. A., Kotb El-Sayed, M. I., Amin, A. S., & El Sheikh, R. (2013). Spectrophotometric and spectrofluorometric methods for the determination of non-steroidal anti-inflammatory drugs: A review. Arabian Journal of Chemistry, 6, 145–163.
- Gupta, K. R., Joshi, R. R., Chawla, R. B., & Wadodkar, S. G. (2010). UV spectrophotometric method for theestimation of itopride hydrochloride in pharmaceutical formulation. E-Journal of Chemistry, 7, S49–S54.
- Hamdon, E. A., Zakaria, S. A., & AL-Hamdany, N. M. (2012). Spectrophotometric determination of mesalazine with phloroglycinol in pharmaceutical preparation. Tikrit Journal of Pure Science, 17, 133–137.
- Hosseinzadeh, R., Maleki, R., & Matin, A. A. (2007). Interaction of diclofenac with bovine serum albumin investigated by diclofenac-selective electrode. Acta Chimica Slovenica, 54, 126–130.
- Huang, X., Lv, B., Zhang, S., Fan, Y. H., & Meng, L. N. (2012). Itopride therapy for functional dyspepsia: A meta-analysis. World Journal of Gastroenterology, 18, 7371–7377.
- ICH Harmonised Tripartite Guideline. (2005). Validation of analytical procedures: Text and methodology - Q2(R1). Retrieved from http://www.ich.org/fileadmin/Public_Web_Site/ICH_Products/Guidelines/Quality/Q2_R1/Step4/Q2_R1_Guideline.pdf
- Izcovich, A., Gonzalez Malla, C., Manzotti, M., Catalano, H. N., & Guyatt, G. (2014). Midodrine for orthostatic hypotension and recurrent reflex syncope: A systematic review. Neurology, 83, 1170–1177.
- Jejurkar, L., & Jejurkar, A. (2012). HPLC method of detection for 5ASA in pure and in tablets. Journal of Pharmaceutical Science and Technology, 4, 792–797.
- Jejurkar, L., Tapar, K. K., Game, M. D., Birari, T., & Ghenge, G. (2011). Development and validation of spectrophotometric method for mesalamine in pure and in tablets. Research Journal of Pharmacy and Technology, 4, 589–591.
- Job, P. (1928). Formation and stability of inorganic complexes in solution. Analytical Chemistry, 9, 113–203.
- Kalyana, R. B., & Raghubabu, K. (2010). Visible spectrophotometric determination of sumatriptan succinate in tablet dosage forms using folin reagent. International Journal of Pharmaceutical and Biomedical Science, 1, 49–52.
- Kalyana, R. B., & Raghubabu, K. (2011a). Estimation of sumatriptan succinate in bulk and formulations by visible spectrophotometry using aromatic aldehydes. International Journal of Applied Biology and Pharmaceutical Technology, 2, 86–91.
- Kalyana, R. B., & Raghubabu, K. (2011b). Ion association method for the determination of sumatriptan succinate from tablet dosage forms using tropaeolin OOO. International Journal of Pharmacy and Pharmaceutical Sciences, 3, 175–178.
- Kalyana, R. B., & Raghubabu, K. (2011c). Extractive visible spectrophotometric assay for sumatriptan succinate estimation based on ion-association complex formation. Research Journal of Pharmacy and Technology, 4, 1212–1215.
- Kalyana, R. B., Rupakumari, G., Ramarao, K., & Raghubabu, K. (2011). Development of new visible spectrophotometric methods for quantitative determination of sumatriptan succinate based on charge-transfer complex formation. International Journal of Pharmacy and Pharmaceutical Science Research, 2, 47–51.
- Khalil, S. (2013). Micro-determination of itopride hydrochloride in pharmaceutical formulations snd urine samples using ICP-atomic emission spectrometry. International Journal of Pharma and Bio Sciences, 4, 786–794.
- Khaskheli, A. R., Sirajuddin, S., Abro, K., Sherazil, S. T. H., Afridi, H. I., Mahesar, S. A., & Saeed, M. (2009). Simpler and faster spectrophotometric determination of diclofenac sodium in tablets, serum and urine samples. Pakistan Journal of Analytical & Environmental Chemistry, 10, 53–58.
- Khoury, C. K., & Couch, J. R. (2010). Sumatriptan-naproxen fixed combination for acute treatment of migraine: a critical appraisal. Drug Design, Development and Therapy, 4, 9–17.
- Lala, L. G., D’Mello, P. M., & Naik, S. R. (2002). HPTLC determination of diclofenac sodium from serum. Journal of Pharmaceutical and Biomedical Analysis, 29, 539–544.
- Matin, A. A., Farajzadeh, M. A., & Jouyban, A. (2005). A simple spectrophotometric method for determination of sodium diclofenac in pharmaceutical formulations. Il Farmaco, 60, 55–858.
- Mazurek, S., & Szostak, R. (2008). Quantitative determination of diclofenac sodium in solid dosage forms by FT-Raman spectroscopy. Journal of Pharmaceutical and Biomedical Analysis, 48, 814–821.
- Nanda, K., & Moss, A. C. (2012). Update on the management of ulcerative colitis: Treatment and maintenance approaches focused on MMX® mesalamine. Journal of Clinical Pharmacology: Advances and Applications, 4, 41–50.
- Prashanth, K. N., Basavaiah, K., & Raghu, M. S. (2013). Utilization of N-bromosuccinimide as a brominating agent for the determination of sumatriptan succinate in bulk drug and tablets. International Journal of Analytical Chemistry, Article ID: 934357, 1–11.
- Ptáček, P., Klíma, J., & Macek, J. (2009). Optimized method for the determination of itopride in human plasma by high-performance liquid chromatography with fluorimetric detection. Journal of Chromatography B, 877, 842–846.
- Reddy, M. P., Prabhavathi, K., Reddy, N. R., & Reddy, P. R. (2011). Two simple spectrophotometric methods for the estimation of mesalamine in bulk sample and its pharmaceutical dosage forms. Global Journal of Pharmacology, 5, 101–105.
- Rojas, F. S., & Ojeda, C. B. (2009). Recent development in derivative ultraviolet/visible absorption spectrophotometry: 2004–2008. Analytica Chimica Acta, 635, 22–44.
- Sama, N. S., Gurupadayya, B. M., & Kumar, C. A. (2011). Spectrophotometric determination of mesalamine by pdac and nqs reagents in bulk and tablet dosage form. Journal of Pharmacy Research, 4, 39–41.
- Sandborn, W. J., Feagan, B. G., & Lichtenstein, G. R. (2007). Medical management of mild to moderate Crohn’s disease: Evidence-based treatment algorithms for induction and maintenance of remission. Alimentary Pharmacology and Therapeutics, 26, 987–1003.
- Sattar, O. A., Rezk, M. R., Badawy, A. M., & Khattab, O. M. (2013). Selective determination of midodrine hydrochloride in the presence of its acidic degradation product. Analytical Chemistry an Indian Journal, 12, 182–187.
- Shah, C. R., Suhagia, B. N., Shah, N. J., & Shah, R. R. (2008). Development and validation of a HPTLC method for the estimation of sumatriptan in tablet dosage forms. Indian Journal of Pharmaceutical Sciences, 70, 831–834.
- Sharma, M. C. (2013). Validated densitometric method for the quantification of mesalamine in pharmaceutical dosage form. World Applied Sciences Journal, 28, 1098–1102.
- Shrivastava, A., & Gupta, V. B. (2011). Methods for the determination of limit of detection and limit of quantitation of the analytical methods. Chronicles of Young Scientists, 2, 21–25.
- Siddiqui, M. R., Alothman, Z. A., & Rahman, N. (2013). Analytical techniques in pharmaceutical analysis: A review. Arabian Journal of Chemistry, 2013, doi:10.1016/j.arabjc.04.016.
- Singh, R. K., Patel, P. S., & Gupta, P. (2010). UV spectrophotometric method for the estimation of mesalazine in bulk and its pharmaceutical dosage forms. International Journal of Pharmaceutical Sciences and Research, 1, 44–49.
- Suganthi, A., John, S., & Ravi, T. K. (2008). Simultaneous HPTLC determination of rabeprazole and itopride hydrochloride from their combined dosage form. Indian Journal of Pharmaceutical Sciences, 70, 366–368.
- Thiruvengada Rajan, V. S., Mohamed Saleem, T. S., Ramkanth, S., Alagusundaram, M., Ganaprakash, K., & Madhusudhana Chetty, C. (2010). A simple RP-HPLC method for quantitation of itopride HCl in tablet dosage form. Journal of Young Pharmacists, 2, 410–413.
- Walash, M. I., Ibrahim, F., Eid, M. I., & El Abass, S. A. (2013). Stability-indicating spectrofluorimetric method for determination of itopride hydrochloride in raw material and pharmaceutical formulations. Journal of Fluorescence, 23, 1293–1300.
- Yoon, S., Lee, H., Kim, T. E., Lee, S. H., Chee, D. H., Cho, J. Y., … Jang, I. J. (2014). Comparative steady-state pharmacokinetic study of an extended-release formulation of itopride and its immediate-release reference formulation in healthy volunteers. Drug Design Development and Therapy, 8, 123–128.
- Yoshida, H., Ohno, Y., Yoshikuni, K., Todoroki, K., Nohta, H., & Yamaguchi, M. (2003). Determination of midodrine in human plasma by high-performance liquid chromatography with fluorescence detection. Analytical Sciences, 19, 317–319.
- Zakaria, R. A. (2013). Spectrophotometric determination of mesalazine by 8-hydroxyquinoline and n-(1-naphthyl)ethylenediamine dihydrochloride reagents in bulk and capsule dosage forms. Rafidain Journal of Science, 24, 146–158.
- Zate, S. U., Kothawade, P. I., Gajbe, J. W., Pramod, A. S., & Boraste, S. S. (2010). Spectrophotometric method development and validation of itopride hydrochloride in bulk and dosage form. International Journal of Drug Delivery, 2, 340–343.