 ?Mathematical formulae have been encoded as MathML and are displayed in this HTML version using MathJax in order to improve their display. Uncheck the box to turn MathJax off. This feature requires Javascript. Click on a formula to zoom.
Abstract
The electrochemical oxidation of an antihistamine drug, methdilazine, was studied in 9.2 pH with 0.2 M phosphate buffer as supporting electrolyte at 25 ± 0.2°C. Glassy carbon electrode was used to perform the experiment at cyclic voltammetry, linear sweep voltammetry and differential pulse voltammetric techniques. The dependence of the current on pH, concentration and scan rate were investigated. Differential pulse voltammetric technique was adopted to know the linear relation between peak current and methdilazine concentration. The linear response was obtained in the range of 3.0 μM–1.0 mM with a detection limit of 0.1 μM. The proposed method was also applied for the quantitative determination of methdilazine in pharmaceuticals and biological samples.
Public Interest Statement
In this article, we described the simple and quick tool for the direct determination of methdilazine hydrochloride, an antihistamine drug, at glassy carbon electrode. The advantages of the study are as follows:
| • | A time-saving, simple, inexpensive and highly sensitive method for the detection of methdilazine was developed. | ||||
| • | The linear response was obtained in the range of 3.0 μM–1.0 mM with a detection limit of 0.1 μM with good selectivity and sensitivity. | ||||
| • | Various physicochemical parameters, such as process on the surface of the electrode, which was found to be adsorption controlled, heterogeneous rate constant, number of electrons transferred and charge transfer coefficient were estimated. A probable reaction mechanism was proposed. | ||||
| • | Effect of some excipients were studied; the results showed that there was no interference from the excipients during the analysis. | ||||
The present method was also applied for the quantitative determination of drug in biological samples.
1. Introduction
A synthetic analogue of phenothiazine derivative (10-[(1-Methyl-3 pyrrolidinyl) methyl] phenothiazine monohydrochloride) known as Methdilazine hydrochloride (MDH), (Scheme ) (Gordon, Citation1994) is used as an antihistamine and also found to possess anti-pruritic action.
Voltammetric methods gathered much attention of researchers owing to their rapidity of analysis, no requirement of sample pre-treatment, fairly high sensitivity and inexpensive instrumentation. In addition, application of electroanalytical techniques includes the determination of electrode mechanisms (Malode, Abbar, Shetti, & Nandibewoor, Citation2012). The performance of the voltammetric techniques is purely affected by the characteristic feature of the working electrode material, such as chemical and physical properties. An overview of the improvement in electroanalytical chemistry demonstrates that solid metal electrodes represent the most rapidly rising class of electrodes (Jorge, Pontinha, Marques, & Oliveira-Brett, Citation2010; Shetti, Sampangi, Hegde, & Nandibewoor, Citation2009; Wudarska, Chrzescijanska, Kusmierek, & Rynkowski, Citation2013). Among all those electrodes, the utilization of glassy carbon electrode (GCE) for the electrochemical measurements has increased in recent years as they provide good sensitivity, negligible porosity and superior mechanical rigidity (Bukkitgar, Shetti, Kulkarni, & Nandibewoor, Citation2015; CitationHegde, Shetti, et al., 2009; Nayak, Shetti, & Katrahalli, Citation2015). Oxidation and reduction property of drugs can give insight into its metabolic providence or their in vivo redox process or pharmaceutical activity (Diculescu, Kumbhat, & Oliveira-Brett, Citation2006; CitationHegde, Kumaraswamy, et al., 2009; Kumar, Tang, & Chen, Citation2008).
The literature survey revealed the availability of few methods for the assay of MDH in pharmaceutical formulations. Quantification of MDH has been achieved by high-performance liquid chromatography (HPLC) (Croes, McCarthy, & Flanagan, Citation1995; Sane et al., Citation1990; Smith & Evans, Citation1995), liquid chromatography (Mohammed & Cantwell, Citation1978), spectrofluorimetry (CitationSastry, Prasad Tipirneni, Suryanarayana, Rao, Satyanarayana, 1990), differential fluorimetry and differential UV-spectrophotometry (Gurka, Kolinski, Myrick, & Wells, Citation1980). Some visible spectrophotometric methods are also reported for the assay of pharmaceuticals (Basavaiah & Charan, Citation2002a, 2002b, 2003a, 2003b, 2003c; Emmanuel & Mathew, Citation1985; Gowda & Seetharamappa, Citation2003; Ramesh, Gowda, Melwanki, Seetharamappa, & Keshavayya, Citation2001; Sastry, Prasad Tipirneni, & Suryanarayana, Citation1989a, 1989b, 1989c; CitationSastry, Prasad Tipirneni, & Suryanarayana, 1990a, Citation1990b). However, these methods involve several manipulation steps which were not simple for routine analysis of pharmaceutical formulations and require sophisticated instruments.
A review of the literature exposes that, till date there is no report on the electrochemical oxidation of methdilazine hydrochloride at GCE. In sight of the pharmaceutical and biological importance of MDH and the lack of literature on its voltammetric determination, the electro oxidation of methdilazine hydrochloride necessitates a method to be developed. The plan of the present study is to establish the suitable experimental conditions to explore the oxidation mechanism of methdilazine hydrochloride, its determination in syrup, spiked human urine and blood samples using cyclic, linear sweep and differential pulse voltammetric techniques.
2. Materials and methods
2.1. Materials
Electrochemical analyzer (CHI Company, D630, USA) was used to study the electrochemical activities of the drug under investigation at an ambient temperature of 25 ± 0.2°C. A three-electrode system consisting of GCE as working electrode, platinum wire as counter electrode and Ag/AgCl (3 M KCl) as reference electrode were used in a 10 ml single compartment. Methdilazine hydrochloride (Sigma-Aldrich, USA) was used to prepare 1.0 mM stock solution in double-distilled water. The phosphate buffer solutions ranging 3.0–11.2 pH with ionic strength 0.2 M were prepared according to literature (Christian & Purdy, Citation1962) and pH of the solutions was measured by pH meter (Elico Ltd, LI120, India). Double-distilled water, analytical-grade chemicals and reagents without further purification were used throughout the experiments.
2.2. Pre-treatment of working electrode
Prior to use, the GCE was carefully polished using 0.3 micron Al2O3 slurry on a polishing cloth before each experiment. The GCE was first activated in phosphate buffer (pH 9.2) by cyclic voltammetric sweeps between −2.0 and 3.0 V until stable cyclic voltammograms were obtained. Then electrodes were transferred into another 10 ml of phosphate buffer (pH 9.2) containing proper amount of MDH.
Randles–Sevcik equation was used to calculate the active area of the electrode using cyclic voltammetric technique and K3Fe (CN)6 1.0 mM as a probe at different scan rates in 1.0 M KCl (Figure ) as supporting electrolyte (Shetti, Malode, & Nandibewoor, Citation2012). At T = 298 K and for a reversible process the equation is as follows:(1)
(1)
Figure 1. Cyclic voltammograms of 1.0 mM K3[Fe(CN)6] in 1.0 M KCl at different scan rates: (a) 0.003; (b) 0.005; (c) 0.007; (d) 0.01; (e) 0.03; (f) 0.05; (g) 0.09; (h) 0.1 V s−1. Inner figure represents the dependence of peak current Ip/μA on the square root of scan rate υ1/2/V s−1.
![Figure 1. Cyclic voltammograms of 1.0 mM K3[Fe(CN)6] in 1.0 M KCl at different scan rates: (a) 0.003; (b) 0.005; (c) 0.007; (d) 0.01; (e) 0.03; (f) 0.05; (g) 0.09; (h) 0.1 V s−1. Inner figure represents the dependence of peak current Ip/μA on the square root of scan rate υ1/2/V s−1.](/cms/asset/45c84f99-6318-4215-9d8f-2bf13ea89cb2/oach_a_1153274_f0001_oc.gif)
In Equation (1), Ip refers to the anodic peak current, n is the number of electrons transferred during the electrode reaction = 1. A0 is the surface area of the electrode, DR is the diffusion coefficient i.e. 7.6 × 10⁻⁶ cm2 s−1, υ is the scan rate and C0 is the concentration of K3Fe (CN)6. From the slope of the plot of Ip vs. υ1/2, the area of the electrode surface was calculated to be 0.04 cm2.
2.3. Procedures for pharmaceutical preparations
The content of dilosyn syrup (5 mL of dilosyn syrup equivalent to 4 mg of MDH) bottles (100 mL per bottle) equivalent to 80 mg MDH were quantitatively transferred into a separating funnel. A portion equivalent to a stock solution of a concentration of about 1.0 mM was accurately taken and transferred in to a 100 mL calibrated flask and completed to the volume with Millipore water. The contents of the flask were sonicated for 10 min to affect complete dissolution. Appropriate solutions were prepared by taking suitable aliquots of the clear supernatant liquid and diluting with buffer solution of pH 9.2. The differential-pulse voltammogram was subsequently recorded following the optimized conditions. The content of the drug in syrup was determined referring to the calibration graph or regression analysis.
To study the accuracy of the proposed method, and to check the interference from excipients used in the dosage forms, recovery experiments were carried out by the standard addition method.
2.4. Analysis of human serum and urine
Serum samples, obtained from healthy volunteers, were stored frozen until assay. To achieve final concentration of 1.0 mM, an aliquot quantity of sample was fortified with MDH. 0.4 mL of acetonitrile was treated and the volume was completed to 3.0 mL with the same serum sample. To clear the protein residues in the mixture, it was vortexed for 1 min, then centrifuged for 10 min at 4,000 rpm. Analysis was carried out in the pH 9.2 and quantification was performed by means of calibration plot method.
Human urine was obtained from four healthy volunteers of similar sex and age. Aliquots were centrifuged at 7,000 rpm for 5 min at room temperature (25 ± 0.2°C). These urine samples were analysed immediately or they were stored at low temperature until analysis.
3. Results and discussion
3.1. Electro-oxidation of methdilazine
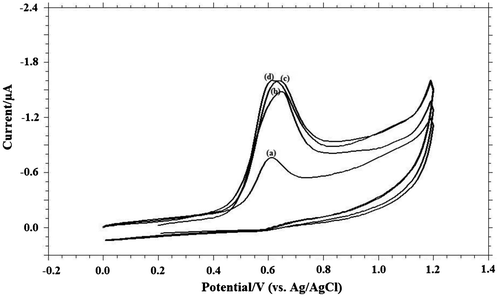
In order to understand the voltammetric behaviour of MDH, cyclic voltammetry method was utilised. Between the pH ranges 3.0 and 11.2, the electrochemical behaviour was studied and one well-defined irreversible oxidation peak at pH 9.2 was observed. In Figure , voltammetric behaviour of MDH in phosphate buffer solution (pH 9.2, I = 0.2 M) is represented. There was no peak observed on the reverse scan, therefore, electrode process is supposed to be irreversible. Since successive cyclic voltammogram showed decrease in the peak current due to adsorption of MDH or its oxidation product, the oxidation peak corresponding to first sweep was only recorded.
3.2. Effect of surfactant
Surfactants, even in trace quantities, can exert a strong effect on the electrode process. Adsorption of such substances at the electrode may inhibit the electrolytic process, bring out the irregularity in the voltammograms, and shift in the wave to more negative potentials (Herovsky & Rute, Citation1966). Surface-active substances have the common tendency of accumulation at interfaces. The lack of affinity between the hydrophobic portion of the surfactant and water leads to the repulsion of these substances from the water phase. Experimental results showed that the addition of cationic surfactant, cetyltrimethylammonium bromide, as anionic surfactant, sodium dodecyl sulphate and the non-ionic surfactant, Triton X-100 has no much influence on the peak current and peak potential (Figure ).
3.3. Effect of pH
Proton is always involved in the electrochemical reaction of organic molecules and exerts significant impact on the reaction rate. By optimizing the pH conditions, sharper response accompanied with higher sensitivity can be obtained. Therefore, phosphate buffer solution over the pH range 3.0–11.2 was utilized to study the pH effect on the oxidation of MDH (Figure ). No peak was observed till pH 5. From pH 6 to pH 11.2, a well-defined curve was observed. It was noticed that, as the pH of the supporting electrolyte increases, the peak potential shifted to less positive values. The linear relationship between Ep and pH can be expressed as follows:
Figure 4. (A) Cyclic voltammograms obtained for 1.0 mM MDH in buffer solution at (a) blank; (b) pH 6.0; (c) pH 8.0; (d) pH 9.2; (e) pH 10.4; (f) pH 11.2; (B) Variation of peak currents Ip / μA of MDH with pH; (C) Influence of pH on the peak potential Ep/V of MDH.
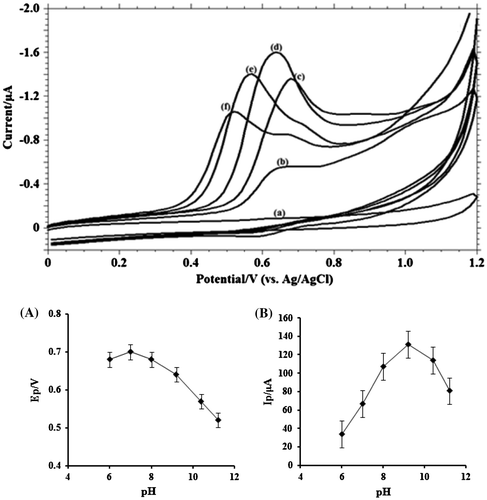
The slope of Ep vs. pH close to the theoretical value 0.059 suggested that the number of electrons transferred is equal to that of hydrogen ions taking part in the electrode reaction (Bukkitgar, Shetti, Kulkarni, & Doddamani, Citation2016). From the plot of Ip vs. pH, it is clear that the best result with respect to sensitivity and sharper response was obtained at pH 9.2, hence it was selected for further work. The peak current depends on the deprotonation and protonation form of the electro-active species in electrochemical cell. Further, the magnitude of current is directly proportional to the rate of electrochemical reaction. Hence, it is apparently concluded that the oxidation of MDH is very high at pH 9.2.
3.4. Effect of scan rate
The relationship between peak current and scan rate gives beneficial information about electrochemical mechanism. At different scan rates, the electrochemical behaviour of MDH was studied by using cyclic voltammetric technique (Figure ) and linear sweep voltammetric techniques (Figure ). The dependence of the peak intensity Ip (μA) upon the scan rate υ (V s−1) (Figure (A)) was carried out to assess whether the process on GCE was under diffusion or adsorption controlled.
Figure 5. Cyclic voltammograms of 1.0 mM MDH in buffer solution of pH 9.2 (I = 0.2 M) at scan rate of: (1) blank; (2) 0.001; (3) 0.005; (4) 0.01; (5) 0.02; (6) 0.03; (7) 0.05; (8) 0.06; (9) 0.08; (10) 0.1; (11) 0.13; (12) 0.17; (13) 0.20; (14) 0.30 V s−1. (A) Dependence of peak current (Ip/μA) on the scan rate (υ/V s−1); (B) Plot of logarithm of peak current (log Ip/μA) vs. logarithm of scan rate (log υ/V s−1); (C) Plot of variation of peak potential (Ep/V) with logarithm of scan rate (log υ/V s−1).
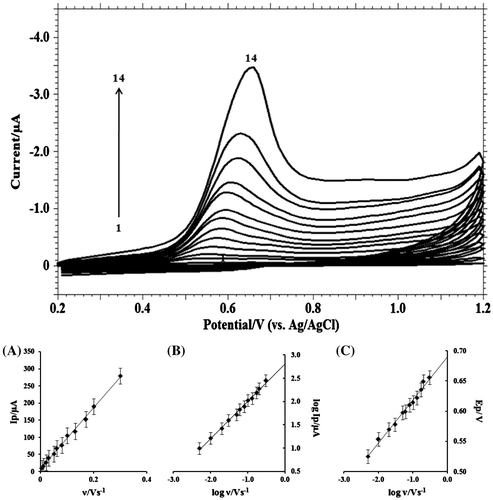
Figure 6. Linear sweep voltammograms of 1.0 mM MDH in 0.2 M phosphate buffer solution of pH 9.2 at scan rate of: (1) blank; (2) 0.001; (3) 0.002; (4) 0.004; (5) 0.008; (6) 0.01; (7) 0.02; (8) 0.04; (9) 0.06; (10) 0.08; (11) 0.15; (12) 0.20; (13) 0.30 V s−1.
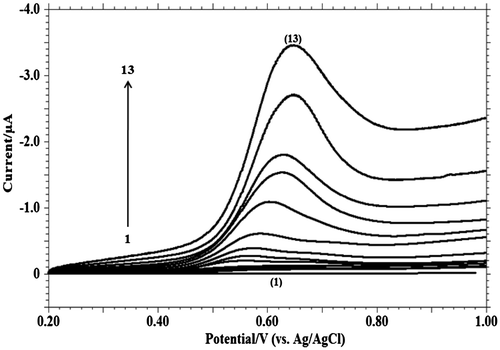
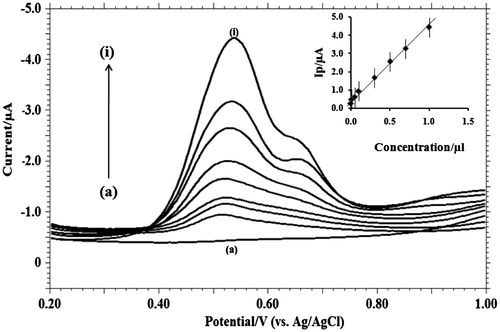
Figure 7. Differential-pulse voltammograms with increasing concentrations of MDH in pH 9.2 phosphate buffer solution on GCE (a) blank; (b) 1 × 10⁻³; (c) 3 × 10⁻³; (d) 5 × 10⁻³; (e) 7 × 10⁻³; (f) 1 × 10⁻⁴; (g) 1 × 10⁻⁵; (h) 5 × 10⁻⁵; (i) 3 × 10⁻⁶. Inner figure represents the plot of peak current (Ip/μA) vs. concentration (C).
From the plot of logarithm of anodic peak current vs. logarithm of scan rate, a straight line was obtained with a slope of 0.96 (Figure (B)) which is closer to the theoretical value of 1.0 for a purely adsorption controlled process (Brown, Large, Weissberger, & Rossiter, Citation1964; Gosser, Citation1993).
As the scan rate increased, the peak potential shifted to more positive values, which confirms the irreversibility of the oxidation process and a linear relationship between peak potential and logarithm of scan rate (Figure (C)) can be expressed by the following equation:
For an irreversible electrode process, according to Laviron (Citation1979), Ep is calculated by the following equation:(2)
(2)
where α refers to the transfer coefficient, k0 is the standard heterogeneous rate constant of the reaction, n is the number of electrons transferred, υ the scan rate and E0 is the formal redox potential. Other symbols have their usual meaning. From the slope of Ep vs. log υ value of αn can be calculated. Taking T = 298 K, R = 8.314 JK−1 mol−1 and F = 96480 C mol−1 the value of αn was calculated to be 0.883. According to Bard and Faulkner (Citation2004), α can be calculated as,(3)
(3)
where Ep/2 is the potential where the current is at half the peak value. From the above equation, value of α is 0.56. The number of electrons transferred in electrode oxidation was calculated to be 1.48 ≈ 1. Hence, MDH may be assumed to undergo one proton–electron transfer in the electrode reaction. From the intercept of Ep vs. υ curve by extrapolating to the vertical axis at υ = 0, the value of E0 can be calculated from Equation 2 (Yunhua, Xiaobo, & Shengshui, Citation2004). From the intercept of Ep vs. log υ which was found to be 0.690, E0 and k0 were calculated to be 0.540 and 4.19 × 10³ s−1, respectively.
3.5. Oxidation mechanism
There is no peak present on reverse scan, corresponding to MDH oxidation. In this irreversible system, the results suggests, a one electron–one proton transfer process in the oxidation mechanism of methdilazine. From the results obtained, the following mechanism can be proposed for the oxidation of methdilazine at the surface of electrode. The reaction mechanism is given in Scheme .
4. Analytical applications
4.1. Validation of the analytical procedure
To determine the MDH in trace level, differential pulse voltammetric technique was used. The phosphate buffer solution of 9.2 pH was selected as the supporting electrolyte for the quantitative determination of MDH. Differential pulse voltammograms obtained with increasing concentration of MDH (Figure ). The linear equation was expressed as follows:
Five successive determinations were recorded to develop the statistical data related to calibration curve (Table ). Limit of detection (LOD) and limit of quantification (LOQ) were calculated to be 0.1 and 0.37 μM, using following equation respectively (Riley & Rosanske, Citation1996; Swatz & Krull, Citation1997).
Table 1. Characteristics of methdilazine calibration plot using differential pulse voltammetry at GCE
where S is the standard deviation of the peak currents and m is the slope of calibration curve. The LOD and LOQ values calculated by the present method are better compared to the reported work (Table ).
Table 2. Analysis of MDH in dilosyn expectorant by DPV and its recovery studies
4.2. Determination of MDH in pharmaceutical dosages
The developed DPV method was applied successfully for the assay of MDH in syrup. The results of analysis of MDH are recorded in Table . In order to validate and to obtain the precision and accuracy of the developed method, recovery studies have been carried out at different concentration levels of the drug. These studies were carried out by standard addition method. For this, known quantities of pure MDH were mixed with definite amounts of pre-analysed formulations and the mixtures were analysed as before. The total amount of the drug was then determined and the amount of the added drug was calculated by difference. The average per cent recoveries obtained were found to be quantitative 99.57% indicating good recovery of the drug.
4.3. Detection of MDH in urine and blood samples
The developed differential pulse voltammetric method for the MDH determination was applied to urine samples. The recoveries from urine were measured by spiking drug-free urine with known amounts of MDH. The urine samples were diluted 100 times with the phosphate buffer solution before analysis without further pre-treatments. A quantitative analysis can be carried out, by adding the standard solution of MDH into the direct system of urine sample. The calibration graph was used for the determination of spiked MDH in urine samples. The detection results of four urine samples obtained are listed in Table . The recovery determined was in the range 99.6–100.3%.
Table 3. Determination of MDH in human urine and blood samples by DPV at GCE
The human blood serum sample was treated as described in Section 2.4. The analysis was carried out using differential pulse voltammetry. The recoveries in different samples were found to be 99.6% given in Table . In the proposed method, the extraction step can be excluded for spiked urine using DPV technique resulting in increased sensitivity and saved time together with elimination of consumption of expensive chemicals.
4.4. Effect of excipients
The tolerance limit was defined as the maximum concentration of the interfering of the substances that caused an error less than ±5% for the determination of MDH. Under the optimum experimental conditions, the effects of potential interfering substances on the voltammetric response of 1.0 mM MDH as a standard were evaluated. The experimental results show that thousand-fold excess concentration of starch, dextrose, citric acid, sucrose and gum acacia did not interfere with the voltammetric signal of MDH. The results shown in Table revealed that the proposed method is selective and accurate, and hence could be adopted for the quality assurance.
Table 4. Influence of potential interferents on the voltammetric response of 1.0 mM MDH at GCE by DPV
4.5. Repeatability and reproducibility of the GCE
In order to study repeatability of the electrode, a 1.0 mM MDH solution and the same electrode (renewed every time) were used for every several hours within a day and the R.S.D. of the peak current was 2.5% (number of measurements = 5). As to the reproducibility between days, it was similar to that of within-day repeatability if, the temperature was kept unchanged. Owing to the adsorption of MDH or its oxidative products on to the electrode surface, the current response of the prepared electrode would decrease after successive use. In this case, the electrode should be prepared again.
5. Conclusion
The developed voltammetric method provides a simple and quick tool for the direct determination of methdilazine hydrochloride using GCE. The investigation clearly reveals that the electrochemical oxidation of methdilazine hydrochloride was found to be an irreversible, adsorption controlled and one electron–one proton electrode process. From the results, a probable reaction mechanism was proposed. A differential pulse voltammetric technique was developed for the determination of methdilazine hydrochloride in syrups, human urine and blood samples quantitatively. Further, this method may be considered as an appropriate alternative to the existing chromatographic methods. The methods were not time consuming and were less expensive than the HPLC one.
Acknowledgements
Deepti S. Nayak thanks Department of Science and Technology, New Delhi, India for the award of Inspire Fellowship in Science and Technology.
Additional information
Funding
Notes on contributors
Nagaraj P. Shetti
Nagaraj P Shetti is an associate professor and the head in Department of Chemistry, K. L. E. Society’s K. L. E. Institute of Technology, Hubballi, India. He did his MSc degree from Karnatak University Dharwad, Karnataka, India, 2005, PhD from Karnatak University Dharwad, 2010 and postdoctoral research in material chemistry lab, Seoul, South Korea, 2012. His research interests are Kinetics, catalysis, electroanalytical chemistry, nano materials applications and biosensors. He has published more than 40 articles in reputed journals.
Deepti S. Nayak
Deepti S Nayak completed her MSc degree from Karnatak University Dharwad, Karnataka, India, 2012. Presently, she is a research scholar in Department of Chemistry, K. L. E. Institute of Technology, Gokul, Hubballi.
Shikandar D. Bukkitgar
Shikandar D Bukkitgar completed his MSc degree from Kuvempu University, Shankarghatta, Shimoga, Karnataka, India. Presently, he is a research scholar in Department of Chemistry, K. L. E. Institute of Technology, Gokul, Hubballi.
References
- Bard, A. J., & Faulkner, L. R. (2004). Electrochemical methods fundamentals and applications (2nd ed.). New York, NY: Wiley.
- Brown, E. R., Large, R. F., Weissberger, A., & Rossiter, B. W. (Eds.). (1964). Physical methods of chemistry (p. 423). Rochester, NY: Wiley Interscience.
- Basavaiah, K., & Charan, V. S. (2002a). The use of chloranilic acid for the spectrophotometric determination of three antihistamines. Turkish Journal of Chemistry, 26, 653–661.
- Basavaiah, K., & Charan, V. S. (2002b). Visible spectrophotometric determination of methdilazine in dosage forms using metavanadate and H2O2. Indian Drugs, 39, 449–451.
- Basavaiah, K., & Charan, V. S. (2003a). Spectrophotometric and turbidimetric determination of methdilazine using bromophenol blue. Indian Pharmacist, 2, 97–100.
- Basavaiah, K., & Charan, V. S. (2003b). Four new vanadometric methods for the assay of methdilazine in bulk drug and in pharmaceutical formulations. ScienceAsia, 29, 37–44.10.2306/scienceasia1513-1874.2003.29.037
- Basavaiah, K., & Charan, V. S. (2003c). Four simple procedures for the assay of methdilazine in bulk drug and in tablets and syrup using potassium iodate. Il Farmaco, 58, 285–292.10.1016/S0014-827X(02)00010-1
- Bukkitgar, S. D., Shetti, N. P., Kulkarni, R. M., & Doddamani, M. R. (2016). Electro-oxidation of nimesulide at 5% barium-doped zinc oxide nanoparticle modified glassy carbon electrode. Journal of Electroanalytical Chemistry, 762, 37–42.10.1016/j.jelechem.2015.12.023
- Bukkitgar, S. D., Shetti, N. P., Kulkarni, R. M., & Nandibewoor, S. T. (2015). Electro-sensing base for mefenamic acid on a 5% barium-doped zinc oxide nanoparticle modified electrode and its analytical application. RSC Adv, 5, 104891–104899.10.1039/C5RA22581G
- Christian, G. D., & Purdy, W. C. (1962). The residual current in orthophosphate medium. Journal of Electroanalytical Chemistry (1959), 3, 363–367.10.1016/0022-0728(62)80012-6
- Croes, K., McCarthy, P. T., & Flanagan, R. J. (1995). HPLC of basic drugs and quaternary ammonium compounds on microparticulate strong cation-exchange materials using methanolic or aqueous methanol eluents containing an ionic modifier. Journal of Chromatography A, 693, 289–306.10.1016/0021-9673(94)01116-V
- Diculescu, V. C., Kumbhat, S., & Oliveira-Brett, A. M. O. (2006). Electrochemical behaviour of isatin at a glassy carbon electrode. Analytica Chimica Acta, 575, 190–197.10.1016/j.aca.2006.05.091
- Emmanuel, J., & Mathew, R. (1985). Spectrophotometric determination of methdilazine hydrochloride in pharmaceutical formulations. Indian Drugs, 22, 602–605.
- Gordon, M. (Ed.). (1994). Psycho pharmacological agents (p. 2). New York, NY: Academic Press.
- Gurka, D. F., Kolinski, R. E., Myrick, J. W., & Wells, C. E. (1980). Scope of differential UV and differential fluorescence assays for phenothiazines: Comparison with official methods. Journal of Pharmaceutical Sciences, 69, 1069–1074.10.1002/jps.2600690922
- Gosser, D. K. (1993). Cyclic voltammetry: Simulation and analysis of reaction mechanisms (p. 43). New York, NY: VCH.
- Gowda, B. G., & Seetharamappa, J. (2003). Extractive spectrophotometric determination of fluoroquinolones and antiallergic drugs in pure and pharmaceutical formulations. Analytical Sciences, 19, 461–464.10.2116/analsci.19.461
- Hegde, R. N., Kumara Swamy, B. E., Shetti, N. P., & Nandibewoor, S. T. (2009). Electro-oxidation and determination of gabapentin at gold electrode. Journal of Electroanalytical Chemistry, 635, 51–57.10.1016/j.jelechem.2009.08.004
- Hegde, R. N., Shetti, N. P., & Nandibewoor, S. T. (2009). Electro-oxidation and determination of trazodone at multi-walled carbon nanotube-modified glassy carbon electrode. Talanta, 79, 361–368.10.1016/j.talanta.2009.03.064
- Herovsky, J., & Rute, J. (1966). Principles of polarography. New York, NY: Academic Press.
- Jorge, S. M., Pontinha, A. D., Marques, M. P., & Oliveira-Brett, A. M. (2010). Solid state electrochemical behavior of usnic acid at a glassy carbon electrode. Analytical Letters, 43, 1713–1722.10.1080/00032711003653890
- Kumar, S. A., Tang, C. F., & Chen, S. M. (2008). Poly(4-amino-1-1′-azobenzene-3, 4′-disulfonic acid) coated electrode for selective detection of dopamine from its interferences. Talanta, 74, 860–866.10.1016/j.talanta.2007.07.015
- Laviron, E. (1979). General expression of the linear potential sweep voltammogram in the case of diffusionless electrochemical systems. Journal of Electroanalytical Chemistry and Interfacial Electrochemistry, 101, 19–28.10.1016/S0022-0728(79)80075-3
- Malode, S. J., Abbar, J. C., Shetti, N. P., & Nandibewoor, S. T. (2012). Voltammetric oxidation and determination of loop diuretic furosemide at a multi-walled carbon nanotubes paste electrode. Electrochimica Acta, 60, 95–101.10.1016/j.electacta.2011.11.011
- Mohammed, H. Y., & Cantwell, F. F. (1978). Liquid chromatographic analysis of pharmaceutical syrups using pre-columns and salt-adsorption on Amberlite XAD-2. Analytical Chemistry, 50, 491–496.10.1021/ac50025a033
- Nayak, D. S., Shetti, N. P., & Katrahalli, U. (2015). Electrochemical behaviour of xanthene food dye erythrosine at glassy carbon electrode and its analytical applications. Asian Journal of Pharmaceutical and Clinical Research, 8, 125–129.
- Ramesh, K. C., Gowda, B. G., Melwanki, M. B., Seetharamappa, J., & Keshavayya, J. (2001). Extractive spectrophotometric determination of antiallergic drugs in pharmaceutical formulations using bromopyrogallol red and bromothymol blue. Analytical Sciences, 17, 1101–1103.10.2116/analsci.17.1101
- Riley, C. M., & Rosanske, T. W. (1996). Development and validation of analytical methods. New York, NY: Elsevier Science.
- Sane, R. T., Joshi, L. S., Kothurkar, R. M., Ladage, K. D., Tendolkar, R. V., & Gangal, D. P. (1990). HPLC determination of methdilazine HCl in pharmaceutical dosage forms. Indian Journal of Pharmaceutical Sciences, 52, 160–161.
- Sastry, C. S. P., Prasad Tipirneni, A. S. R., & Suryanarayana, M. V. (1989a). Spectrophotometric determination of some antihistamines with cobalt thiocyanate. Indian Journal of Pharmaceutical Sciences, 51, 146–148.
- Sastry, C. S. P., Prasad Tipirneni, A. S. R., & Suryanarayana, M. V. (1989b). Spectrophotometric determination of trimeprazine and methdilazine with sodium cobaltinitrite. Eastern Pharmacist, 32, 131–133.
- Sastry, C. S. P., Prasad Tipirneni, A. S. R., & Suryanarayana, M. V. (1989c). Sensitive spectrophotometric determination of some antihistamines with haematoxylin and chloramines-T. Indian Drugs, 36, 351–357.
- Sastry, C. S. P., Prasad Tipirneni, A. S. R., & Suryanarayana, M. V. (1990a). Spectrophotometric determination of some antiallergic agents with 3-methyl-2-benzothiazolinone hydrazone. Journal of Pharmaceutical and Biomedical Analysis, 8, 287–292.10.1016/0731-7085(90)80039-R
- Sastry, C. S. P., Prasad Tipirneni, A. S. R., & Suryanarayana, M. V. (1990b). Extraction-spectrophotometric determination of some antihistaminic agents with fast green FCF. Mikrochimica Acta, 100, 107–112.10.1007/BF01244506
- Sastry, C. S. P., Prasad Tipirneni, A. S. R., Suryanarayana, M. V., Thirupathi Rao, T., & Satyanarayana, T. (1990). Spectrofluorimetric determination of trimeprazine tartrate and methdilazine hydrochloride in formulations. Indian Journal of Pharmaceutical Sciences, 52, 115–117.
- Shetti, N. P., Sampangi, L. V., Hegde, R. N., & Nandibewoor, S. T. (2009). Electrochemical oxidation of loop diuretic furosemide at gold electrode and its analytical applications. International Journal of Electrochemical Science, 4, 104–121.
- Shetti, N. P., Malode, S. J., & Nandibewoor, S. T. (2012). Electrochemical behavior of an antiviral drug acyclovir at fullerene-C60-modified glassy carbon electrode. Bioelectrochemistry, 88, 76–83.10.1016/j.bioelechem.2012.06.004
- Smith, N. W., & Evans, M. B. (1995). The efficient analysis of neutral and highly polar pharmaceutical compounds using reversed-phase and ion-exchange electrochromatography. Chromatographia, 41, 197–203.10.1007/BF02688025
- Swatz, M. E., & Krull, I. S. (1997). Analytical method development and validation. New York, NY: Marcel Dekker.
- Wudarska, E., Chrzescijanska, E., Kusmierek, E., & Rynkowski, J. (2013). Voltammetric studies of acetylsalicylic acid electrooxidation at platinum electrode. Electrochimica Acta, 93, 189–194.10.1016/j.electacta.2013.01.107
- Yunhua, W., Xiaobo, J., & Shengshui, H. (2004). Studies on electrochemical oxidation of azithromycin and its interaction with bovine serum albumin. Bioelectrochemistry, 64, 91–97.


