 ?Mathematical formulae have been encoded as MathML and are displayed in this HTML version using MathJax in order to improve their display. Uncheck the box to turn MathJax off. This feature requires Javascript. Click on a formula to zoom.
Abstract
The electrochemical oxidation of carbenicillin disodium salt (CDS) at gold electrode has been investigated for the first time using cyclic, linear sweep, and differential pulse voltammetric techniques. The dependence of the current on pH, concentration, and scan rate were investigated to optimize the experimental conditions for the determination of carbenicillin. The anodic peak was characterized and process was adsorption-controlled. The number of electrons transferred in the oxidation was calculated. A differential pulse voltammetry method with good precision and accuracy was developed for the determination of carbenicillin. The anodic peak current varied linearly with carbenicillin concentration in the range 1.0 × 10⁻⁴ M to 5.0 × 10⁻⁶ M with a limit of detection (LOD) of 6.859 × 10⁻⁷ M and limit of quantification (LOQ) of 2.286 × 10⁻⁶ M. This method can be employed in clinical analysis, quality control, and routine determination of drugs in pharmaceutical analysis.
Public Interest Statement
The electrochemical oxidation of carbenicillin disodium salt at gold electrode has been investigated using cyclic, linear sweep, and differential pulse voltammetric techniques. The dependence of the current on pH, concentration, and scan rate were investigated to optimize the experimental conditions for the determination of carbenicillin. The anodic peak was characterized and process was adsorption controlled. The number of electrons transferred in the oxidation was calculated. A differential pulse voltammetry method with good precision and accuracy was developed for the determination of carbenicillin. This method can be employed in clinical analysis, quality control, and routine determination of drugs in pharmaceutical analysis.
1. Introduction
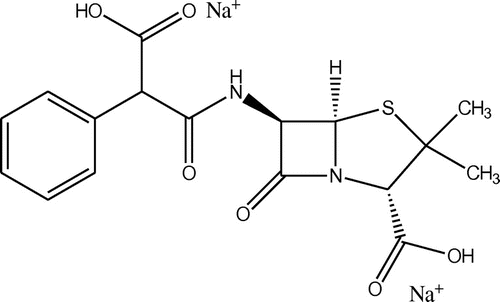
Drug analysis is one of the important tools for drug quality control. Carbenicillin disodium salt (CDS) is a bacteriolytic antibiotic belonging to the carboxypenicillin subgroup of the penicillins. Relative to benzylpenicillin, Carbenicillin has a relatively great spectrum of activity against Gram-negative bacteria such as Pseudomonas aeruginosa, but a lower activity against Gram-positive bacteria (Reynolds, Citation1996). Its bactericidal mode of action is analogous to that of benzylpenicillin, which acts on bacteria by inhibiting bacterial cell wall synthesis. The carboxypenicillins are susceptible to degradation by beta-lactamase enzymes, although they are more resistant than ampicillin to degradation. Carbenicillin is also more stable at lower pH than ampicillin. The antibiotic is highly soluble in water and is acid-labile. It is a semi-synthetic analog of the naturally occurring benzyl-penicillin (Scheme ).
Various analytical methods for the therapeutic monitoring have been reported in the literature for the determination of carbeniciilin in commercial dosage form and biological fluids such as high-performance liquid chromatography (HPLC) (Womey, Citation1981), LC method (Naidong, Dzerk, & Lee, Citation1994), electrochemical (Vedel et al., Citation1989), and electrophoretic method (Squella & Núñez-Vergara, Citation1986) The main problems encountered in using such methods are either the need for derivatization or the need for time-consuming extraction procedures.
Voltammetric methods satisfy many of the requirements for such tasks particularly owing to their inherent specificity, rapid response, high sensitivity, low cost, simplicity, and relatively short analysis time for the determination of organic molecules, including drugs and related molecules in pharmaceutical dosage forms and biological fluids (Zima, Švancara, Barek, & Vytřas, Citation2009).
Electrochemical methods, especially differential pulse voltammetry (DPV) make it possible to decrease the analysis time as compared to the time exhausted chromatographic methods (Erk, Citation2004). The advantages of DPV over other electroanalytical techniques are greater speed of analysis, lower consumption of electroactive species in relation to the other electroanalytical techniques and less problems with blocking of the electrode surface. The gold electrode has been widely used in electrochemical studies and electro analysis for various substrates for a long time because of its stability, wide potential window, and fast electron transfer rate (Chen et al., Citation2015; Ferapontova, Citation2004; Roy et al., Citation2015; Tak, Gupta, & Tomar, Citation2014; Xia & Hu, Citation2005).
To the best of our knowledge, till date, there is no literature on the voltammetric method for the determination of CDS. The aim of this study is to establish the suitable experimental conditions, to investigate the voltammetric behavior and oxidation of CDS at gold electrode by cyclic and linear sweep voltammetry. Further, differential pulse voltammetric (DPV) method with good precision and accuracy was developed for the determination of CDS in pharmaceutical formulations. The proposed method has advantages such has no time-consumed sample preparation step prior to drug assay, high sensitivity, rapid response, good reproducibility, and low detection limit. Hence, we here report the voltammetric behavior of CDS for the first time by cyclic, linear, and differential pulse voltammetric method at gold electrode.
2. Experimental
2.1. Reagents and chemicals
Carbenicillin disodium salt was purchased from Sigma–Aldrich and used without further purification. A stock solution of CDS (10 mM) was prepared in Millipore water. The phosphate buffers from pH 3.0–11.2 were prepared according to the method of Christian and Purdy (Citation1962). All other materials were of analytical reagent grade, and throughout the study, the solutions were prepared in Millipore water (resistivity of Millipore water is 20 MΩ).
2.2. Instrumentation
| • | Electrochemical measurements were carried out on a CHI 630D electrochemical analyzer (CH Instruments Inc., USA). | ||||
| • | The voltammetric measurements were carried out in a 10 ml single compartment three-electrode glass cell with Ag/AgCl as a reference electrode, a platinum wire as counter electrode and a 2 mm diameter gold electrode as a working electrode (Part No. CHI101). All the potentials are given against the Ag/AgCl (3 M KCl). | ||||
| • | pH measurements were performed with Elico LI120 pH meter (Elico Ltd, India). | ||||
2.3. Area of the electrode
The area of the electrode was obtained by the cyclic voltammetric method using 1.0 mM K3Fe(CN)6 as a probe at different scan rates. For a reversible process, the following Randles–Sevcik formula can be used (Rezaei & Damiri, Citation2008)(1)
(1)
where Ipa refers to the anodic peak current, n is the number of electrons transferred, A0 is the surface area of the electrode, D0 is diffusion coefficient, υ is the scan rate, and C0 is the concentration, respectively, of K3Fe(CN)6. For 1.0 mM K3Fe(CN)6 in 0.1 M KCl electrolyte, T = 298 K, R = 8.314 J K−1 mol−1, F = 96,480 C mol−1, n = 1, D0 = 7.6 × 10⁻⁶ cm2 s−1, then from the slope of the plot of Ipa vs. υ1/2, relation, the electroactive area was calculated. In our experiment, the slope was 2 × 10⁻⁵ μA (V s−1)1/2 and the area of electrode was calculated to be 0.2696 cm2.
2.4. Analytical procedure
For reproducible results, improved sensitivity, and good resolution of voltammetric peaks, the working electrode polishing was done on micro cloths (Buehler) glued to flat mirrors. A different micro cloth was used for each size of alumina. The particle size used was 0.3, 0.1, and 0.05 μm. The final particle size was 0.05 μm. After initial cleaning of the electrode, it was only necessary to polish with 0.05 μm particle size during the time of experiments. Before transferring the electrode to the solution, it was washed with double distilled water. Cyclic voltammograms were recorded in 0.2 M H2SO4 at 50 mV s−1 between 0 and 1.6 V, until obtaining the reproducible current-potential curves.
The parameters for differential-pulse voltammetry (DPV) were as follows: initial potential 0.8; final potential, 1.4 V; increase in potential, 0.004 V; amplitude, 0.05 V; quiet time, 2 s; sensitivity, 1.0 × 10⁻⁴ A/V.
3. Results and discussion
3.1. Cyclic voltammetry
In order to understand the electrochemical process occurring at the gold electrode, cyclic and linear sweep voltammetry were carried out at pH 3.0. The cyclic voltammograms obtained for 1.0 mM CDS solution at a scan rate of 50 mV s−1 exhibits a well-defined irreversible anodic peak. The results are shown in Suppl. Figure 1. The cathodic peak that appeared corresponds to the reduction of gold oxides (Barus, Gros, Comtat, Daunes-Marion, & Tarroux, Citation2007). It was found that the oxidation peak current of CDS showed a marked decrease during the successive cyclic voltammetric sweeps Suppl. Figure 2. A decrease in the oxidation peak current occurs with the number of successive sweeps. This phenomenon may be attributed to the fouling of the electrode surface due to adsorption of the oxidation product on the electrode surface. Therefore, the voltammograms corresponding to the first cycle were generally recorded.
3.2. Influence of pH
The electro-oxidation of 1.0 × 10⁻⁴ M CDS was studied over the pH range of 3.0–11.2 in phosphate buffer solution by cyclic voltammetry which is shown in Figure . With the increase in pH of the solution, peak potential shifted to less positive values, and obeys the following equation:
Figure 1. Influence of pH on the shape of anodic peak; pH: 3.0 (a), 4.2 (b), 5.0 (c), 6.0 (d), 7.0 (e), 8.0 (f). 10.4 (g), 11.2 (h).
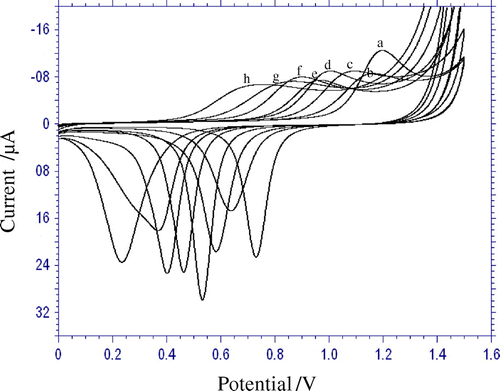
The slope is 54 mV/ pH, this value is close to the theoretical value of 59 mV/pH (Martins et al., Citation2011) suggested that the number of electrons transferred is equal to that of the hydrogen ions taking part in the electrode reaction. From the plot of Ipa vs. pH, it is clear that, peak current is affected by the pH value. Because, the best result with respect to sensitivity accompanied with sharper response was obtained with pH 3.0, so pH 3.0 was selected for further experiments.
3.3. Influence of scan rate
Useful information involving electrochemical mechanism generally can be acquired from the relationship between peak current and scan rate. Therefore, the voltammetric behavior of CDS at different scan rates was also studied using cyclic voltammetry (Figure (A)) and linear sweep voltammetry (Figure ). Scan rate studies were carried out to assess whether the processes on gold electrode were under diffusion or adsorption-controlled. The influence of the scan rate on the peak current showed a linear relationship in the range of 0.01 to 0.25 mV s−1 for CV (Figure (B)) and in the range of 0.01 to 0.25 mV s−1 for LSV which is of a typical adsorption controlled process (Gosser, Citation1993), and the equations were expressed as,
Figure 2. (A) Cyclic voltammograms for the oxidation of CDS at different scan rates (a) 0.01 (b) 0.025 (c) 0.05 (d) 0.075 (e) 0.1 (f) 0.15 (g) 0.20 (h) 0.25/Vs−1. (B) Dependence of oxidation peak current on the scan rate. (C) Linear relation between logarithm of peak current and logarithm of scan rate. (D) Dependence of oxidation peak potential on the logarithm of scan rate.
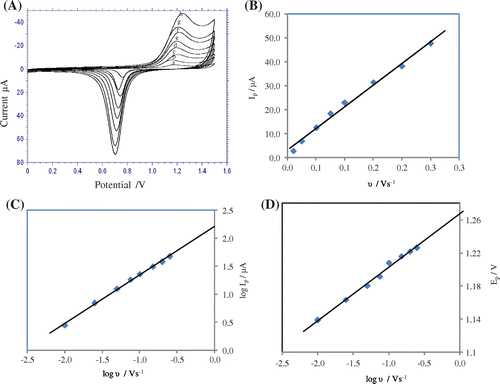
Figure 3. Linear sweep voltammograms of 1.0 mM CDS at gold electrode with different scan rates. Curves (a) 0.01 (b) 0.025 (c) 0.05 (d) 0.075 (e) 0.1 (f) 0.15 (g) 0.20 (h) 0.25/Vs−1, respectively. Other conditions are as in Figure .
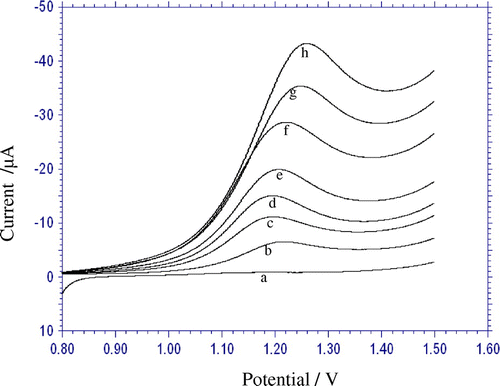
A plot of logarithm of anodic peak current vs. logarithm of scan rate gave a straight line with a slope of 0.864 for CV (Figure (C)) and 0.853 for LSV, which close to the theoretical value of 1.0, which is expected for an ideal reaction for the adsorption-controlled electrode process (Gosser, Citation1993). The equation obtained was:
The Ep of the oxidation peak was also dependent on scan rate. The peak potential shifted to more positive values on increasing the scan rate, which confirms the irreversibility of the oxidation process and a linear relationship between peak potential and logarithm of scan rate for CV (Figure (D)) and for LSV can be expressed by the following equations,
According to Laviron (Citation1979), Ep is defined by the following equation,(2)
(2)
where α (alpha) is the transfer coefficient, k0 the standard heterogeneous rate constant of the reaction, n the number of electrons transferred, υ (nu) the scan rate and E0′ is the formal redox potential. Other symbols have their usual meanings. Thus, the value of αn can be easily calculated from the slope of Ep vs. log υ. In this system, the slope is 0.064 for CV and 0.073 for LSV, taking T = 298 K, and substituting the values of R and F, αn was calculated. According to Bard and Faulkner (Citation2004), α can be given as, β(3)
(3)
where Ep/2 is the potential where the current is at half the peak value. So, from this, we obtained the value of α. Further, the number of electron (n) transferred in the electrooxidation of CDS was also calculated using cyclic and linear sweep voltammetry. The value of k0 can be determined from the intercept of the above plot if the value of E0′ is known. The value of E0′ in Equation (2) can be obtained from the intercept of Ep vs. υ curve by extrapolating to the vertical axis at υ = 0 (Yunhua, Xiaobo, & Shengshui, Citation2004). In our system, the intercept for Ep vs. log υ plot was 1.267 for CV and 1.284 for LSV methods. All the values of αn, α, n, E0′ and k0 obtained from cyclic and linear sweep voltammetry are tabulated in Suppl. Table 1.
3.4. Calibration curve and detection limit
In order to develop a voltammetric method for determining the CDS, the differential pulse voltammetic method was adopted, because the peaks are sharper and better defined at lower concentrations of CDS than those obtained by cyclic voltammetry. According to the obtained results, it was possible to apply this technique to the quantitative analysis of CDS. The phosphate buffer solution of pH 3.0 was selected as the supporting electrolyte for the quantification of CDS because it gave the maximum peak current at pH 3.0. Differential-pulse voltammograms obtained with increasing amounts of CDS showed that the peak current increased linearly with increasing concentration, as shown in Figure . Using the optimum conditions, a linear calibration curve was obtained for CDS in the range from 1.0 × 10⁻⁴ to 5.0 × 10⁻⁶ M (Inset: Figure ). The linear equation was, Ip (μA) = 0.037 C (μM) + 2.221; r = 0.998.
Figure 4. Differential pulse voltammograms for increasing concentration of CDS (mM): (a) 5.0 (b) 10.0 (c) 25.0 (d) 45.0 (e) 65.0 (f) 80.0 (g) 100.0 × μM other conditions are same as in Figure. . Inset: Plot of peak current against the concentration of CDS.
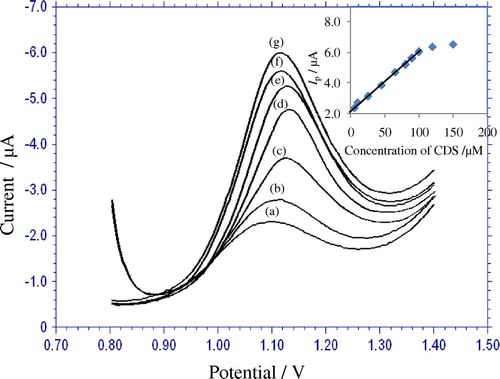
A deviation from linearity was observed for more concentrated solutions, due to the adsorption of CDS or its oxidation product on the electrode surface. Related statistical data of the calibration curves were obtained from the nine different determinations. The sensitivity of the analytical method is determined by limit of detection (LOD) and quantification (LOQ) values. LOD is defined as the lowest concentration of the analyte that can be detected but cannot be accurately quantified. LOQ is the lowest concentration that can be precisely and accurately quantified by the proposed analytical method. The LOD and LOQ were 6.859 × 10⁻⁷ M and 2.286 × 10⁻⁶ M, respectively. The LOD and LOQ were calculated using the following equations (Abbar & Nandibewoor, Citation2012; Bagoji, Gokavi, Pattar, & Nandibewoor, Citation2015)
where s is the standard deviation of the peak currents of the blank (four runs), and m is the slope of the calibration curve.
Precision of the method (Abbar & Nandibewoor, Citation2012) was investigated by intra-and inter-day determination of CDS at two different concentrations (n = 3) within the linear range. Accuracy of the methods expressed as bias% and RSD% for intra and inter days are as shown in Suppl. Table 2 which indicated high precision of the proposed method.
In order to ascertain the repeatability of the analysis, six measurements of 1 × 10⁻⁴ M CDS solution were carried out using gold electrode at intervals of 30 min. The RSD value of peak current was found to be 2.160%, which indicated that electrode has good repeatability. As to the reproducibility between days, it was similar to that of within a day repeatability if the temperature was kept almost unchanged.
3.5. Interference studies
For the analytical application of the proposed method, the effect of interferents used in pharmaceutical preparation was examined. The effects of these interferents on the voltammetric response was carried by analyzing sample solutions containing a fixed amount of CDS (1.0 × 10⁻⁴ M) spiked with various excess amount of each interferent under the same experimental conditions. The experimental results (Suppl. Table 3) showed that 10-fold excess of D-glucose, sucrose, ascorbic acid, citric acid, tartaric acid, dextrose, KCl, MnSO4, FeSO4, and CaCl2 did not interfere with the voltammetric signal of CDS.
4. Conclusion
The electrochemical oxidation of CDS at gold electrode in phosphate buffer solution (pH 3.0) has been investigated. The results indicated that CDS undergoes one electron and one proton transfer and the process was adsorption-controlled. The differential-pulse voltammetric procedure was used successfully to determine CDS. High percentage recovery and study of excipients showed that the method is free from the interferences of the commonly used excipients and additives in the formulations of drug. This method can be a good alternative for the analytical determination of CDS, because it is simple, sensitive, fast, accurate, and inexpensive. The proposed methods are suitable for quality control laboratories as well as pharmacokinetic studies where economy and time are essential.
Supplementary_material.docx
Download MS Word (70.1 KB)Acknowledgments
One of the author Manjunath D. Meti expresses gratitude to Department of Science & Technology (DST) New Delhi for providing Innovation in Science Pursuit for Inspired Research (INSPIRE) fellowship (IF11054).
Additional information
Funding
Notes on contributors
Manjunath D. Meti
Dr Manjunath D. Meti, obtained his BSc, MSc and PhD degrees from Karnatak University, Dharwad. Now he is a Post Doctoral Fellow in Department of Chemistry, Indian Institute of Technology Bombay, Mumbai, India. His research interests are Drug Protein Interaction, Kinetics, Catalysis and Electro analytical Chemistry.
Jyothi C. Abbar
Dr Jyothi C. Abbar, obtained her MSc and PhD degrees from Karnatak University, Dharwad. Her research interests are kinetics, catalysis, nano-material applications, electrochemical sensors and analytical chemistry.
Sharanappa T. Nandibewoor
Dr Sharanappa T. Nandibewoor Professor of Chemistry in Karnatak University, Dharwad, Karnataka, India. His research interests are kinetics, catalysis, electrochemical sensors, nano-material applications and analytical chemistry. He has published more than 350 papers in reputed journals with H-index 22.
Shivamurti A. Chimatadar
Dr Shivamurti A. Chimatadar Professor of Chemistry in Karnatak University, Dharwad. Karnataka, India. His research areas are Kinetics, Catalysis and Drug Protein Interaction. He has published more than 100 research articles in reputed journals.
References
- Abbar, J. C., & Nandibewoor, S. T. (2012). Development of electrochemical method for the determination of chlorzoxazone drug and its analytical applications to pharmaceutical dosage form and human biological fluids. Industrial & Engineering Chemistry Research, 51, 111–118.10.1021/ie2021812
- Bagoji, A. M., Gokavi, N. M., Pattar, V. P., & Nandibewoor, S. T. (2015). Fabrication characterization and application of NiSO4 modified carbon paste electrode for the detection of 2-thiouracil in biological fluids. Analytical & Bioanalytical Electrochemistry, 7, 684–700.
- Bard, A. J., & Faulkner, L. R. (2004). Electrochemical methods fundamentals and applications (p. 236). New York, NY: Wiley.
- Barus, C., Gros, P., Comtat, M., Daunes-Marion, S., & Tarroux, R. (2007). Electrochemical behaviour of N-acetyl-l-cysteine on gold electrode—A tentative reaction mechanism. Electrochimica Acta, 52, 7978–7985.10.1016/j.electacta.2007.06.065
- Chen, J., Jiang, Z., Ackerman, J. D., Yazdani, M., Hou, S., Nugen, S. R., & Rotello, V. M. (2015). Electrochemical nanoparticle-enzyme sensors for screening bacterial contamination in drinking water. The Analyst, 140, 4991–4996.10.1039/C5AN00637F
- Christian, G. D., & Purdy, W. C. (1962). Residual current in orthophosphate medium. Journal of Electroanalytical Chemistry, 3, 363–367.
- Erk, N. (2004). Voltammetric behaviour and determination of moxifloxacin in pharmaceutical products and human plasma. Analytical and Bioanalytical Chemistry, 378, 1351–1356.10.1007/s00216-003-2427-7
- Ferapontova, E. E. (2004). Electrochemistry of guanine and 8-oxoguanine at gold electrodes. Electrochimica Acta, 49, 1751–1759.10.1016/j.electacta.2003.12.006
- Gosser, D. K. (1993). Cyclic voltammetry: Simulation and analysis of reaction mechanisms (p. 43). New York, NY: VCH.
- Laviron, E. (1979). General expression of the linear potential sweep voltammogram in the case of diffusionless electrochemical systems. Journal of Electroanalytical Chemistry and Interfacial Electrochemistry, 101, 19–28.10.1016/S0022-0728(79)80075-3
- Martins, I., Carreira, F. C., Canaes, L. S., de Souza Campos Junior, F. A., da Silva Cruz, L. M., & Rath, S. (2011). Determination of parabens in shampoo using high performance liquid chromatography with amperometric detection on a boron doped diamond electrode. Talanta, 85, 1–7.10.1016/j.talanta.2011.04.047
- Naidong, W., Dzerk, A. M., & Lee, J. W. (1994). Development and validation of an LC method for the quantitation of carbenicillin in human serum. Journal of Pharmaceutical and Biomedical Analysis, 12, 845–850.10.1016/S0731-7085(94)80026-X
- Reynolds, J. E. F. (Ed.). (1996). Martindale: The extra pharmacopoeia (31st ed., pp. 181, 183–184). London: Royal Pharmaceutical Society.
- Rezaei, B., & Damiri, S. (2008). Voltammetric behavior of multi-walled carbon nanotubes modified electrode-hexacyanoferrate(II) electrocatalyst system as a sensor for determination of captopril. Sensors and Actuators B: Chemical, 134, 324–331.10.1016/j.snb.2008.05.004
- Roy, P. K., Ganguly, A., Yang, W. H., Wu, C. T., Hwang, J. S., Tai, Y., ... Chattopadhyay, S. (2015). Edge promoted ultrasensitive electrochemical detection of organic bio-molecules on epitaxial graphene nanowalls. Biosensors and Bioelectronics, 70, 137–144.
- Squella, J. A., & Núñez-Vergara, L. J. (1986). Electrochemical study of the interaction between glutathione and carbenicillin. Electrochimica Acta, 31, 767–769.10.1016/0013-4686(86)85005-8
- Tak, M., Gupta, V., & Tomar, M. (2014). Flower-like ZnO nanostructure based electrochemical DNA biosensor for bacterial meningitis detection. Biosensors and Bioelectronics, 59, 200–207.10.1016/j.bios.2014.03.036
- Vedel, G., Picard, B., Paul, G., Philippon, A., Gilly, L., Krishnamoorthy, R., & Névot, P. (1989). The analysis of five carbenicillin-hydrolysing enzymes by electrophoretic methods. Research in Microbiology, 140, 579–590.10.1016/0923-2508(89)90090-9
- Womey, P. A. (1981). High-performance liquid chromatographic analysis of carbenicillin and its degradation products. Journal of Pharmaceutical Sciences, 70, 824–826.
- Xia, H. Y., & Hu, X. Y. (2005). Determination of isoniazid using a gold electrode by differential pulse voltammetry. Analytical Letters, 38, 1405–1414.
- Yunhua, W., Xiaobo, J., & Shengshui, H. (2004). Studies on electrochemical oxidation of azithromycin and its interaction with bovine serum albumin. Bioelectrochemistry, 64, 91–97.
- Zima, J., Švancara, I., Barek, J., & Vytřas, K. (2009). Recent advances in electroanalysis of organic compounds at carbon paste electrodes. Critical Reviews in Analytical Chemistry, 39, 204–227.10.1080/10408340903011853

