 ?Mathematical formulae have been encoded as MathML and are displayed in this HTML version using MathJax in order to improve their display. Uncheck the box to turn MathJax off. This feature requires Javascript. Click on a formula to zoom.
Abstract
The typical polyol reduction method, where PVP was used as capping agent is aimed to synthesize pure and Cu-doped ZnO nanoparticles (NPs). The spherical morphology of as-synthesized NPs was observed under SEM. The NPs having Zn, O, and Cu as major constituents were observed by SEM coupled with EDX. The EDX confirmed the Zn, O, and Cu as major elements of as-synthesized NPs. The X-ray diffraction (XRD) studies demonstrated crystalline hexagonal structure in all the samples. The band gap of the NPs was determined using UV–vis spectroscopy. The catalytic activities of as-prepared material were investigated for the degradation of dyes like; Methyl Blue (MB), Methyl Red (MR), Thymol Blue (TB), and Alizarine Red.S (ARS), in the presence of H2O2. A drastic increase in catalytic activity was observed with the increased concentration of Cu; particularly for MB. All experiments were carried out under mild and environment friendly conditions i.e. without irradiating by sun or UV light. The material was found promising and feasible catalyst for non-photo degradation of dyes, which are present in the wastewaters produced from textile and printing industries.
Public Interest Statement
The nanocatalysis is promising field due to its general potential, energy saving, and rapid achievements. It has also importance due to having the ease of recovery and again having potential to be reused. Therefore, we have designed a strategy to synthesize pure and doped ZnO nanoparticles which were usually studied as photocatalyst. Now our strategy proved that these are non photocatalyst too. Furthermore, dyes used in textile and print industries are usually carcinogenic. These are mixed in wastewater and finally act as poisons for marine diaspora and terrestrial life. These are cause of widespread of cancer diseases. If our reported catalysts could be used by industrial management, these would act for degrading the dyes and save the water from such pollutants. It would help in saving marine and terrestrial life and give us save environment under mild conditions.
1. Introduction
In the previous years, the photo-catalytic degradation of organic dyes/pollutants using nano-catalysts has appealed wide consideration due to low cost, stereoselectivity, and greater turn-over capacity. The nanocatalysts are further advantageous due to ease of recovery and potential of reusability (Tian et al., Citation2012). Among the semi-conducting metal oxides, zinc oxide is an important material and one of the best candidates due to its promising characteristics like, broader bandgap (3.34 eV at room temperature), high electron portability, luminescent character, and large exciton binding energy (60 MeV) (Jang, Simer, & Ohm, Citation2006). Furthermore, it has low cost and greater transparency. It possesses more interstitial spaces and oxygen vacancies due to its wurtzite (hexagonal structure) and thus possessed the oxygen binding and trapping ability (Banu Bahşi & Oral, Citation2007). Similarly, the oxidative catalytic properties are also produced due to surface defects, which acted as active sites for the binding of polar substrate (Rekha, Nirmala, Nair, & Anukaliani, Citation2010; Ullah & Dutta, Citation2008). Therefore, it has been preferred due to simultaneously binding with atomic oxygen and substrate for effective and reliable catalytic behavior. Doping of ZnO NPs with different metals may further distort its crystal structure and hence improve the oxygen-retaining vacancies and substrate-binding ability. Such structural change may further improve the catalytic properties. Therefore, it was aimed to investigate the effect of doping (transition metal) on the catalytic properties of ZnO, which was produced by the chemical method.
In the current literature, most of the reports related to chemical synthesis of ZnO NPs are hydrothermal, “soak-deoxidize-air oxidation” (Xu et al., Citation2010), co-precipitation (Aziz, Zahoor, Aysha, Khan, & Aslam, Citation2016; Liu, Deng, Deng, & Li, Citation2008; Muthukumaran & Gopalakrishnan, Citation2012), sol–gel (Fernandes et al., Citation2009), evaporative decomposition of solution, and gas-phase synthesis with different reagents (Carolin, Manfred, Christian, & Markus, Citation2014). Few reports were found where poly(vinyl pyrrolidone) (PVP) was used as a capping agent to synthesize ZnO NPs in different methods (Lin & Shihe, Citation2000; Santi, Paveena, & Vinich, Citation2006). There was no report in the literature where typical polyol method i.e. glycol and PVP both were employed for the synthesis of pure and Cu-doped ZnO NPs. Therefore, in this study, typical polyol reduction method, i.e. combination of glycol and PVP as capping agent has been reported for the synthesis of pure and Cu-doped ZnO NPs. Moreover, the already reported ZnO nanostructures in pure and doped forms were found to be used for degradation of dyes like; methyl blue (MB) (Ullah & Dutta, Citation2008), methyl orange (MO) (Liao, Badour, & Liao, Citation2008), and Rhodamine (6G) by photocatalytic action (Jang, Simer, & Ohm, Citation2006; Kaur, Bansal, & Singhal, Citation2013; Kumar, Kumar, & Umar, Citation2013; Lutic, Coromelci-Pastravanu, Cretescu, Poulios, & Stan, Citation2012; Yu & Yu, Citation2008). Herein, the as-synthesized pure and Cu-doped ZnO nanostructures were evaluated for their catalytic activities without light which are environment friendly, under mild conditions at room temperature. The Cu-doped ZnO NPs were found more effective due to having more substrate and reagent binding ability. It was found quite novel to reduce a variety of carcinogenic dyes (Oh, Kang, Cho, & Lee, Citation1997), like; MB, MR, TB, and ARS. Thus, the study reports the typical polyol reduction for the synthesis of pure and Cu-doped ZnO NPs, which have distorted crystal and finally proved effective catalyst for degradation of industrial carcinogenic dyes. The material may find its applications for the degradation of textile and print industrial wastes which are too carcinogenic, and dangerous for aquatic life.
2. Experimental details
2.1. Materials
Zinc acetate dihydrate Zn(CH3COO)2.2H2O, Mw = 219.5 (Merck), Copper nitrate trihydrate Cu(NO3)2.3H2O, Mw = 241.6 (Merck), Ethylene glycol (EG) 99% (Daejung), Poly (vinylpyrrolidone) PVP (Daejung Reagent Chemicals-Korea), Acetone, Distilled water, Ethanol (Analytical Reagent). Methyl blue (MB), Alzarine red.S (ARS), Methyl red (MR), and Thymol blue (TB) were used as the model dyes for the determination of catalytic activities of as-synthesized NPs.
2.2. Preparation of pure and doped ZnO NPs
Synthesis of ZnO NPs was carried out using a typical polyol reduction method, where EG acted as a solvent and reducing agent, and PVP played the role of capping agent. In this one-pot synthesis, 10 mL of EG was first heated at 170°C for one hour with a constant stirring in a 100-mL three neck round bottom flask. About 15-mL solution of Zn(OAc)2 and PVP having concentration 0.1 M each was injected dropwise in the preheated EG with constant stirring. The temperature was maintained between 160 and 170°C for one hour to complete the reaction. Finally, the white suspension was obtained, which were cooled to room temperature. It was washed with acetone and ethanol, and centrifuged several times to remove EG, PVP, and unreacted reagents. The same method was repeated with adding 1.5-mL copper nitrate solution having concentrations 0.005, 0.007, and 0.01 M to dope the growing crystals of ZnO NPs.
2.3. Catalytic activities
The effect of pure and Cu-doped ZnO NPs as catalysts against dyes like MB, ARS, MR, and TB was determined comparatively taking H2O2 as standard and monitoring the experiment by UV–vis spectrophotometer. In standard experiment, 150 mL of 0.4 mM aqueous solution of each dye was simply treated with 1 mL H2O2 and degradation reaction was monitored by UV–vis spectrophotometer. To investigate the effect of catalyst, 2 mg pure and differently Cu-doped ZnO NPs were added in above solutions of each dye. The mixture was sonicated for 10 to 15 min to obtain the substrate–catalyst binding. Finally, 1-mL H2O2 was added and reaction was again similarly monitored. The reaction was avoided from direct sun light and UV radiation to find its non-photocatalytic activity. The simple degradation by H2O2 and degradation by H2O2 in the presence of each catalyst was observed after specific intervals. The complete reaction with all respects was performed for MB, while for other dyes the representative aspects were performed.
2.4. Characterization
UV–vis absorption spectra were measured on a SHIMADZU UV 1800 Spectrophotometer. The morphologies of the nanostructures were characterized by FESEM TESCAN MIRA3XMU Scanning Electron Microscope (SEM) coupled with EDX. The crystal structures of pure and Cu-doped ZnO NPs were analyzed by D8 ADVANCE XRD with Cu-Kα radiation (λ = 0.154178 nm). The catalytic activities of pure and Cu-doped ZnO NPs were determined against the degradation of different model dyes such as MB, ARS, MR, and TB solutions in the presence of 1 mL H2O2 and 2 mg catalyst at room temperature after specific intervals.
3. Results and discussion
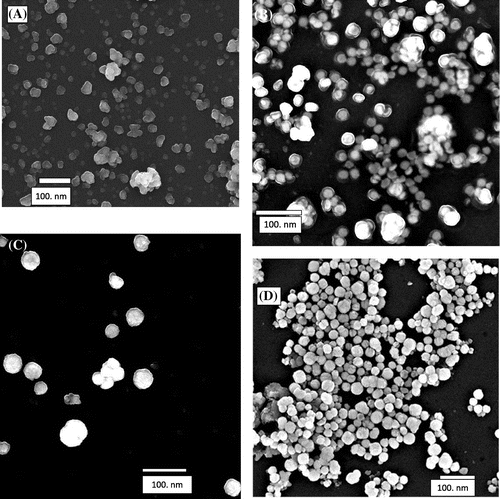
SEM was used to study the morphology of pure and Cu-doped ZnO NPs. Figure (A)–(D) presents the images of pure and Cu-doped ZnO NPs with copper nitrate concentration; 0.005, 0.007, and 0.01 M, respectively. According to the Figure (A), the morphology of pure ZnO NPs is spherical having diameter less than 20 nm. These NPs are observed as isolated and merged form forming the nano agglomerates. However, when it was doped with 0.005, 0.007, and 0.01 M Cu(NO3)2 solution, the particle size was not affected, but their merging ability significantly increased as demonstrated by Figure (B)–(D), respectively. The NPs gradually transformed into nano agglomerate and their reflection is quite dominant as expressed in Figure (B)–(D). The diameter of Cu-doped ZnO agglomerates increased from below 40 nm to above 60 nm. The formation of nano agglomerates is attributed to the crystal distortion of ZnO, which was produced by doping of Cu whose atomic size is larger than Zn. The formation of nano agglomerates from constrained crystal is thermodynamically favored (William, Citation1992). Resultantly, the distortion of ZnO crystal developed cavities and oxygen vacancies which are helpful to bind with substrate and reagent for reliable catalytic activities as it was demonstrated by this material, which will be discussed in relevant section.
The elemental analysis of pure and Cu-doped ZnO nano agglomerate was assessed by EDX and reflected in Tables and . Table reflected Zn, and O, and not Cu, while Table expressed Cu along with Zn and O. In both samples, the large amount of O is due to the background of SiO2 that is from glass slides. The other elements from background were omitted to make pronounced effect over desired elements for clarity. The omission of other elements like Si, Ca further contributed in reflection of higher weight % of oxygen. Table gives the evidence that Cu is present within the crystal of ZnO, possibly in a doped form. The possible doping of Cu was found in each concentration of Cu(NO3)2; however, EDX data are always qualitative, therefore, the only representative table of Cu-doped sample was appended.
Table 1a. EDX data of pure ZnO NPs
Table 1b. EDX data of Cu-doped ZnO NPs
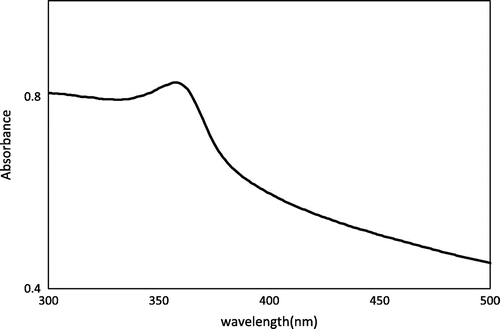
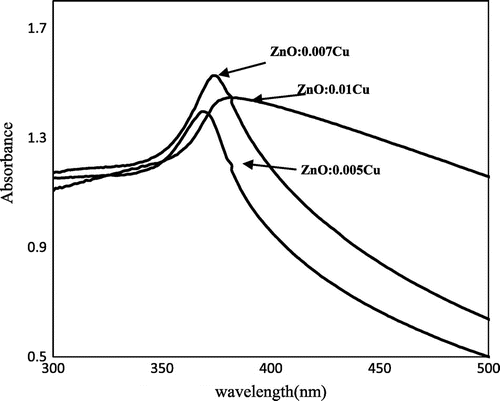
UV–visible spectroscopy was performed to determine the transitory energy levels of pure and Cu-doped ZnO NPs and expressed in Figures and , respectively. Figure focuses on the energy gaps of pure ZnO NPs, synthesized within one hour. The λmax of ZnO NPs was observed at 358 nm. Similarly, Cu-doped ZnO NPs demonstrated their optical gap at λmax 369, 374, and 381 nm for Cu+ concentrations 0.005, 0.007, and 0.01 M, respectively, as given in Figure . All these electronic transitions are corresponded to ZnO NPs with some shifting. Such electronic transition of ZnO NP in the presence of Cu supported the phenomenon of its doping, otherwise Cu or its cation may express its own absorption that occur at 350 nm (Anna, Claudia, Mirko, Fabio, & Bernardo, Citation2013). The non-existence of such absorption in Figure suggested the non-existence of independent or composite Cu or CuO NPs. Therefore, it was perceived that Cu is not present in a composite or independent form, but it is the part of ZnO crystal, which is due to its doping. On comparing the data of UV–vis spectroscopy with SEM, expressed in Figure , it became clear that red shift in optical gap is related with the size of nano agglomerates. The optical absorption became gradually red shifted as the size of nano agglomerates increased which resulted in decrease of electronic transitions gaps. The formation of nano agglomerate was prominently observed in Figure (B)–(D), respectively.
The optical gap for the different concentrations in pure and Cu-doped ZnO samples is shown in Table , which was calculated by the relation given as;(1)
(1)
Table 2. Band gap of pure ZnO and Cu-doped ZnO
where Eg stands for the energy of band gap or optical transition for bulk semi conducting or nano materials, 1,240 = hc, and λmax is taken from above plot. Eg of pure ZnO NP or nano agglomerate is 3.4 eV and it is closely in accordance with the already reported values (Chen & Xu, Citation2011; Kanade et al., Citation2007; Reddy et al., Citation2011; Sharma et al., Citation2003; Viswanatha, Chakraborty, Basu, & Sarma, Citation2006; Viswanatha et al., Citation2004). However, doping of Cu decreased the band gap and produced gradual red shift due to p–d spin exchange interactions that occurred between the localized d-electrons and the band electrons of transition metal ion replacing the cation, as reported by Diouri, Lascaray, and El Amrani (Citation1985), Elilarassi and Chandrasekaran (Citation2010), Li et al. (Citation2011) and Muthukumaran and Gopalakrishnan (Citation2012). The decrease in band is also due to the strong mixing of p–d of O and Cu, and it was further consolidated by second-order perturbation theory that confirms the complete substitution of Zn cation by Cu cation (Muthukumaran & Gopalakrishnan, Citation2012). Moreover, the formation of nano agglomerate is also responsible for the decrease in Eg values.
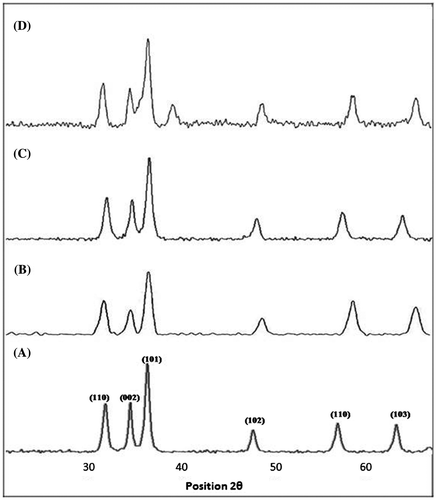
Finally, Figure (A)–(D) displayed the XRD pattern of pure and varyingly Cu-doped ZnO NPs in due course. Data are well indexed in card JCPDS No. 36-1451, which stands for wurtzite or hexagonal unit cell of ZnO crystal phase (Li et al., Citation2011). The different phases of crystal growth are expressed over relevant peak. Pure ZnO NPs demonstrated all its peaks quite intense with little anisotropy along 101 phase of orientation as shown in Figure (A). The sharpness, strong intensity, and narrow width in diffraction peaks indicated that as-synthesized ZnO is well-defined crystalline nanomaterial having high degree of purity. As the material was doped with Cu ions from 0.005, 0.007, and 0.01 M, the diffraction peaks were broadened as indicated in Figure (B)–(D), respectively. The anisotropy at 101 phase also decreased. It suggested the decrease in crystallite size of NPs due to incorporation of Cu cation, which has slightly greater size than Zn. It produced distortion in crystal which slows down the anisotropic growth at 101 phase and increased the merging potential of particles. It increased the extent of nano agglomeration with increasing the dopant concentration, which was already reflected by SEM in Figure (A)–(D). The enclosure of Cu further developed more space for O vacancy and made it stronger catalyst. Moreover, there is no separate peak for Cu at concentration 0.005 and 0.007 M as expressed in Figure (B) and (C), which indicated the successful doping of Cu at ZnO crystal lattice points. However, the XRD spectrum displayed in Figure (D) reflected the appearance of separate peak of Cu around 2θ = 38º, which dictates that 0.01 M for Cu ions was the critical concentration, which produced separate CuO nano coating over ZnO NPs. It further specified that less than 0.01 M for Cu ions is sufficient for lattice points’ substitutions and at least more than this concentration of copper would also produce composite structure. Thus, XRD confirmed that ZnO is well-defined crystalline material and it upon doping with Cu decreased the nanoparticle size which resulted in developing nano agglomerates.
4. Catalytic degradation of dyes
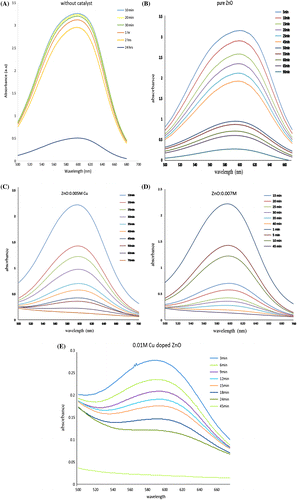
Degradation of different dyes like methyl blue, alizarine red.S, thymol blue, and methyl red, using the nano-catalysts in the presence of hydrogen peroxide at room temperature, was also studied. All of these model dyes are equally hazardous to the environment and health (Oh et al., Citation1997). The complete experiment for the degradation of MB was carried out with H2O2 as reference and H2O2 with pure ZnO and Cu-doped ZnO catalyst as experimental. The reactions were monitored by UV–vis spectrophotometer by observing the decrease in absorbance. The findings of MB degradation experiments are presented in Figure (A)–(E). In reference experiment, which was carried out with pure H2O2, there is negligible and unreproducible effect of pure H2O2. The MB could not be degraded even after 24 h as it is demonstrated in Figure (A). However, the similar experiment in the presence of pure ZnO nano catalyst started degradation after 5 min and within 90 min whole MB solution was decolorized as its gradual decrease in absorbance is displayed in Figure (B). Similarly, when Cu was doped with increasing concentration, like 0.005, 0.007, and 0.01 M, and the degradation of MB was further found to be increased, which is given in Figure (C)–(E). The Cu-doped ZnO nano agglomerates showed complete degradation for MB. It was achieved within 70 min for 0.005 M Cu-doped ZnO and within 45 min 0.007 and 0.01 M Cu-doped ZnO. The Cu-doped ZnO nano catalyst exhibited higher catalytic activities than those of the pure and proved efficient under mild condition as compared to its photocatalysis reported by Zahira Yaqoob, where only MB was focused (Manoj & Zahira, Citation2014, Citation2015).
Figure 4. (A–E) Degradation spectra of MB with pure H2O2, pure ZnO and differently Cu-doped ZnO nano catalyst.
The degree of degradation of dyes was evaluated using the following equation:(2)
(2)
where C0 = initial absorbance and Ct = absorbance at time “t”.
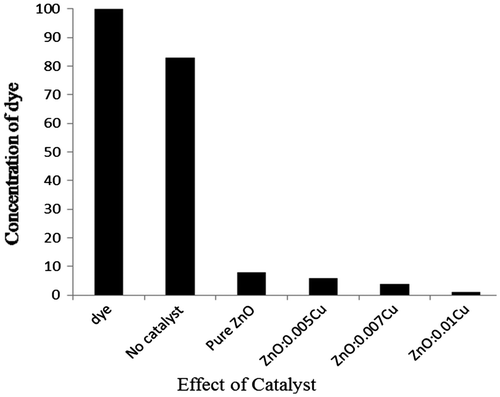
The bar graphs show the concentration of MB which was left after the degradation during reaction with pure and Cu-doped catalyst. The concentration of pure dye without reagent and catalyst was initially observed under UV–vis spectrophotometer and again after 24 h but noticed no change in absorbance. It was referenced as 100% pure without having any environmental effect. However, when it was treated with only H2O2, it degraded 17% and left over concentration was 83% after 24 h, and pure catalyst degraded 92% within 90 min. Similarly, increasing the doping level of catalyst, the catalytic activity significantly enhanced, as 0.05 M Cu-doped degraded MB to 94% within 70 min, 0.07 M Cu-doped did the same 96% within 45 min and finally 0.01 M Cu-doped ZnO degraded 99% MB within 45 min. Thus bar graph explained the effectiveness of doping, which appeared in improving its catalytic behavior (see Figure ).
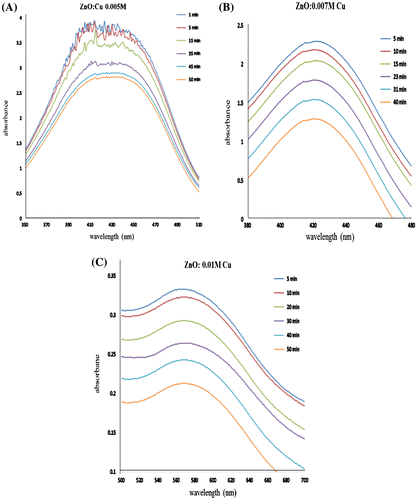
Furthermore, the representative degradation reactions against different dyes like ARS, MR, and TB with varyingly Cu-doped ZnO nano agglomerates were also analyzed and given in Figure (A)–(C), respectively. These results denote that Cu-doped catalyst is again capable for degrading other hazardous dyes like ARS, MR, and TB. The representative study is validating that the doped catalyst with every doping extent is fully able to degrade each dye.
Figure 6. Degradation spectra of (A) alizarine red.S by 0.005 M Cu-doped ZnO, (B) methyl red by 0.007 M Cu-doped ZnO, and (C) thymol blue by 0.01 M Cu-doped ZnO.
The procedure involved in the degradation is the adsorption–oxidation–desorption mechanism as reported by Zhang and Kerr (Citation2007) for MnO2. Firstly, MB molecule along with H2O2 was adsorbed on the nano-catalyst surface and then free radical species (HO•, HOO• or O2• −) were produced by the catalytic disintegration of H2O2. These generated free radicals are responsible for the destructive oxidation of the (organic) dye(s). Soon after the degraded parts of dye molecules desorb from the surface of nano-catalyst which proved helpful in its recovery (Zhang, Feng, & Zhang, Citation2008; Zhang et al., Citation2006).
5. Conclusion
The pure single phase of ZnO having a hexagonal wurzite crystal was successfully synthesized by typical polyol reduction method having particle size less than 20.00 nm. These were successfully in situ doped with Cu ions with different concentrations which produced nano agglomeration of different size. The band gap of as-synthesized NPs was found 3.4 eV which gradually decreased to 2.84 eV as Cu-doping concentration was increased. The catalytic activities of pure and Cu-doped ZnO nanoparticles were determined against different dyes like MB, ARS, MR, and TB. The potential of catalyst in degrading MB was found more appropriate as compared to other dyes as it degraded MB up to 99%. Therefore, these NPs can be effectively used as degrading agents for various carcinogenic dyes which were produced in print and textile industries.
Funding
The Higher Education Commission (HEC) Pakistan and Office of Research Innovation and Commercialization (ORIC), MUST are gratefully acknowledged for arranging funds for chemicals and characterizations.
Supplementary material
Supplementary material can be accessed here https://doi.org/10.1080/23312009.2017.1301241.
Additional information
Notes on contributors
Amen Shahpal
Zahoor Ahmad did PhD from Beijing University of Chemical Technology (BUCT), Beijing PR China. His major was material science and engineering focused on material chemistry. He carried out his research work in domain of composite materials. His main work was synthesis of Ag@polycarzole and Ag@polypyrrol nanocables, their characterization, and properties determinations. Polyol and microwave-assisted polyol synthesis was technique, employed for preparation of nanostructure. He published his first work in Journal of Material Science, Springer publisher in 2009. During post PhD, he optimized nano system for microarrays fabrication and nanocatalysis. He successfully reduced nitro group in amino groups for organic synthetic reactions. He also designed ZnO- and Cu-based semi conducting materials and determined water splitting character of photocatalyst. Currently, he is working on synthesis of nano metals, polymer modification, and organic synthesis.
References
- Anna, M. R. G., Claudia, A., Mirko, M., Fabio, P., & Bernardo, T. (2013). Novel microwave-synthesis of Cu nanoparticles in the absence of any stabilizing agent and their antibacterial and antistatic applications. Applied Surface Science, 280, 610–618.
- Aziz, M. C., Zahoor, A., Aysha, H., Khan, Y., & Aslam, M. (2016). Synthesis and characterization of ZnO/CuO nanocompsites on porous 3D Ni substrate and its photoelectric behavior. Synthesis and Reactivity in Inorganic, Metal-Organic, and Nano-Metal Chemistry, 46, 1618–1621.
- Banu Bahşi, Z., & Oral, A. (2007). Effects of Mn and Cu doping on the microstructures and optical properties of sol–gel derived ZnO thin films. Optical Materials, 29, 672–678.10.1016/j.optmat.2005.11.016
- Carolin, S., Manfred, Z., Christian, M., & Markus, W. (2014). Aluminum-doped ZnO nanoparticles: Gas-phase synthesis and dopant location. Journal of Nanoparticle Research, 16, 2506. 15 pp.
- Chen, Y., & Xu, X. (2011). Effect of oxygen deficiency on optical band gap shift in Er doped ZnO thin films. Physica B: Condensed Matter, 406, 3121–3124.10.1016/j.physb.2011.03.078
- Diouri, J., Lascaray, J., & El Amrani, M. (1985). Effect of the magnetic order on the optical-absorption edge in Cd1-x MnxTe. Physical Review B, 31, 7995.10.1103/PhysRevB.31.7995
- Elilarassi, R., & Chandrasekaran, G. (2010). Structural, optical and magnetic characterization of Cu-doped ZnO nanoparticles synthesized using solid state reaction method. Journal of Materials Science: Materials in Electronics, 21, 1168–1173.
- Fernandes, D., Silva, R., Winkler Hechenleitner, A., Radovanovic, E., Custydio Melo, M., & Pineda, E. (2009). Synthesis and characterization of ZnO, CuO and a mixed Zn and Cu oxide. Materials Chemistry and Physics, 115, 110–115.10.1016/j.matchemphys.2008.11.038
- Jang, Y. J., Simer, C., & Ohm, T. (2006). Comparison of zinc oxide nanoparticles and its nano-crystalline particles on the photocatalytic degradation of methylene blue. Materials Research Bulletin, 41, 67–77.10.1016/j.materresbull.2005.07.038
- Kanade, K., Kale, B., Baeg, J. O., Lee, S. M., Lee, C. W., Moon, S. J., & Chang, H. (2007). Self-assembled aligned Cu doped ZnO nanoparticles for photocatalytic hydrogen production under visible light irradiation. Materials Chemistry and Physics, 102, 98–104.10.1016/j.matchemphys.2006.11.012
- Kaur, J., Bansal, S., & Singhal, S. (2013). Photocatalytic degradation of methyl orange using ZnO nanopowders synthesized via thermal decomposition of oxalate precursor method. Physica B: Condensed Matter, 416, 33–38.10.1016/j.physb.2013.02.005
- Kumar, R., Kumar, G., & Umar, A. (2013). ZnO nano- mushrooms for photocatalytic degradation of methyl orange. Materials Letters, 97, 100–103.10.1016/j.matlet.2013.01.044
- Li, X., Li, H., Yuan, M., Wang, Z., Zhou, Z. Y., & Xu, R. (2011). Influence of oxygen partial pressure on electrical and optical properties of Zn0.93Mn0.07O thin films. Journal of Alloys and Compounds, 509, 3025–3031.10.1016/j.jallcom.2010.11.191
- Liao, D. L., Badour, C. A., & Liao, B. Q. (2008). Preparation of nanosized TiO2/ZnO composite catalyst and its photocatalytic activity for degradation of methyl orange. Journal of Photochemistry and Photobiology A: Chemistry, 194, 11–19.10.1016/j.jphotochem.2007.07.008
- Lin, G., & Shihe, Y. (2000). Synthesis and characterization of poly(vinylpyrrolidone)-modified zinc oxide nanoparticles. Chemistry of Materials, 12, 2268–2274.
- Liu, Z., Deng, J., Deng, J., & Li, F. (2008). Fabrication and photocatalysis of CuO/ZnO nano-composites via a new method. Materials Science and Engineering B, 150, 99–104.10.1016/j.mseb.2008.04.002
- Lutic, D., Coromelci-Pastravanu, C., Cretescu, I., Poulios, I., & Stan, C. D. (2012). Photocatalytic treatment of Rhodamine 6G in wastewater using photoactive ZnO. International Journal of Photoenergy, 2012, Article ID: 475131.
- Manoj, P., & Zahira, Y. (2014). Facile solid state synthesis of ZnO hexagonal nanogranules with excellent photocatalytic activity. Applied Surface Science, 292, 520–530.
- Manoj, P., & Zahira, Y. (2015). Facile synthesis of quasi spherical ZnO nanoparticles with excellent photocatalytic activity. Journal of Cluster Science, 26, 1187–1201.
- Muthukumaran, S., & Gopalakrishnan, R. (2012). Structural FTIR and photoluminescence studies of Cu doped ZnO nanopowders by co-precipitation method. Optical Materials, 34, 1946–1953.10.1016/j.optmat.2012.06.004
- Oh, S. W., Kang, M. N., Cho, C. W., & Lee, M. W. (1997). Detection of carcinogenic amines from dye stuffs or dyed substrates. Dyes Pigments, 33, 119–135.10.1016/S0143-7208(96)00038-1
- Reddy, A. J., Kokila, M., Nagabhushana, H., Chakradhar, R., Shivakumara, C., Rao, J., & Nagabhushana, B. (2011). Structural, optical and EPR studies on ZnO: Cu nanopowders prepared via low temperature solution combustion synthesis. Journal of Alloys and Compounds, 509, 5349–5355.10.1016/j.jallcom.2011.02.043
- Rekha, K., Nirmala, M., Nair, M., & Anukaliani, A. (2010). Structural, optical, photocatalytic and antibacterial activity of zinc oxide and manganese doped zinc oxide nanoparticles. Physica B: Condensed Matter, 405, 3180–3185.10.1016/j.physb.2010.04.042
- Santi, M., Paveena, L., & Vinich, P. (2006). Synthesis and optical properties of nanocrystalline ZnO powders by a simple method using zinc acetate dihydrate and poly(vinyl pyrrolidone). Journal of Crystal Growth, 289, 102–106.
- Sharma, P., Gupta, A., Rao, K., Owens, F. J., Sharma, R., Ahuja, R., … Gehring, G. (2003). Ferromagnetism above room temperature in bulk and transparent thin films of Mn-doped ZnO. Nature Materials, 2, 673–677.10.1038/nmat984
- Tian, C. G., Zhang, Q., Wu, A. P., Jiang, M. J., Liang, Z. L., Jiang, B. J., & Fu, H. J. (2012). Cost-effective large-scale synthesis of ZnO photocatalyst with excellent performance for dye photodegradation. Chemical Communications, 48, 2858–2860.10.1039/c2cc16434e
- Ullah, R., & Dutta, J. (2008). Photocatalytic degradation of organic dyes with manganese-doped ZnO nanoparticles. Journal of Hazardous Materials, 156, 194–200.10.1016/j.jhazmat.2007.12.033
- Viswanatha, R., Chakraborty, S., Basu, S., & Sarma, D. (2006). Blue-emitting copper-doped zinc oxide nanocrystals. The Journal of Physical Chemistry B, 110, 22310–22312.10.1021/jp065384f
- Viswanatha, R., Sapra, S., Satpati, B., Satyam, P., Dev, B., & Sarma, D. (2004). Understanding the quantum size effects in ZnO nanocrystals. Journal of Materials Chemistry, 14, 661–668.10.1039/b310404d
- William, C. S. (1992). Thermodynamics, statistical thermodynamics, and computer simulation of crystals with vacancies and interstitials. Physical Review A, 46, 4539–4548.
- Xu, C., Cao, L., Su, G., Liu, W., Liu, H., Yu, Y., & Qu, X. (2010). Preparation of ZnO/Cu2O compound photocatalyst and application in treating organic dyes. Journal of Hazardous Materials, 176, 807–813.10.1016/j.jhazmat.2009.11.106
- Yu, J., & Yu, X. (2008). Hydrothermal synthesis and photocatalytic activity of zinc oxide hollow spheres. Environmental Science & Technology, 42, 4902–4907.10.1021/es800036n
- Zhang, H., Feng, J., & Zhang, M. (2008). Preparation of flower-like CuO by a simple chemical precipitation method and their application as electrode materials for capacitor. Materials Research Bulletin, 43, 3221–3226.10.1016/j.materresbull.2008.03.003
- Zhang, R., & Kerr, L. L. (2007). A simple method for systematically controlling ZnO crystal size and growth orientation. Journal of Solid State Chemistry, 180, 988–994.
- Zhang, W., Yang, Z., Wang, X., Zhang, Y., Wen, X., & Yang, S. (2006). Large-scale synthesis of β-MnO2 nanorods and their rapid and efficient catalytic oxidation of methylene blue dye. Catalysis Communications, 7, 408–412.10.1016/j.catcom.2005.12.008

