
 ?Mathematical formulae have been encoded as MathML and are displayed in this HTML version using MathJax in order to improve their display. Uncheck the box to turn MathJax off. This feature requires Javascript. Click on a formula to zoom.
Abstract
Sulfadoxine and pyrimethamine are often formulated together and used in the treatment of malaria especially in pregnant women serving as a prophylaxis. A new simple, precise and accurate reverse-phase high-performance liquid chromatography (RP-HPLC) method has been developed for simultaneous identification and quantification of sulfadoxine and pyrimethamine in tablet dosage form. The analysis was carried out on Waters uBondapak C18 Column (39 × 300 mm, 3.6 µm) with acetonitrile: phosphate buffer (75:25 v/v) as the mobile phase at pH of 2.5, and a flow rate of 1.0 mL/min and a detection wavelength of 230 nm. Sulfadoxine and pyrimethamine eluted at mean times of 2.86 and 3.60 min, respectively. The method was linear with r2 values of 0.9976 and 0.9841 for sulfadoxine and pyrimethamine, respectively (range 31.25–500 µg/mL). The method was accurate (97.06 ± 2.23% and 99.81 ± 1.93% for sulfadoxine and pyrimethamine, respectively), precise, specific, robust, sensitive and cost effective. The developed and validated method was used to assay two brands of tablets containing sulfadoxine and pyrimethamine. The use of internal standard, diclofenac, permitted accurate quantification of the two active pharmaceutical ingredients (APIs) and also aided in decreasing inherent errors while compensating for small variations in peak areas due to sample size fluctuations and variable detector sensitivity. The validated method can be used in routine quality control analysis of fixed-dose combination tablets containing both sulfadoxine and pyrimethamine.
Public Interest Statement
Sulfadoxine–pyrimethamine (SP) tablets are the common medicines usually given to pregnant women to prevent or treat malaria. Many manufacturers around the world produce this drug for local usage or export to various countries. Do these drugs meet the required standards or specification set by the pharmacopoeias? It is important for manufacturers to assess the quality of their products as well as regulatory authorities to determine the quality of such products. This demands that methodologies exist that are simple and yet accurate for the determination of the quality of the drugs, especially with respect to the quantity of the active ingredients present in the drug. The method reported in this article is simple, linear, specific, robust, and accurate and it is able to determine the quantities of the two active ingredients in the drug simultaneously. The ease of use, rapidity and accuracy of the method will help manufacturers and regulatory authorities assess the quality of SP drugs with ease.
1. Background
Malaria is the world’s most common parasitic infection in the tropics and it is ranked among the major health issues affecting most developing countries (Rao, Krishna, Kumar, & Venkateswarlu, Citation2011). Because of its severe effect on humans (Lewison & Srivastava, Citation2008), several antimalarial drugs have been produced in an attempt to help control this deadly disease. Among these are chloroquine, quinine, camoquine and combinational drugs like artemether-lumefantrine, sulfadoxine-pyrimethamine and artesunate-amodiaquine. However, one major challenge facing malaria control is the ability of the parasites to develop resistance to the antimalarial drugs produced (Rao et al., Citation2011). Hence, a fixed-dose combination of sulfadoxine-pyrimethamine (SP) has been used to replace the resisted antimalarial drugs (Raveendra, Vemula, & Sharma, Citation2013) since it is efficacious and has fewer side effects (Garner & Brabin, Citation1994). Some of the antimalarial drugs on the market are sub-standard and has serious implications on human health (Mbinze et al., Citation2015).
In regions, where the trade in pharmaceuticals is not rigorously regulated, counterfeit antimalarial drugs pose a serious threat. A survey that was conducted in Cameroun found insufficient or inactive ingredients in 38% of preparations labeled chloroquine, 78% of those labeled quinine, and 12% of tablets labeled as an antifolate agent (Basco, Citation2004). A survey that was conducted in Southeast Asia involving 104 purchases of artesunate tablets also found that 38% of the tablets contained no drug (Newton et al., Citation2001). The trade in counterfeit drugs is lucrative and carries little risk of imprisonment but it undoubtedly results in many deaths (Newton, Citation2002). There is, therefore, the need for routine analysis of the drugs on the market (Santos, Takeuchi, & Stradiotto, Citation2009). In this light, several attempts have been made to develop validated methods for the simultaneous identification and estimation of sulfadoxine and pyrimethamine in tablet dosage form using the International Conference on Harmonization guidelines (International Conference on Harmonization, ICH Harmonized Tripartite Guideline, Citation1995; Raveendra et al., Citation2013). This has resulted in several published works by various authors (Arayne, Sultana, Siddiqui, Naseem, & Qureshi, Citation2010; Kumar, Sindgi, Satla, & Thimmaraju, Citation2016; Kumari & Kasthuri, Citation2014; Raveendra et al., Citation2013). These methods employed RP-HPLC but used external standards in the quantification of the APIs. In developing countries where drug counterfeiting and adulteration is a major concern, there is the need to develop methods which are rapid, accurate, cheap, easy to use, and require simple equipment for simultaneous identification and quantification of the active component(s) in tablet dosage formulation. The main aim of this work, therefore, was to develop and validate a new, simple, accurate, precise, linear, specific, robust, and sensitive RP-HPLC method for the simultaneous identification and quantification of sulfadoxine and pyrimethamine in tablet dosage form. This method proposes the use of internal standard for rapidity of analysis as well as minimization of errors due to sample treatment and handling.
2. Materials and methods
2.1. Chemicals and reagents
Reference standards of sulfadoxine (Chegshu Jinshen Med, China) and pyrimethamine (Xinda Pharma & Chem. Co. Ltd., China) were given by Trade Winds Pharmaceutical Company Ltd. in Ghana. Palidar tablets (Phyto-Riker Pharmaceuticals Ltd., Ghana) and Maladar tablets (Ernest Chemist Ltd., Ghana) both containing sulfadoxine-500 mg and pyrimethamine-25 mg were purchased from a local pharmacy. Acetonitrile (HPLC grade) from Carlo Erba (Rodano, Italy), Potassium dihydrogen orthophosphate and phosphoric acid were obtained from Sigma-Aldrich (St Louis, MO, USA).
2.2. Instrumentation
HPLC (Chromera version 4.1.0.6386) from Perkin Elmer made up of a flexer liquid chromatograph (LC) quartenary pump, autosampler and photodiode array detector, and HP Chemstation Software was used for the method development. The stationary phase used was Waters uBondapak C18 Column (3.6 µm, 39 × 300 mm).
2.3. Preparation of mobile phase
The mobile phase was a mixture of acetonitrile and Phosphate buffer in the ratio 75: 25 (v/v) at pH 2.5. The mobile phase was prepared by mixing 750 mL of acetonitrile with 250 mL of phosphate buffer to make 1000 mL of the mobile phase.
2.4. Preparation of standard stock solutions
Standard stock solution (2000 µg/mL) each of sulfadoxine and pyrimethamine was prepared by weighing 200 mg of the reference standard into a 100 mL volumetric flask. 20 mL of acetonitrile was added to each of them, shaken and sonicated for 15 min and was then made up to the mark using the mobile phase. The stock solutions were serially diluted to obtain concentrations ranging from 31.25 to 500 µg/ml.
The internal standard solution was prepared by weighing 200 mg of Diclofenac reference standard into a 100 mL volumetric flask, 20 mL of acetonitrile was then added and the solution was sonicated for 15 min. The solution was then topped up to the mark using the mobile phase. Serial dilution was performed to obtain concentration of 31.25–500 µg/mL.
2.5. Preparation of sample solutions
Specific amount of each powdered tablet sample (0.252 g) was accurately weighed into 100 mL volumetric flask. 20 mL of acetonitrile was added to each and sonicated for 15 min. The solution was then topped up to the 100 mL mark using the mobile phase. 12.5 mL of the resulting solution was pipetted into a 100 mL volumetric flask and 12.5 mL of the standard stock solution of diclofenac was also added. The solution was then made up to the mark using the mobile phase.
2.6. LC procedure
10 μL aliquot of each final working solution of the analytes in their linear dynamic concentration ranges were injected into the liquid chromatograph. A flow rate of 1 mL/min and working column temperature of 25°C were maintained. A reversed-phase column C18 (39 × 300 mm, 3.6 μm) was used to separate the compounds while employing a mobile phase of acetonitrile and phosphate buffer (75:25, v/v) pH 2.5. Elution was isocratic. Wavelength of detection was maintained at 230 nm. Injections were done in triplicates for each solution. Absorbance peak areas were then measured in all cases and the mean peak areas (MPA) were computed.
2.7. Method validation
The method was validated based on the International Conference on Harmonization (ICH) guidelines (International Conference on Harmonization, ICH Harmonized Tripartite Guideline, Citation1995). Validation parameters employed included accuracy, linearity, precision, specificity, robustness, limit of detection (LOD) and limit of quantification (LOQ).
2.7.1. Linearity
The linearity of the developed method was obtained by plotting the peak areas against the concentration of the standard solution for each component. The correlation coefficient (r2) value obtained for each curve portrayed the linearity that exists between the peak areas and the concentration of the solutions. Triplicate measurements were performed for each concentration and the MPA computed. The linearity of the developed method was also analyzed statistically.
2.7.2. Accuracy
The accuracy of the developed method was established by computing for the percentage recovery. Five (5) different concentrations of the standard solution of both sulfadoxine and pyrimethamine were run in triplicate determination for each concentration. The recoveries of both sulfadoxine and pyrimethamine in the tablet were also established and used to confirm the accuracy of the method.
The percentage recovery was calculated using Equation 1.
2.7.3. Precision
Precision of the developed method was determined based on intra-day and inter-day precision. The intra-day precision was evaluated by analyzing six solutions (n = 6) at two concentration levels each of 500 and 125 µg/mL for both sulfadoxine and pyrimethamine, and calculating the actual concentrations of the standard solutions. Triplicate injections were made for each solution within a day and the mean concentrations determined.
The inter-day precision was evaluated in three consecutive days using the same concentrations in the intra-day (n = 18). The concentrations of the two APIs were determined and the relative standard deviations (RSD) were calculated.
2.7.4. Specificity
Specificity of the developed method was assessed by preparing a solution of reference standards of the two APIs in the presence of excipients. Five (5) injections of this solution were carried out to observe any interfering peaks.
2.7.5. Robustness
Robustness of the method was assessed by varying some HPLC conditions and keeping some conditions constant. Six sample solutions were prepared and analyzed using the established chromatographic conditions and by varying some of the conditions including the flow rate (±0.2 mL/min), acetonitrile composition in mobile phase (±2%), mobile-phase pH (± 0.2 units), and column temperature (±3°C). The data obtained were subjected to statistical analysis using analysis of variance (ANOVA).
2.7.6. LOD and LOQ
The limit of detection and the limit of quantification of the developed method were determined from the calibration curve by the use of the Equations 2 and 3.
Where σ = standard deviation of the calibration curve.
S = slope of the calibration curve.
2.8. Selection of internal standard
Different compounds other than sulfadoxine and pyrimethamine were tried as internal standards. Some of the compounds tried were diclofenac, mebendazole and ceferoxine. Each compound was mixed with the standard solution of the two APIs and ran using the established chromatographic conditions. The compound that did not co-elute with either of the APIs but whose peak was well resolved from those of the two APIs with a good retention time was chosen as the internal standard.
2.9. Obtaining the concentration of sulfadoxine and pyrimethamine using the internal standard
Solutions of varied concentrations of the standards of the two APIs were prepared and known amount of the internal standard was added to each. Each solution was then injected in triplicates and the MPA of the APIs and the internal standard recorded. The mean peak area ratios (MPAR) were then calculated for each API, i.e. MPA of API divided by MPA of internal standard. Calibration graphs of MPAR against concentration of each API was plotted to relate MPAR to concentrations (Acheampong, Gyasi, Darko, Apau, & Addai-Arhin, Citation2016; Kupiec, Citation2004; Okine, Asare-Nkansah, & Acheampong, Citation2006). The actual concentrations of both sulfadoxine and pyrimethamine were deduced from the required calibration curves using their respective MPAR. In addition, recovery was performed by injecting mixtures containing known concentrations of the standards of the two APIs and the internal standard, and the MPAR was used to verify the concentrations of the APIs.
3. Results and discussion
3.1. Method development and optimization
3.1.1. Mobile-phase selection
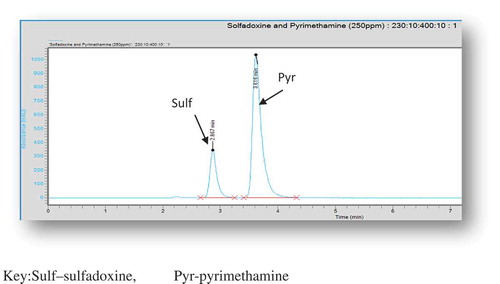
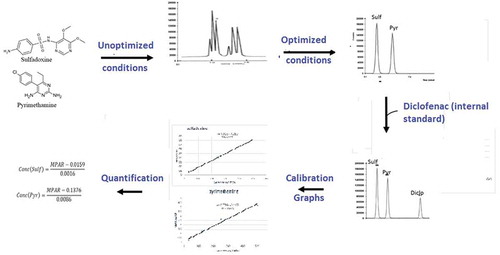
In choosing a suitable mobile phase for the developed method, several factors were taken into consideration. These include the cost of solvent(s), polarities of solvent(s) and the analyte of interest, miscibility with other solvent(s) and chemical inertness (Ahuja, Rasmussen, & Method, Citation2007; Skoog, West, Holler, & Crouch, Citation2004). Initial studies with various solvent systems were performed to select the most effective solvent system for the separation of the two APIs. Solvents such as methanol, ethanol, acetonitrile, chloroform and some phosphate buffers at various pH values were tried. The varying pH values influenced the retention times and resolution of the peaks of the APIs since the APIs are ionizable compounds (Ahuja et al., Citation2007; Singh, Citation2013; Suresh et al., Citation2010). Also, various combinations of these solvents were tried and some gave broad peaks while others gave symmetric peaks but long retention times. Finally, acetonitrile: phosphate buffer (75:25, v/v), pH 2.5, was chosen because it produced well-resolved peaks with the two APIs eluting under 4 min. Sulfadoxine eluted at a mean time of 2.86 min while pyrimethamine eluted at a mean time of 3.61 min as shown in Figure .
Figure 1. Chromatogram of a single injection of solution containing standards of sulfadoxine and pyrimethamine in a binary mixture.
Sulf—sulfadoxine, Pyr—pyrimethamine.
3.1.2. Stationary phase selection
The polarities of the analyte of interest were considered when selecting the stationary phase. As the analytes under study are drug molecules which are polar, reversed-phase column was required to do the separation. Polar molecules spend less time on the stationary phase because of poor affinity between the stationary phase particles and the solute. Hence, due to poor retention on the column, the run time for the analysis was reduced (Ashwin, Priya, & Kumar, Citation2012). Various reversed-phase columns, C8 and C18 columns with various dimensions, were tried but a uBondapak C18 (39 × 300 mm, 3.6 μm) column gave the best results and was thus chosen for the method.
3.1.3. Chromatographic conditions
The established chromatographic conditions for the developed method included mobile phase of acetonitrile and phosphate buffer (75:25, v/v) pH 2.5, a C18 (39 × 300 mm, 3.6 μm) column with a flow rate of 1 mL/min and wavelength of 230 nm. The mode of elution was isocratic. Temperature was kept at 25°C. These conditions gave the best resolution of peaks and separation of components. This is shown in Figure .
3.2. Method validation
3.2.1. Linearity
Linearity of the developed method was established from the standard calibration graphs using regression analysis. The developed method was found to be linear for both sulfadoxine and pyrimethamine in the range of 31.25–500 µg/mL with correlation coefficient (r2) of 0.9976 and 0.9841, respectively. The regression parameters are presented in Table .
Table 1. Calibration curve data for sulfadoxine and pyrimethamine
3.2.2. Accuracy
The accuracy of the method was found by calculating the percentage recoveries of five different concentrations of each component in the binary mixture. The values are presented in Table . The mean recoveries for both sulfadoxine and pyrimethamine are 97.06 and 99.81%, respectively. The method was also accurate in the presence of tablet excipients as presented in Table . The mean recoveries and standard deviations at all three levels of determination were very good for the two APIs.
Table 2. Mean recovery of sulfadoxine and pyrimethamine from binary mixture
Table 3. Summary of validation parameters of sulfadoxine and pyrimethamine
3.2.3. Precision
Precision of the developed method was determined based on inter- and intra-days precisions. Results are shown in Table . The method was found to be precise since RSD values for both inter-day and intra-day precision were below 2.0%.
3.2.4. Robustness
Robustness of the method was determined by observing the changes in different experimental conditions. Changes in the mobile phase pH (±0.2 pH units), acetonitrile composition in the mobile phase (±2%), wavelength (±2 nm) and temperature (±3°C) did not adversely affect the method developed. There were no significant difference between the results obtained with these changes in chromatographic conditions and those from the original chromatographic conditions. This indicates that the developed method showed a high level of robustness.
3.2.5. Specificity
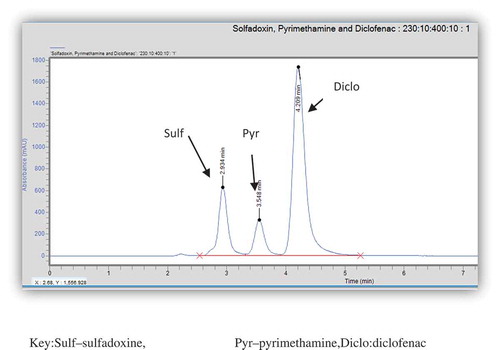
The developed method was very specific to both sulfadoxine and pyrimethamine. Peak purities higher than 99% were obtained for the two APIs in the chromatograms of sample solutions. There were no interfering peaks on the retention times of the APIs in the presence of excipients. This was very evident in the chromatograms of the tablet sample as illustrated in Figure
Figure 2. Chromatogram of a single injection of solution containing standards of sulfadoxine, pyrimethamine and diclofenac (internal standard).
Sulf—sulfadoxine, Pyr—pyrimethamine, Diclo—diclofenac.
3.2.6. LOD and LOQ
The LOD and LOQ measures the sensitivity of the developed method and the HPLC equipment used for the method development. The results are presented in Table . The lowest amount of sulfadoxine and pyrimethamine that could be detected was 0.0396 and 0.1201 μg/mL, respectively. The smallest amount of sulfadoxine and pyrimethamine that could be quantified was 0.8025 and 2.4319 μg/mL, respectively. These values are very small and indicate that even very small amounts of the analytes can be detected using the developed method and the HPLC equipment under consideration. Hence the method is very sensitive.
3.3. Internal standard selection and quantification of APIs with internal standard
Although using external standard method increases accuracy and precision of data, internal standard method tends to yield the most accurate and precise results (Kupiec, Citation2004). Some benefits associated with the use of internal standard are that any loss of sample that may occur at the preparatory stage may be accounted for by a similar loss on the amount of internal standard. Also, the introduction of internal standard helps in the reduction of analysis time (Kupiec, Citation2004). An internal standard was sought and selected for the analysis of sulfadoxine and pyrimethamine. Diclofenac was selected as the best internal standard since its peak was well resolved from the peaks of both sulfadoxine and pyrimethamine with a good retention time close to the retention times of the two API. This is shown in Figure .
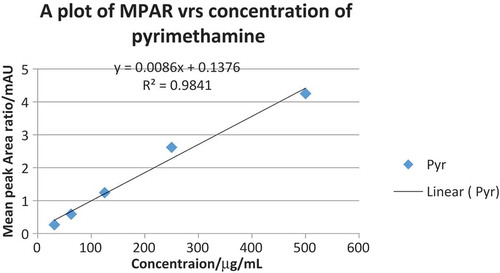
Calibration graphs of MPAR against concentration of each API were plotted (Acheampong et al., Citation2016; Kupiec, Citation2004; Okine et al., Citation2006) and they were linear in the concentration range of 31.25–500 μg/mL for both sulfadoxine and pyrimethamine. The r2 value for sulfadoxine and pyrimethamine were 0.999 and 0.998, respectively. This meant that chromatographic response in terms of peak area ratio can be quantitatively related to concentration for assay purposes (Okine et al., Citation2006). The percentage recovery values ranged between 97 and 110 for the two APIs, indicating that diclofenac is an ideal internal standard for determining the concentration of the APIs.
3.4. Application
3.4.1. Analysis of fixed dose combination tablets
The developed method was used for simultaneous quantification of the APIs in fixed dose combination tablets. Two brands of the sulfadoxine–pyrimethamine tablets on the market (PALIDAR and MALADAR) were analyzed with the proposed method and the results are presented in Table . Using the external standard method, the content (mg) and percentages of each API in each brand of tablets were calculated using peak areas and the regression equations from the calibration curves. The mean percent purity obtained for both sulfadoxine and pyrimethamine in both formulated drugs were in the acceptable range of 90–110% of the labeled amount as stipulated in the British and US pharmacopoeia (British Pharmacopoeia Commision, Citation2009, p. 23). The results showed that the method is accurate in determining the content of the two active ingredients in fixed dose combination tablets.
Table 4. Percent purity of sulfadoxine and pyrimethamine in tablet dosage form using external standard
Table 5. Content of sulfadoxine and pyrimethamine in tablet dosage form using internal standard
Using the internal standard method, the MPAR were plotted against the concentration of each API in order to obtain standard curves (calibration curves). Both calibration curves of sulfadoxine and pyrimethamine were linear with r2 values of 0.9841 and 0.9976, respectively, as indicated in Figures and . The concentration of each API in the tablet formulation was obtained from the regression equation and the MPAR of the APIs in the tablet sample. The mean percent purity obtained for both sulfadoxine and pyrimethamine in the two formulated drugs were 95.70 and 100.03, respectively, in Palidar and 98.50 and 99.75, respectively, in Maladar as indicated in Table , and they were all in the acceptable range of 90–110% of the labeled amount.
Figure 3. A plot of MPAR versus concentrations of sulfadoxine.
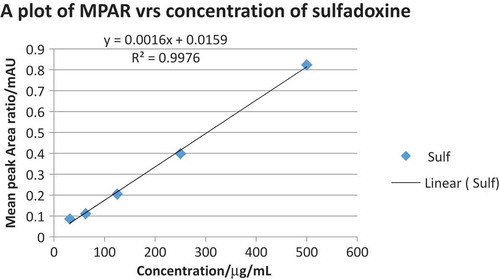
Figure 4. A plot of MPAR versus concentrations of pyrimethamine.
4. Conclusion
A new, accurate, simple and precise RP-HPLC method for simultaneous identification and quantification of sulfadoxine and pyrimethamine in tablet dosage form with PDA detection has been developed and validated. Whereas the existing methods utilize external standards only, an internal standard of diclofenac has been proposed which is very effective in determining the quantity of sulfadoxine and pyrimethamine in tablet dosage form. This method is unique as the use of diclofenac internal standard aided in decreasing inherent errors as well as compensated for small variations in peak area due to sample size fluctuations and variable detector sensitivity. The proposed method is rapid and convenient for laboratory quality control analysis of tablet dosage forms containing the two APIs. The brands of tablet containing sulfadoxine and pyrimethamine analyzed by the validated method had contents of the two APIs in the acceptable limits of the British Pharmacopoeia and therefore showed adequate quality.
Competing interests
The authors declare no competing interests.
Citation information
Cite this article as: Development and validation of RP-HPLC method for simultaneous estimation of sulfadoxine and pyrimethamine in tablet dosage form using diclofenac as internal standard, Akwasi Acheampong, Albert Gyebi, Godfred Darko, Joseph Apau, Wilfred Owusu Gyasi & Sylvester Addai-Arhin, Cogent Chemistry (2018), 4: 1472198.
Cover image
Source: Authors.
Acknowledgments
The authors would like to acknowledge Trade Winds Chemist Ltd. for the supply of the sulfadoxine and pyrimethamine standards. We would also like to acknowledge all the staff of Kwame Nkrumah University of Science and Technology Centralized Laboratory for assisting in the laboratory work and data acquisition.
Additional information
Funding
Notes on contributors

Akwasi Acheampong
Akwasi Acheampong is a senior lecturer in Chemistry with research interests covering analytical chemistry, pharmaceutical chemistry, organic chemistry and natural product chemistry. He is excited about developing cheap and robust HPLC methods for simultaneous estimation of active ingredients of multi-component drug formulations. He is also involved in the development of HPLC-MS methodologies for triacylglycerols profiling of vegetable oils, search for potent phytochemicals that may serve as lead compounds for anti-microbial, anti-malarial, anti-oxidant, or anthelminthic drugs. He is also into heavy metal pollution, water quality analysis and radioactivity exposure research.
Albert Gyebi
Albert Gyebi is a Master of Philosophy candidate.
Godfred Darko
Godfred Darko is a senior lecturer in Chemistry with research interests covering environmental chemistry, analytical chemistry, nano-chemistry, and natural products.
Joseph Apau
Joseph Apau is a senior lecturer in Chemistry with research interest covering analytical chemistry and environmental chemistry.
Wilfred Owusu Gyasi
Wilfred Owusu Gyasi is a Master of Philosophy candidate.
Sylvester Addai-Arhin
Sylvester Addai Arhin is a lecturer in pharmaceutical science with research interests in analytical chemistry and pharmaceutical chemistry.
Related Research Data
References
- Acheampong, A., Gyasi, W. O., Darko, G., Apau, J., & Addai-Arhin, S. (2016). Validated RP-HPLC method for simultaneous determination and quantification of chlorpheniramine maleate, paracetamol and caffeine in tablet formulation. SpringerPlus, 5, 625. doi:10.1186/s40064-016-2241-2
- Ahuja, S., & Rasmussen, H. (2007). Development for pharmaceuticals (Vol. 8, pp. 1–12). New Jersey, NJ: Johnson and Johnson Pharmaceutical Research and Development, LLC Raritan.
- Arayne, M. S., Sultana, N., Siddiqui, F. A., Naseem, S., & Qureshi, F. (2010). Simultaneous determination of pyrimethamine, sulfadoxine, mefloquine, and ibuprofen in pharmaceutical formulations by RP-HPLC. Medicinal Chemistry Research, 19(9), 1043–1054. doi:10.1007/s00044-009-9250-4
- Ashwin, H., Priya, J., & Kumar, D. P. (2012). Development and validation of RP-HPLC method in multi-component formulation. International Researcher Journal Pharmaceutical, 3(8), 2230–8407.
- Basco, L. K. (2004). Molecular epidemiology of malaria in Cameroon. XIX. Quality of antimalarial drugs used for self-medication. The American Journal of Tropical Medicine and Hygiene, 70(3), 245–250.
- British Pharmacopoeia Commision. (2009). British pharmacopoeia. London: Author.
- Garner, P., & Brabin, B. (1994). A review of randomized controlled trials of routine antimalarial drug prophylaxis during pregnancy in endemic malarious areas. Bulletin of the World Health Organization, 72(1), 89.
- International Conference on Harmonization, ICH Harmonized Tripartite Guideline. (1995). Text on validation of analytical procedures. Federal Register, 60, 11260.
- Kumar, V. A., Sindgi, V. M., Satla, S. R., & Thimmaraju, M. K. (2016). Stability Indicating RP-HPLC method for the simultaneous estimation of pyrimethamine and sulphadoxine in bulk and tablet dosage form. Journal of Applied Pharmaceutical Science, 6(03), 71–76. doi:10.7324/JAPS
- Kumari, M. K., & Kasthuri, J. K. (2014). A validated liquid chromatographic method for the determination of sulfadoxine and pyrimethamine. World Journal Pharmaceutical Pharmaceutical Sciences, 3(10), 1032–1043.
- Kupiec, T. (2004). Quality-control analytical methods : High-performance liquid chromatography. International Journal of Pharmaceutical Compounding, 8(3), 223–227.
- Lewison, G., & Srivastava, D. (2008). Malaria research, 1980–2004, and the burden of disease. Acta Tropica, 106(2), 96–103. doi:10.1016/j.actatropica.2008.01.009
- Mbinze, J. K., Yemoa, A., Lebrun, P., Sacré, P., Habyalimana, V., Kalenda, N., … Marini, R. D. (2015). Fighting poor quality medicines : Development, transfer and validation of generic HPLC methods for analyzing two WHO recommended antimalarial tablets. American Journal of Analytical Chemistry, 6(2), 127–144. doi:10.4236/ajac.2015.62012
- Newton, P., Proux, S., Green, M., Smithuis, F., Rozendaal, J., Prakongpan, S., … White, N. J. (2001). Fake artesunate in Southeast Asia. The Lancet, 357(9272), 1948–1950. doi:10.1016/S0140-6736(00)05085-6
- Newton, P. N. (2002). Murder by fake drugs. BMJ, 324, 800–801. doi:10.1136/bmj.324.7341.800
- Okine, N. N. A., Asare-Nkansah, S., & Acheampong, A. (2006). Simultaneous determination of sulphamethoxazole and trimethoprim in co-trimoxazole tablets using RP-LC analysis. Journal of Science and Technology, 26(3), 66–74.
- Rao, B. T., Krishna, P. M., Kumar, R. K., & Venkateswarlu, P. (2011). The forced degradation and solid state stability indicating study and validation of method for the determination of assay of Artesunate by HPLC. Researcher Journal Pharmaceutical Biologic Chemical Sciences, 2(1), 111–117.
- Raveendra, V., Vemula, B., & Sharma, P. K. (2013). RP-HPLC method development and validation for simultaneous estimation of diclofenac and tolperisone in tablet dosage form. Asian Journal Pharmaceutical Clinical Researcher, 6(3), 186–189.
- Santos, A. L., Takeuchi, R. M., & Stradiotto, N. R. (2009). Electrochemical, spectrophotometric and liquid-chromatographic Ap- proaches for analysis of tropical disease drugs. Current Pharmaceutical Analysis, 5, 69–88. doi:10.2174/157341209787314927
- Singh, R. (2013). HPLC method development and validation- an overview. Journal Pharmaceutical Education Researcher, 4(1), 26–33.
- Skoog, D. A., West, D. M., Holler, J. F., & Crouch, S. R. (2004). Fundamentals of analytical chemistry (8th ed.). Belmont, USA: Published by David Harris.
- Suresh, S. K., Latif, J. D., Krishnamurthy, B., Prashant, B., Vasantharaju, S. G., & Udupa, N. (2010). Analytical method development and validation for aspirin. International Journal Chemical Technical Researcher, 2(1), 389–399.