
Abstract
Determining and linking the structural heterogeneity of recombinant antibodies to function is critical in the biopharmaceutical industry. We introduce a new microfluidic capillary electrophoresis—mass spectrometry (μCE-MS) approach to characterize intact monoclonal antibody (mAb) and simultaneously quantifying distinct variants. Our MS analysis of intact NIST mAb (RM8671) shows 18 variants identified amongst proteolytic and glycolytic modifications with a range of relative abundances between 0.1% and 100%. In order to verify our quantitative MS results, we used an established system based on capillary electrophoresis—with laser induced fluorescence (CE-LIF) for profiling the N-glycans. All major glycans were identified and further substantiated by exoglycosidase digestion. Interestingly, the µCE-MS analysis of intact NIST mAb consistently yielded higher amounts of G2FG2F-Hex glycoform (~3.4%), whereas the CE-LIF analysis indicates that only 1.4% of G2F-Gal is present. Therefore, the additional hexose adduct observed in µCE-MS may have been the glycation product of the mAb. Further analysis of deglycosylated mAb with µCE-MS made it possible to reveal the glycation with 10.5% of one hexose product and 4.9% of two hexose product in the intact deglycosylated antibody. An integrated solution using two orthogonal and complementary techniques for characterizing antibody glycosylation is provided here.
PUBLIC INTEREST STATEMENT
Monoclonal antibodies (mAbs) have emerged as important bio-therapeutics on the market. Since glycosylation is one of the important quality attributes of mAbs that impact efficacy, safety, and potency of the drug, regulatory agencies imposed stringent requirements for glycan analysis. High throughput glycan analysis can often be the rate-limiting step in the analytical characterization of biopharmaceuticals. Manufacturers of recombinant biopharmaceuticals have to deliver products with consistent quality attributes in order to assure reproducible clinical performance.
We introduce microfluidic capillary electrophoresis—mass spectrometry (µCE-MS) approach to characterize intact mAb and simultaneously quantifying distinct proteoform and glycoform variants. We also report the application of a high throughput glycan analysis method utilizingcapillary electrophoresis with laser-induced fluorescence detection. A simple streamlined workflow in combination with a multi-capillary CE instrument offers a high resolution and high throughput glycan analysis platform for glycan and can address the current unmet needs of the industry.
1. Introduction
Recombinant antibodies have become one of the most important biopharmaceuticals since their commercialization in 1986 (Buss, Henderson, McFarlane, Shenton, & De Haan, Citation2012; Ecker, Jones, & Levine, Citation2015) as high target specificity within the human body provides significant value in targeted therapy. During drug development and manufacturing, undesired mutations and in vitro modifications may introduce sample heterogeneity causing changes to the protein structure and potentially leading to the loss of drug efficacy (Kaltashov et al., Citation2012). Therefore, the availability of a quick and comprehensive method to detect and assess any variability that might occur during drug development is necessary. Mass spectrometry (MS) has become one of the most important monoclonal antibody (mAb) characterization methods in recent years (Beck, Sanglier-Cianférani, & Van Dorsselaer, Citation2012; Chen et al., Citation2011). Characterization of mAbs at the intact level requires minimal sample preparation, which can save time and reduce the possibility of degradation during sample handling. Matrix-assisted laser desorption/ionization (MALDI) MS is commonly used for fast screening of intact proteins as it requires simple sample preparation and easy identification due to the feature of singly charged ions (Lin, Campbell, Mueller, & Wirth, Citation2003). Although the detection efficiency of very large biomolecular ions has been much improved (Chen, Lin, Chu, & Chen, Citation2010; Wenzel, Matter, Schultheis, & Zenobi, Citation2005), small variants occurring within a given mAb cannot be resolved by MALDI-MS due to the insufficient resolution at very high m/z range. Electrospray ionization (ESI) MS is another way for large biomolecule analysis that generates multiple charges at low m/z range (Fenn, Mann, Meng, Wong, & Whitehouse, Citation1989), and its exact molecular weight can be obtained by advanced deconvolution algorithms. Following the development of high resolution MS, major post-translational modifications (PTMs) can be resolved at the intact level (Hao et al., Citation2015). Manufactured mAb products are heterogeneous due to a complex mixture of all possible PTMs (Walsh & Jefferis, Citation2006), and each variant might consist of different combinations of PTMs, such as glycosylation, N-terminal pyroglutamate formation, deamidation, oxidation and glycation (Li et al., Citation2015). Simultaneous introduction of all present variants into MS can hinder the accurate assignment of charged ions to the corresponding variant, especially given the multiply-charged nature of the ions generated using ESI. Proper upfront separation of the complex variant mixture will be very helpful for successful MS analysis.
The current and most commonly used technique for protein characterization is based on liquid chromatography—mass spectrometry (LC-MS). Here, the LC separation of protein variants is not efficient, especially when LC buffer has to be adjusted to MS compatible (Bobály, Sipkó, & Fekete, Citation2016; Regnier & Kim, Citation2018). In comparison, capillary electrophoresis (CE) has been described as an effective and gentle protein separation method (Schwartz & Pritchett, Citation1994) and can be performed at room temperature. Furthermore, charge variance amongst protein variants allows separation to occur in a predictable way (Carbeck, Colton, Gao, & Whitesides, Citation1998). Coupling this gentle and high efficient separation technology to MS has been pursued in recent years (Cai & Henion, Citation1995; Liu, Zhang, & Dovichi, Citation2005; Smith, Wahl, Goodlett, & Hofstadler, Citation1993). Several CE-MS platforms were introduced recently for intact protein separation and characterization (Han, Rock, Pearson, & Rock, Citation2016; Sarg et al., Citation2013; Zhao, Sun, Knierman, & Dovichi, Citation2016). The newly introduced microfluidic CE-MS (µCE-MS) technology used in this study provides unprecedented short analysis time of 3 min by using higher electrical field strength than previously reported (Redman, Batz, Mellors, & Ramsey, Citation2015; Redman, Mellors, Starkey, & Ramsey, Citation2016; Wang et al., Citation2015). LC-MS and µCE-MS techniques have not been able to provide quantitative results on detectable variants of intact proteins.
Our study shows the feasibility and first results on quantifying variants of intact proteins. Further, it also determined the presence and relative abundance of non-enzymatic glycation in our study of NIST mAb that is known to occur in proteins (Hermodson, Citation1992, Takátsy et al., Citation2009). In order to validate the analysis of intact protein glycoforms with µCE-MS, we examined the glycosylation profile via capillary electrophoresis – laser-induced fluorescence (CE-LIF). The glycans released from the mAb by Peptide-N-Glycosidase F (PNGase F) digestion were labeled with 8-Aminopyrene-1,3,6-Trisulfonic Acid, Trisodium Salt (APTS) and analyzed via CE-LIF, resulting into profiles showing the relative abundance of each glycan peak. CE-LIF has been widely used in glycan analysis due to its unique capability for multiplex high throughput separation of glycan isomers, and sensitive LIF detection (Aich, Lakbub, & Liu, Citation2016; Feng et al., Citation2017).
2. Materials and methods
The mAb used in this study is a reference material known as NIST RM8671 (Lot Number 14HB-D-001) and was obtained from the National Institute of Standard and Technology (NIST; Gaithersburg, MD) (Formolo et al., Citation2015). NIST RM8671 is a recombinant humanized IgG1κ antibody, and process-related impurities have been removed through various purification steps (Tarlov & Choquette, Citation2016). NIST RM8671 is characterized by high abundance of PTMs of C-terminal lysine clipping, N-terminal pyroglutamination, and glycosylation, and low abundance of glycation, deamidation, and oxidation. GlycanAssure Core Reagents kit, GlycanAssureBeads, GlycanAssureAPTS kit, LIZ600 DNA Ladder (LIZ 600), POP-7 polymer and 16-hole magnet stand were acquired from Thermo Fisher Scientific (South San Francisco, CA, USA). PNGase F and cleavage buffers were provided in each dye labeling kit. Galactosidase S (P0745S) and Neuramididase A (P0722S) enzymes were purchased from New England Biolabs (Ipswich, MA).
2.1. Intact mAb µCE-MS
The CE separation of the intact mAb was performed using a ZipChipTM CE device (908 Devices/Thermo Scientific). The chip was first primed with background electrolyte solution (BGE) consisting of 0.2% acetic acid and 10% 2-propanol (pH 3.17) with 6 psi gas pressure supplied from the sheath gas of MS. Once a stable ESI was established, 10 μL of 0.5 μg/μL mAb was manually pipetted into the sample reservoir. Samples were injected into the CE separation channel with 2 psi pressure for 5 s, which corresponds to an injection volume of 0.65 nL. High voltage of ~20 kV was applied for CE separation within 22 cm channel length on the HR chip, and ~2 kV was used for the ESI. The separations were completed in 3 min. The intact mAb mass spectroscopy was analyzed using a Q-Exactive Plus MS (Thermo Scientific). The MS resolution of 17.5 k was used at the scan rate of 12 scans/s. In-source collision-induced dissociation (100 e.v.) was provided to assist desolvation. The mass to charge (m/z) range (2500–6000) was selected for this mild-denatured condition of mAb. The MS instrument provided 2 psi of sheath gas to support ESI generation. Pressure assistance with the pressure of 2 psi was used to support CE migration. BioPharma Finder 2.0 software (Thermo Scientific) was used for data analysis. The amino acid sequence, disulfide bond linkages, and PTM information of NIST mAb were set up in the database of protein sequence manager. The intact mass was calculated through the deconvolution algorithm of ReSpectTM (Positive Probability, Ltd. (PPL)) using sliding window feature. The identification of each variant was below a mass error of 25 ppm.
The NIST mAb was stored in formulation buffer with 12.5 mM L-histidine, 12.5 mM L-histidine HCL (pH 6.0) at −80°C until analysis. The mAb sample was diluted with deionized water to 0.5 μg/μL for the intact analysis. No desalting procedure was used. BGE was prepared in a glass bottle before the experiments. Solvents of Optima LC/MS grade from Fisher Scientific (Fair Lawn, NJ) were used in this study including water (W6-500), acetic acid (A113-50), and 2-propanol (A461-1).
2.2. Deglycosylated mAb µCE-MS
For the investigation of glycation, the N-glycan has to be removed from the intact mAb. The de-glycosylation was performed with combination of 10 µL of NIST-mAb (10 µg/µL), 5 µL of PNGase F (N-Glycanase Ultra, 400 mU), 5 µL of HEPES buffer (0.5 M, pH 7.9), and 80 µL of water at 37°C overnight. The deglycosylated mAb was then collected with 10k centrifugal filters (Amicon Ultra-0.5 mL) with a final concentration of 0.5 µg/µL.
2.3. Glycan CE-LIF
Glycan release, purification, and fluorescent labeling were performed by following the GlycanAssure kit protocol. The detailed procedure for glycan release, glycan purification, and fluorescent labeling were introduced in our previous work (Feng et al., Citation2017).
In specific, for glycan release, 10 µL NIST-mAb (10 µg/µL) combined with 25.5 µL HPLC grade water, and 4 µL PNGase F cleavage buffer to reach a volume of 39.5 µL. 0.5 µL recombinant PNGase F (500 U/µL) was added into the above mixture. The cleavage reaction was incubated at 50°C for 1 h. The released glycan further passed through the purification step by using magnetic beads and eluted to 50 μL elution buffer, and then 20 μL of released glycans were labeled with APTS reagent in the APTS Kit. The excess dye was removed by magnetic beads before the sample was collected.
For the exoglycosidase treatment of N-glycan released from NIST-mAb, 9 µL APTS labeled glycans were mixed with 1 µL respective enzyme, additional 1 µL 0.5 M sodium acetate, pH 5.5, and 1 µL 1 mg/mL BSA were added. The mixtures were then incubated at 37°C for 1 h (Feng et al., Citation2017).
DNA Analyzer (ABI 3130xl, Applied Biosystems) was used for glycan separation with 50 cm × 16-capillary array and POP 7 polymer. The separation module applied was the default module, Fragmentanalysis_POP_7. Electropherograms data were collected by GeneMapper 5.0 (Thermo Fisher Scientific). The peak areas and relative abundance were captured by using an in-house developed Matlab application (Table ). A 96-well reaction plate (Thermo Fisher Scientific) was used to run the samples. In each plate well, 2 µL labeled glycan solution was mixed with 8 µL CE sample loading matrix. While the loading matrix was prepared by adding 8 µL of LIZ 600 into 200 µL CE loading buffer. The loading buffer matrix was incubated at 60°C for 5 min and cooled down to room temperature prior to use.
Table 1. (A) 18 variants identified from the NIST mAb in a 3-min run of µCE-MS, including the information of relative abundance and migration time. (B) Five major glycoforms were listed in the three groups of lysine variances including 0K, 1K, and 2K. Their fractional abundance were calculated from the group of 0K, 1K and 2K
Table 2. Detected glycan signals at 100 μg injected sample with relative peak area ratios and correlating standard deviations (SD)
3. Results and discussion
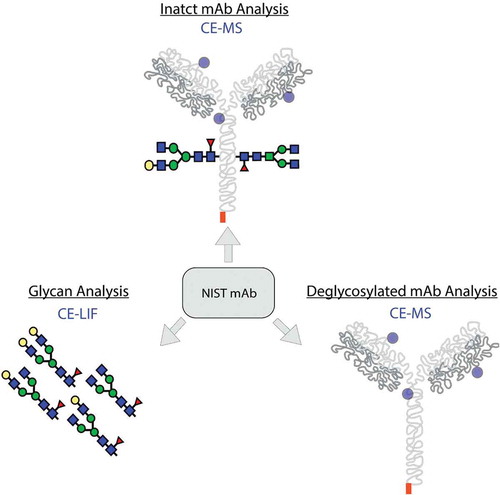
The analysis and characterization of intact proteins is commonly conducted via LC-MS, but the LC separation of protein variants with MS compatible buffers is still challenging. In recent years, advancements in CE-MS technology, such as microfluidic chip based separation systems, have shown that these emerging tools are suitable for intact protein analysis and higher throughput. In this study, the intact mAb was first screened with µCE-MS. After the glycans were released, de-glycosylated mAb was analyzed with µCE-MS, and released glycan was analyzed by the CE-LIF (Figure ).
Figure 1. Workflow for the comprehensive characterization of NIST mAb includes the intact mAb analysis with µCE-MS, glycoform analysis with CE-LIF, and deglycosylated mAb analysis with µCE-MS.
3.1. Intact mAb
The intact mAb was directly analyzed via µCE-MS utilizing the ZipChipTM CE interface technology, which is capable to separate mAb variants before entering the MS system (Supporting Information Figure S1). The intact NIST mAb was separated into several peaks within a 3-min separation window (Figure ). The separated variant forms include 0 additional lysine (0-Lys or 0K), 1 additional lysine (1-Lys or 1K) and 2 additional lysines (2-Lys or 2K) at the C-terminal of heavy chains. The positive charges from the additional lysines reduced the migration time. The mass spectra from 0-Lys, 1-Lys, and 2-Lys became distinguishable and clear after they were separated (Figure ,). The charge distribution of the intact mAb mass spectrum remained within the mass range of m/z 4,600–5,800 with corresponding charge states (Figure ). Figure shows the deconvoluted mass spectrum across all charge states for 0-Lys, 1-Lys and 2-Lys. Here, seven clear peaks with a difference of 162 Da mass can be resolved after deconvolution with the sliding window ReSpectTM algorithm indicative of glycan variants. Deconvolutions were performed over each specific time window for 0-Lys, 1-Lys, and 2-Lys variants (Figure ). Five major glycoforms were observed at different lysine variants. Due to higher signal intensity from the 0-Lys and 1-Lys variants, two additional glycoforms were observed from the 0-Lys variant, and one from the 1-Lys variant. Overall, 18 described variants from the NIST mAb were identified on the µCE-MS platform and their relative abundances were quantified (Table ). CE-MS platforms are capable of separating multiple lysine variants and our study presents the first quantitative results on protein variants. The presented µCE-MS analysis workflow provides a quick solution for intact mAb characterization. Upfront CE separation of charge variants reduces the complexity of heterogeneous mAbs, and the detection of lower abundant variants becomes possible via MS analysis. Presented data provide three orders of dynamic range to detect compounds down to 0.09% relative abundance (e.g. glycosylation form of G2F/G2F and the lowest abundance of lysine clipping form of 2-Lys). The identified variants were confirmed despite narrow migration times (Supporting Information Figure S2). The same 18 variants are also presented as the fractional abundance relative to total peak area for each lysine variant (Table ). The intact mAb µCE-MS analysis has shown all major glycoforms, as well as all three possible lysine variants and their relative quantification. This method is a useful tool for quick screening of therapeutic mAbs, including PTM information of proteoforms and glycoforms.
Figure 2. (A) Electropherograms of the NIST mAb in a 3-min run on a microfluidic CE coupled to a Q-Exactive MS. Variant forms having 0K, 1K and 2K attached to the C-terminal heavy chain of mAb were separated. (B) Three mass spectra were averaged over the widths from the three peaks on the electropherogram from left to right. (C) Deconvoluted mass spectra from three different migration time intervals including mAb with 2K adduct, mAb with 1K adduct, and mAb with 0K adduct.
3.2. Released glycan
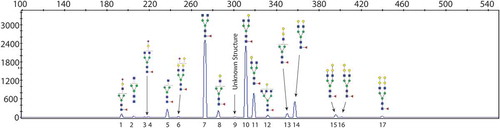
In order to verify our quantitative µCE-MS results, we used the established CE-LIF method for verification for deep glycan profiling and quantitative analysis. Released glycans from the NIST mAb were labeled with APTS and analyzed via CE-LIF (Supporting Information Figure S3). Obtained electropherograms show 17 peaks of resolved APTS-labeled glycans (Figure ). All major glycan structures were identified and labeled. Only one peak was not identified due to lack of glycan standards and very low relative quantity to positively determine the structure. The observation of G0F-GlcNAc, G0F, G1F, G1Fʹ, G2F, and G2F+Gal aligns with the intact mAb glycoforms in the µCE-MS intact mAb analysis. Ten additional glycans including G0-GlcNAc, G1F-GlcNAc, G2F+2Gal, and other minor fucosylated and sialylated glycans, can be identified from the released glycans using CE-LIF but not in the intact mAb µCE-MS analysis. Identification of the glycans by CE-LIF was performed by using a parallel exoglycosidase approach using two enzymes (Supporting Information Figure S4 and Table S2). Further confirmation of individual glycans was done by spiking of the respective individual standards (data not shown). CE separation system showed the separation of structural isomers of G1F (Peaks 10 and 11) and G2F+Gal (Peaks 15 and 16), arising from α1-3 and α1-6-arm galactosylation. The peak assignment was made based on the literature precedence, the peaks with α1-6-arm galactosylation have been reported to migrate faster than the peaks with α1-3-arm galactosylation (Reusch et al., Citation2015). The relative quantity of each of these glycans was determined from three separate glycan releases and labeling experiments. Each labeled glycan sample was analyzed by three consecutive injections on a DNA Analyzer. Repeatability of NIST mAb APTS analysis using DNA Analyzer is evaluated by analyzing the peak area ratios of all the peaks above 0.1% for different IgG input amounts (Supporting Information Figure S5). For data evaluation all peaks above 0.1% relative abundance were numbered and peak areas were added-up to 100% and respective standard deviations (SD) were calculated (Table and Supporting Information Table S1). The excellent reproducibility of the method corroborated by the SD values make the sample preparation method very robust and precise. Small SDs obtained across various input amounts of NIST mAb resulted in high confidence in the relative quantitation of each glycan found in the antibody (Supporting Information Table S1). The resulting relative quantitation is shown in Table . As expected, the most abundant glycans found in this NIST mAb are the G0F, G1F and G2F, where the G0F and G1F both in the range of 40% of total N-glycan released from the NIST mAb and the G2F is about 7% of the total glycan. This finding is in agreement with the µCE-MS analysis of the intact NIST mAb. The CE-LIF based analysis offers higher sensitivity compared to µCE-MS. Therefore, multiple other glycan structures with <5% abundance of total glycan were identified via CE-LIF. The relative quantity of each major glycoform is highly similar between the intact mAb µCE-MS method and the released glycan CE-LIF analysis. The relative quantities of the APTS labeled glycans reported here are in agreement with recently reported values (Hilliard et al., Citation2017; Prien et al., Citation2015). Interestingly, we detected the G2F(+Gal) glycan structure with 1.4% fractional abundance, but we detected more than twice as much of G2F(+Hex) in 0- and 1-lysine variants in the intact NIST mAb via CE-MS analysis. This difference in abundance indicates that only half of the +Hex structure reported by our intact NIST mAb analysis stems from the +Gal, and half of the unknown +Hex may be attributed to glycation at the protein backbone. Therefore, we aimed to analyze deglycosylated mAb via CE-MS to validate the presence of glycation.
Figure 3. CE-LIF electropherogram for APTS-labeled N-glycans released from NIST mAb (IgG input 100 mg, 10× dilution).
3.3. Deglycosylated mAb
After the glycans were removed by PNGase F, the deglycosylated mAb was analyzed by µCE-MS. In comparison to the raw mass spectra from the 0-Lys part of the intact mAb and deglycosylated mAb, a clear shift from the higher m/z to the lower m/z region, which comes from the release of glycan was observed (Figure ,). After glycan release, seven different glycoforms were reduced to 3. All N-linked glycans were removed by PNGase F, and only one pure compound from the de-glycosylated mAb was expected. The extra two peaks with the mass shift of 162 and 324 Da were observed and were recognized as one and two hexose adducts from glycation. The quantitative values of hexose adducts combined with lysine variants are listed in Table . The quantity of mAb0K(+1Hex) with 10.5% and mAb0K(+2Hex) with 4.9% is greater than the estimated relative quantity of the G2F(+Gal) with 1.4% from the glycan analysis. And finding of the deglycosylated mAb (+Hex) adduct indicates that there may be some level of glycation in this lot of mAb.
Table 3. Identified variants from the deglycosylated NIST mAb
Figure 4. Investigation of glycation by comparing the raw mass spectra from (A) intact mAb and (B) deglycosylated mAb. Spectra comes from 0-Lys variance under 29+ charge state.
4. Conclusion
The presented µCE-MS analysis workflow provides a quick solution for intact mAb characterization, and our study presents the first quantitative results on protein variants. The quantitative MS results have been corroborated by the established CE-LIF method. In addition, the µCE-MS measurements detected a glycation event, which was further verified by CE-LIF examination. Overall, the high-throughput µCE-MS and CE-LIF analyses provided comprehensive information on the proteoforms, glycoforms, and glycation of the mAb of interest.
Abbreviations
NIST, National Institute of Standard and Technology; mAb, monoclonal antibody; PNGase F, Peptide-N-Glycosidase F, 8-Aminopyrene-1,3,6-Trisulfonic Acid, Trisodium Salt APTS, CE, capillary electrophoresis; MS, mass spectrometry; LIF, laser induced fluorescence; MALDI, matrix-assisted laser desorption ionization; ESI, electrospray ionization; PTMs, post-translational modifications; BGE, background electrolyte solution; LC, liquid chromatography; µCE-MS, microfluidic capillary electrophoresis-mass spectrometry
Competing interests
No potential conflicts of interest were disclosed.
Supplemental Material
Download Zip (4.4 MB)Acknowledgements
The authors gratefully acknowledge the help and support of Scott Mellors, Erin Redman from 908 Devices Inc., and Zoltan Szabo, Stephane Houel, Jennifer Sutton, and Darren Bauer from Thermo Fisher Scientific Inc.
Supplementary material
Supplemental data for this data article can be accessed here.
Additional information
Funding
Notes on contributors
Andreas Krupke
The work reported here consists of combined research efforts by two groups from industry (Thermo Fisher Scientific) and one group from an academic institution (Singapore National University). Our research interests include the development of capillary electrophoresis instrumentation, reagents, software, and analytical methods for analysis of glycans from biopharmaceuticals. In addition to separation techniques we are also developing other tools such as mass spectrometry for complete characterization of biomolecules.
Related Research Data
References
- Aich, U., Lakbub, J., & Liu, A. (2016). State-of-the-art technologies for rapid and high-throughput sample preparation and analysis of N-glycans from antibodies. Electrophoresis, 37, 1468–1488. doi:10.1002/elps.201500551
- Beck, A., Sanglier-Cianférani, S., & Van Dorsselaer, A. (2012). Biosimilar, biobetter, and next generation antibody characterization by mass spectrometry. Analytical Chemistry, 84, 4637–4646. doi:10.1021/ac3002885
- Bobály, B., Sipkó, E., & Fekete, J. (2016). Challenges in liquid chromatographic characterization of proteins. Journal of Chromatography B, 1032, 3–22. doi:10.1016/j.jchromb.2016.04.037
- Buss, N. A., Henderson, S. J., McFarlane, M., Shenton, J. M., & de Haan, L. (2012). Monoclonal antibody therapeutics: History and future. Current Opinion in Pharmacology, 12, 615–622. doi:10.1016/j.coph.2012.08.001
- Cai, J., & Henion, J. (1995). Capillary electrophoresis-mass spectrometry. Journal of Chromatography A, 703, 667–692. doi:10.1016/0021-9673(94)01178-H
- Carbeck, J. D., Colton, I. J., Gao, J., & Whitesides, G. M. (1998). Protein charge ladders, capillary electrophoresis, and the role of electrostatics in biomolecular recognition. Accounts of Chemical Research, 31, 343–350. doi:10.1021/ar970255q
- Chen, C.-H., Lin, J.-L., Chu, M.-L., & Chen, C.-H. (2010). MALDI ion trap mass spectrometer with charge detector for large biomolecule detection. Analytical Chemistry, 82, 10125–10128. doi:10.1021/ac102217e
- Chen, G., Warrack, B. M., Goodenough, A. K., Wei, H., Wang-Iverson, D. B., & Tymiak, A. A. (2011). Characterization of protein therapeutics by mass spectrometry: Recent developments and future directions. Drug Discov Today, 16, 58–64. doi:10.1016/j.drudis.2010.11.003
- Ecker, D. M., Jones, S. D., & Levine, H. L. (2015). The therapeutic monoclonal antibody market. MAbs, 7, 9–14. doi:10.4161/19420862.2015.989042
- Feng, H.-T., Li, P., Rui, G., Stray, J., Khan, S., Chen, S.-M., & Li, S. F. Y. (2017). Multiplexing N-glycan analysis by DNA analyzer. Electrophoresis, 38, 1788–1799. doi:10.1002/elps.201600404
- Fenn, J., Mann, M., Meng, C., Wong, S., & Whitehouse, C. (1989). Electrospray ionization for mass spectrometry of large biomolecules. Science, 246, 64–71.
- Formolo, T., Ly, M., Levy, M., Kilpatrick, L., Lute, S., Phinney, K., … Schiel, J. (2015). Determination of the NISTmAb primary structure. In State-of-the-art and emerging technologies for therapeutic monoclonal antibody characterization volume 2 biopharmaceutical characterization: The NISTmAb case study (pp. 1–62). American Chemical Society.
- Han, M., Rock, B. M., Pearson, J. T., & Rock, D. A. (2016). Intact mass analysis of monoclonal antibodies by capillary electrophoresis-mass spectrometry. Journal of Chromatography B, Analytical Technologies in the Biomedical and Life Sciences, 1011, 24–32. doi:10.1016/j.jchromb.2015.12.045
- Hao, Z., Zhang, T., Xuan, Y., Wang, H., Qian, J., Lin, S., … Cianférani, S. (2015). Intact antibody characterization using orbitrap mass spectrometry. In State-of-the-art and emerging technologies for therapeutic monoclonal antibody characterization volume 3. Defining the next generation of analytical and biophysical techniques (pp. 289–315). American Chemical Society.
- Hermodson, M. (1992). Foreword A2 - Angeletti, Ruth Hogue. Techniques in protein chemistry III (p. xiii). Academic Press.
- Hilliard, M., Alley, W. R., Jr., McManus, C. A., Yu, Y. Q., Hallinan, S., Gebler, J., & Rudd, P. M. (2017). Glycan characterization of the NIST RM monoclonal antibody using a total analytical solution: From sample preparation to data analysis. MAbs, 9, 1349–1359. doi:10.1080/19420862.2017.1377381
- Kaltashov, I. A., Bobst, C. E., Abzalimov, R. R., Wang, G., Baykal, B., & Wang, S. (2012). Advances and challenges in analytical characterization of biotechnology products: Mass spectrometry-based approaches to study properties and behavior of protein therapeutics. Biotechnology Advances, 30, 210–222. doi:10.1016/j.biotechadv.2011.05.006
- Li, W., Kerwin, J. L., Schiel, J., Formolo, T., Davis, D., Mahan, A., & Benchaar, S. A. (2015). Structural elucidation of post-translational modifications in monoclonal antibodies. In State-of-the-art and emerging technologies for therapeutic monoclonal antibody characterization volume 2. Biopharmaceutical characterization: The NISTmAb case study (pp. 119–183). American Chemical Society.
- Lin, M., Campbell, J. M., Mueller, D. R., & Wirth, U. (2003). Intact protein analysis by matrix-assisted laser desorption/ionization tandem time-of-flight mass spectrometry. Rapid Communications in Mass Spectrometry, 17, 1809–1814. doi:10.1002/rcm.1102
- Liu, C. C., Zhang, J., & Dovichi, N. J. (2005). A sheath-flow nanospray interface for capillary electrophoresis/mass spectrometry. Rapid Communications in Mass Spectrometry, 19, 187–192. doi:10.1002/rcm.1769
- Prien, J. M., Stöckmann, H., Albrecht, S., Martin, S. M., Varatta, M., Furtado, M., … Schiel, J. E. (2015). Orthogonal technologies for NISTmAb N-glycan structure elucidation and quantitation. In State-of-the-art and emerging technologies for therapeutic monoclonal antibody characterization volume 2. Biopharmaceutical characterization: The NISTmAb case study (pp. 185–235). American Chemical Society.
- Redman, E. A., Batz, N. G., Mellors, J. S., & Ramsey, J. M. (2015). Integrated microfluidic capillary electrophoresis-electrospray ionization devices with online MS detection for the separation and characterization of intact monoclonal antibody variants. Analytical Chemistry, 87, 2264–2272. doi:10.1021/ac503964j
- Redman, E. A., Mellors, J. S., Starkey, J. A., & Ramsey, J. M. (2016). Characterization of intact antibody drug conjugate variants using microfluidic capillary electrophoresis-mass spectrometry. Analytical Chemistry, 88, 2220–2226. doi:10.1021/acs.analchem.5b03866
- Regnier, F. E., & Kim, J. (2018). Proteins and proteoforms: New separation challenges. Analytical Chemistry, 90, 361–373. doi:10.1021/acs.analchem.7b05007
- Reusch, D., Haberger, M., Maier, B., Maier, M., Kloseck, R., Zimmermann, B., … Wuhrer, M. (2015). Comparison of methods for the analysis of therapeutic immunoglobulin G Fc-glycosylation profiles–part 1: Separation-based methods. MAbs, 7, 167–179. doi:10.4161/19420862.2014.986000
- Sarg, B., Faserl, K., Kremser, L., Halfinger, B., Sebastiano, R., & Lindner, H. H. (2013). Comparing and combining capillary electrophoresis electrospray ionization mass spectrometry and nano-liquid chromatography electrospray ionization mass spectrometry for the characterization of post-translationally modified histones. Molecular & Cellular Proteomics, 12, 2640–2656. doi:10.1074/mcp.M112.024109
- Schwartz, H., & Pritchett, T. (1994). Separation of proteins and peptides by capillary electrophoresis: Application to analytical biotechnology. Beckman Coulter.
- Smith, R. D., Wahl, J. H., Goodlett, D. R., & Hofstadler, S. A. (1993). Capillary electrophoresis/mass spectrometry. Analytical Chemistry, 65, 574A–584A. doi:10.1021/ac00061a717
- Takátsy, A., Böddi, K., Nagy, L., Nagy, G., Szabó, S., Markó, L., … Gjerde, D. (2009). Enrichment of Amadori products derived from the nonenzymatic glycation of proteins using microscale boronate affinity chromatography. Analytical Biochemistry, 393, 8–22. doi:10.1016/j.ab.2009.06.007
- Tarlov, M., & Choquette, S. (2016). NISTmAb, humanized IgG1k monoclonal antibody. Report of investigation. Naitonal Institute of Standards and Technology.
- Walsh, G., & Jefferis, R. (2006). Post-translational modifications in the context of therapeutic proteins. Nature Biotechnology, 24, 1241–1252. doi:10.1038/nbt1252
- Wang, X., Yi, L., Mukhitov, N., Schrell, A. M., Dhumpa, R., & Roper, M. G. (2015). Microfluidics-to-mass spectrometry: A review of coupling methods and applications. Journal of Chromatography A, 1382, 98–116. doi:10.1016/j.chroma.2014.10.039
- Wenzel, R. J., Matter, U., Schultheis, L., & Zenobi, R. (2005). Analysis of megadalton ions using cryodetection MALDI time-of-flight mass spectrometry. Analytical Chemistry, 77, 4329–4337. doi:10.1021/ac0482054
- Zhao, Y., Sun, L., Knierman, M. D., & Dovichi, N. J. (2016). Fast separation and analysis of reduced monoclonal antibodies with capillary zone electrophoresis coupled to mass spectrometry. Talanta, 148, 529–533. doi:10.1016/j.talanta.2015.11.020