
Abstract
The biggest nine well-known natural ponds in the highest elevations of Zagros thrust zone in the northeast of Erbil, Kurdistan region, Iraq, have been taken and synthesized with RS and GIS techniques to reveal the spatial and temporal distribution of the ponds, and to explore the sustainability of these ponds. ENVI 5.1 software was used to detect pond surface area and shapes in different seasons and for 33 years. RS was used to detect land surface temperature (LTS), but GIS was used for maps and calculations of pond area variation. Geology of the area is very complex; formations are different in genetics, age, thickness, and extensions. The regional tectonic forces highly deformed the succession and extension of the geologic formations. i.e. The forces that had made the mountains were very strongly affected the layers and the geologic formations, resulting in many types of folds, faults, overturning layers, thrusting, and many other highly deformed structures. Water-bearing formations are of restricted extensions due to the deformations, with limited and local productivity. The aquifers moved to face impermeable rocks or surface, discharging springs, ponds, and rivers. The ponds are sustaining permanently due to the following reasons: most of the ponds are located on semi-impermeable deposits, weather and LTS throughout the year are less than 25°C, high relative humidity and low evaporation, and they are recharging by direct groundwater and snowmelts.
PUBLIC INTEREST STATEMENT
Natural ponds are one of the important sources of fresh water and to sustaining environment. The natural ponds have unique aquatic life; they are a major station for the immigrant birds from south and north hemisphere, and the sources of fresh water for drinking, agriculture, sheep, and tourism. They can be exploited economically, but only limited activities can be seen due to rugged roads. This paper aims to find reasons behind the permanency of the ponds. We used remote sensing and geographic information system technology using satellite images to discover the status of the ponds during various seasons and years, and also to find land surface temperature. The permanency is because of the continuous supplying pond by surface and groundwater, low temperature of air and land surface, and the ponds water-resistant soils. The results are helping the economic and sustainable development plans, for water supply, tourism, agriculture, and the environment.
1. Introduction
Ponds, lakes, playas, rivers, and spring are forming in different geologic and geomorphologic ways or man-made (Meester et al., Citation2005). Ponds may form from remnants of glaciers, blocking rivers or springs or any other forces making the ground depressed, then filling with freshwater of rivers, rainfall, or snowmelt (Lowe-McConnell, Citation1975) or groundwater recharge (Duffy & Al-Hassan, Citation1988). Usually, they are small area of less than 1 ha to few hectares, and shallow of less than 1 m to few meters (Williams, Lane, Singha, & Haeni, Citation2001). The area is known by its natural ponds (Berm; in the local language) more than any areas in Kurdistan region, and rich in surface and groundwater resources. Average precipitation of rain and snowfalls are around 900 mm per year. Because of the moderate climate, especially in spring, summer and autumn, also for its beautiful landforms, and for availability of water resources, yearly hundreds of internal and external tourists visit the area. If they are scientifically exploited, the ponds may become one of the important entry and economic factors (Shapiro & Krollm, Citation2003) in the fields of tourism.
In this research, nine well-known ponds have been taken. These ponds are located in different elevations from 2502 m to 3233 m and vary in the surface areas, shapes, depths, and volume. The groundwater movement behaves and takes different ways in the study area depending on the rock types and soils. The physical properties of the land surface and the hydraulic properties of the water bearing formations are determining the flowing behavior on the land and in the geological formations.
The major problem in this research is lack of previous studies in the fields of hydrology, hydrogeology, and climatology, with limited studies on the geology of the area. There are no hydrologic or hydrogeological data of the surface and groundwater. So far, no meteorological station has installed in the area due to logistic and security reasons. Only one meteorological station has been installed in Choman since 1994 in the south of the study area. Sedimentology, stratigraphy, and structural geology helped to analyze the availability and behaviors of water on and under land surface.
Remote-sensing methods that are based on using the image data acquired by a sensor such as cameras, scanners or radar. Taking an RS approach means that information is derived from the image data that form a representation of the real word. A geographic information system (GIS) is a computer-based information system for capturing, modeling, storing, checking, and presenting data related to positions on Earth’s surface (Worboys, Citation2003). GIS can show many different kinds of data on one map. In this research, GIS is used for mapping and for the calculation of pond area variations.
The objective of this paper is to characterize the natural ponds in northwestern Erbil province in Iraqi Kurdistan, focusing on their special and temporal distribution, and changes of the morphology and hydrology of the ponds during the seasons and during last few decades. The paper is working to present the climatological, hydrological, and geological reasons controlling the sustainability of the natural ponds.
2. Study area
2.1. Location
The study area covers about 1923 km2 within the Kurdistan Region, Northern Iraq (Figure ). The area is located in the Erbil government. Center coordinates of Study area is as follows: latitude 36° 53′ 3ʺ and longitude 44° 44′ 1ʺ. The northernmost latitude is 37°11′40ʺ and the southernmost latitude is 36° 33′ 33ʺ; the western edge is east longitude 44° 24′ 12ʺ and the eastern edge is longitude 40° 42′ 50ʺ. The entire region includes 146 villages (most of the villages had ruined during Iraq–Iran war; they are not inhabited yet), three subdistricts, and one district (Figure ).
Figure 1. The study area.
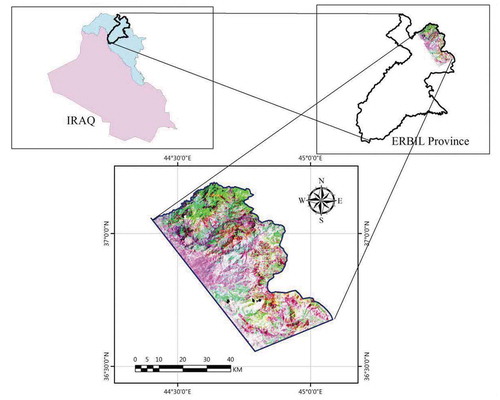
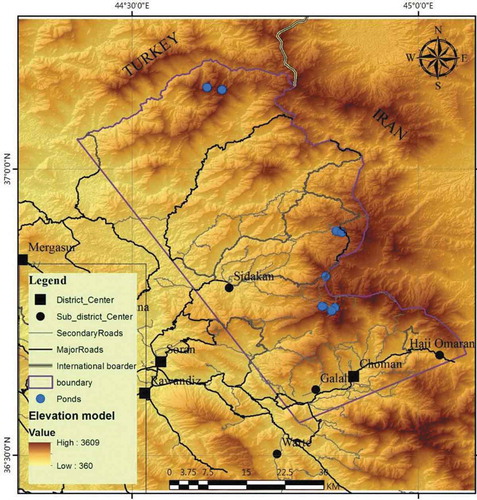
Figure 2. The study area; topography, watersheds, rives, districts, and sub-districts.
2.2. Climate
According to the Köppen classification, the study area has a Mediterranean climate, the type of Csb (mild temperate, dry, and warm summer) (Haddad & Mahmud, Citation2011). The climate is generally characterized by cold, snowy winter, and long, dry summer (Stevanovic & Markovic, Citation2003). The area is receiving the highest rate of precipitation and coldest temperature in winter in the Kurdistan region, but practically have no precipitation during summer (June to September), with average annual precipitation ranges from 900 to 1,000 mm/year, and evapotranspiration ranges from 1,000 to 1700 mm/year (UN-ESCWA and BGR (United Nations Economic and Social Commission for Western Asia; Bundesanstalt für Geowissenschaften und Rohstoffe), Citation2013). In the tops of mountain areas, the average annual precipitation might exceed 1,000 mm/year (Haddad & Mahmud, Citation2011).
According to AL-Khalide (Citation2016), depending on the data of the meteorological station in Choman, from 1994 to 2014, the average temperatures observed were as follows: the highest and lowest for the hottest month (July) were 38°C and 23°C, the highest and lowest for the coldest month (January) were 8°C and 1°C, and the annual highest and lowest were 17.24 oC and 8.2 oC. The average annual wind speed was 1.95 m/s, when the cold months have slowest wind speed.
3. Geological setting
The study area is located in the Arabian shelf basic tectonic unit (Henson, Citation1951). According to the tectonic zones and structural elements map of the unstable shelf units of Iraq modified by Buday and Jassim (Citation1984), the study area belongs to Zagros suture Zone of Iraq. Long time ago this area had a sea named by Neo-Tethys, later on during the Late Cretaceous and Mio-Pliocene, two plates the Iranian plate from north and northwest and the Arabian plate from south and southeast moved toward each other. Finally, the Iranian plate thrusted over the Arabian Plate during two different times of abduction and collision (Hamza & Isaac, Citation1971).
According to Twiss and Moores (Citation2007) and Jassim and Goff (Citation2006), the deformation of the Fold-thrust belts has marked fronts of the major orogeny that had made from colliding plates. The belt is highly affected by deferent tectonism leading to many displacements of different types of carbonate and clastic rocks (Buday & Jassim, Citation1984). In this thrust zone of Taurus-Zagros, the metamorphic and igneous rocks including ophiolites exposed to the surface, and also the sedimentary rocks of Paleozoic and Mesozoic are highly folded and faulted (Mitchell, Citation1976).
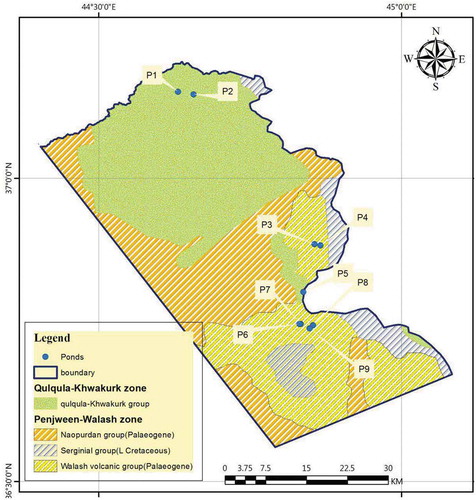
According to Mitchell (Citation1976) and Jassim and Goff (Citation2006), the Zagros suture zone, at which the study area is located on, is divided into three subzones: Qulqula-Khwarkurk zone, Penjwin-Walash zone, and Shlair zone (the study area does not include any part of Shlair zone) (Figure ). Zagros suture zone is the most complex and not enough studies have done on this tectonic zone in Iraq, especially about the tectonostratigraphic of the rock units (Zainy et al., Citation2017). The Qulqula-Khuwarkurk zone rocks (Late Cretaceous) consist of radiolarian chert, mudstone and limestone, and igneous rocks (Jassim & Goff, Citation2006). The dominant structures in this part are recumbent and isoclinal folds, thrusts, and reverse faults (Jassim & Goff, Citation2006). The Penjween-Walsh Subzone (Cretaceous) has more extension than the former subzone, and extends along the Iraq–Iran border. It also had thrusted over the Qulqula-Khwarkurk and Balambo-Tanjero Subzones. The main structures are thrust sheets (Jassim & Goff, Citation2006).
Figure 3. Study area; rivers, river basins, ponds, and topography.
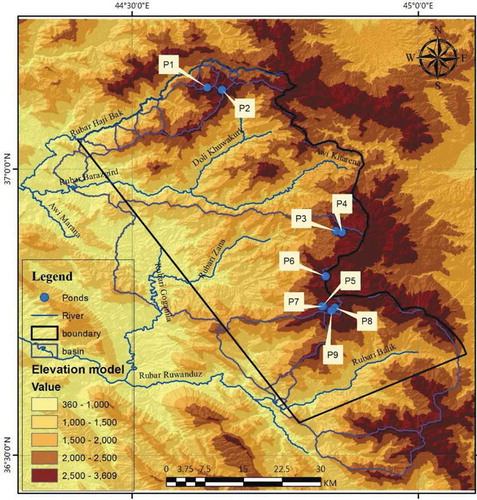
Figure 4. Geological map of the study area, NW part of the Zagros Suture (Jassim & Goff, Citation2006). Modified by the Authors.
4. Hydrogeologic setting
4.1. General hydrography and drainage basins
Most of the study area is composed of the three-main drainage basins, which they are draining or collecting water is from rainfall or from snowmelt during summer, and groundwater discharging in spring forms, to the river tributaries ending with perennial three rivers: Balak river, Goganila river, and Barazgir river (Figures and ). Ponds are one of the unique phenomena of water bodies in the study area. The dominant drainage pattern is dendritic drainage pattern; however, a parallel or rectangular system can also be seen because the rivers are following the faults and folds structure in the area.
4.2. The main hydrogeological zones in the study area are
4.2.1. Walash-Naopurdan hydrogeological zone
Most of the formations have larger thickness than its origin, due to the deformations representing in folds, reverse faults, and thrust faults. In the study area, the original thickness of Walash volcanic Group is around 1,000 m (Bolton, Citation1958b). Naopurdan (shaly) group in Choman and Sidekan area composed of around 2500–3000 m (Jassim & Goff, Citation2006). The zone is composed of different rock types. Their hydraulic properties highly vary in hydraulic conductivity and permeability. The upper layer-karstic-fissured locally confined aquifer limestone (Stevanovic & Markovic, Citation2003) of about 150 m’ thickness (Bolton, Citation1958b).
4.2.2. Khwakurk series hydrogeologic zone
According to Stevanovic and Markovic (Citation2003), the hydrogeological function of the zone is fissured aquifer of low-to-medium capacity in limestone, volcanic rocks, and conglomerates. The thickness of Khwakurk series is about several hundreds of meters (Jassim & Goff, Citation2006). The main rock types are acidic volcanic rocks (lava), agglomerates, chert, jasper, slates, and limestone (Cobbett, Citation1957).
5. Material and methods
5.1. 33-year period area variations
For variations monitoring of the ponds area during 33-year (1984 - 2016), the images of Landsat MSS and Landsat TM, ETM+ and also Landsat 8 OLI acquired on a 33-year period with 3-year intervals, were used, in December for all the years.
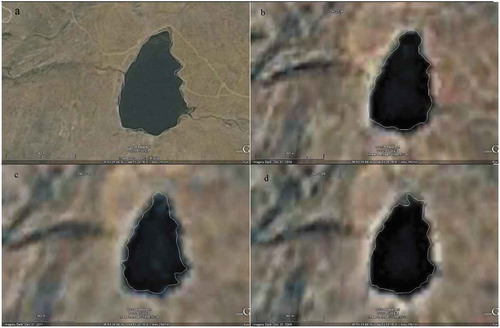
To investigate pond variations during the study period, the Historical Imagery tools were used in Google Earth software. This tools allows the user to change the Google Earth software base satellite image to previous times and the user will be able to monitor changes in the ground surface at different time periods. Using the aforementioned tools, the pond level was determined by a polygon and the areas of these polygons were compared for different time periods. Figure shows these changes for the four periods related to pond number (5).
Figure 5. The images of the pond No.5, in December of a: 2016, b: 2014, c: 2011, and d: 2005.
5.2. Monitoring seasonal ponds area
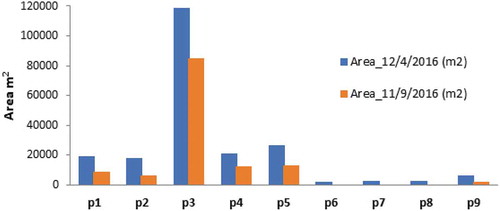
In this research, remote-sensing approach is also used for the annual and seasonal variation of the pond areas and shapes. For monitoring annual pond area variations, the images of Landsat 8 OLI acquired on 12 April 2016 and 11 September 2016 were used for digitizing and extracting ponds polygons, as shown in Figure .
Figure 6. The Land Surface Temperature (LST) obtained from Remote sensing temperature in the high elevations.
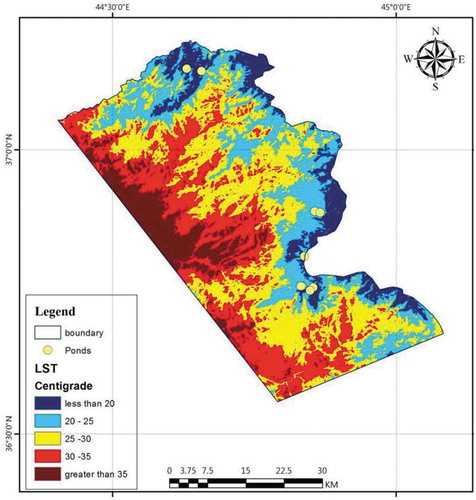
Figure 7. Sizes of the ponds during two different seasons in the year 2016.
5.3. Land surface temperature (LST)
Standard Landsat 8 data products given by the USGS EROS Center involve of quantized and calibrated scaled Digital Numbers (DN). It is representing multispectral image data acquired by both the Operational Land Imager (OLI) and Thermal Infrared Sensor (TIRS) (USGS Landsat User Services, Citation2016). LST is one of the most important variables measured by satellite remote-sensing system. These data are available from the newly operational Landsat 8 (TIRS) (Offer, Qin, Derimian, & Karnieli, Citation2014).
Land surface temperature (LST) is a key parameter in the physics of the earth surface through the process of energy and water exchange with the atmosphere, which plays an important role in a wide variety of scientific studies, such as ecology, hydrology, and global change studies (Xiaolei, Xulin, & Zhaocong, Citation2014). There are various methods to calculate LST. In this research, the method from the official USGS Webpage used. It is recommended to use Band 10 in quantitative analysis because Band 11 is significantly more contaminated by stray light than Band 10. This stage output is the LST map of study area based on centigrade unit (Figure ).
6. Results and discussions
The study of special and temporal distribution of the natural ponds in this paper is mainly dependent on the RS & GIS data and technique, and secondly on geology in order to compensate the lack of hydrologic and hydrogeological data. The ponds are supplying by surface water of drainage of rainfall and snowmelt, and the groundwater seepages and springs. Not only the nine natural ponds exist in the area, but tenth of smaller and seasonal ponds can be seen there. Most of the ponds are located in the north west of the study area in Rubari Zana watershed (Figure ). Structural geology and litho-stratigraphy are patterning the surface and groundwater flow and storage. The highly deformed rock layers due to various forces has uplifted and thrusted various rock types of various hydraulic properties to above or facing the rock types of different hydraulic properties, making the aquifer systems of composite and complex. The aquifers cut by the regional and local faults, forming many spring to discharging in different elevations, which some of them are recharging the ponds over the year, and the others are discharging in cliffs making waterfalls, or directly discharging into the rivers.
Generally, Walash volcanic Group is of low-to-medium production. It is of red mudstones, basic lava, radiolarites, limestone, conglomerates, siltstone, and sandstone in different thicknesses and extensions (Jassim & Goff, Citation2006), all these bed types are aquitards of low permeability and water production. Also, the Naopurdan (shaly) group has rock types vary from good productive aquifers to aquitards; the aquifer can be seen in its limestone, conglomerate, and fractured igneous (volcanic) rock types, but the thickest part in this group is shaly rock type, which, they representing aquitards. The group also has small beds of sandstones and conglomerates alternating with beds of mudstone and shale, giving chance to find small production springs in the area.
Generally the rocks of Khwakurk Hydrogeologic zone series are of low-to-medium water production, the only well production bed is the limestone but it is of limited thickness and extension that cannot supply high quantity of groundwater. The hydraulic conductivity of weathered volcanic group, agglomerates, and tills is less than 1.5 m/day, but for slates is more less (Todd, Citation2005). The infiltration capacities vary from high in the weathered fractured and karstic limestones, to medium in fractured volcanic and ophiolitic (igneous and metamorphic rocks), low in clastic shaly rocks, and low to medium in alluvial deposited clays. The ponds are located in the low infiltration capacity rock types and deposits, supplying by groundwater from aquifers in highest elevation.
The evaporation is low in the high elevation areas (above 2500 m) due to the cold-to-moderate temperature all over the year, and the high relative humidity in most of times of the year. The highest and lowest average relative humidity was 76.2% (February) and 48% (July) consequently, with the annual average of 62.66%. The relative humidity in this area shows much higher than of Erbil, when the average monthly was 69.4% (January) and 25% (July) (Qurtas, Citation2013). The LST map (Figure ) shows the highest elevation lands are the lowest temperature of land surfaces, and all the ponds are located in the low surface
For monitoring annual ponds area variations, the images of Landsat 8 OLI acquired. We can choose an image of any year; arbitrarily we have selected 2016, as it was available online in a good quality. The dates 12 April and 11 September 2016 were selected for digitizing and extracting ponds polygons. The first date is the most wet or the flood time, because groundwater, precipitation, and snow melts are of their highest flow to supply water to the ponds, with low evaporation because the temperature is low and the relative humidity is high. However, the second is the driest time of the year, because no precipitation exist. Snowmelt is very limited, and the groundwater are at their lowest levels (Figure ).
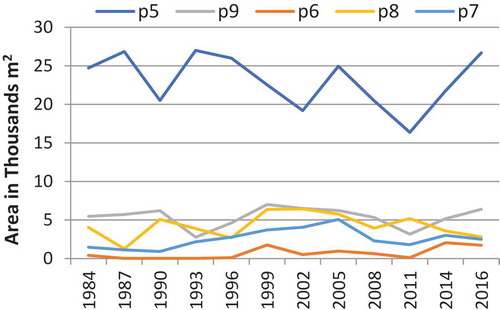
For the 33-year period, all the area variations have tabulated for all the ponds. The ponds geographically and geologically grouped in three groups: the first group (Figure )) is p1; p2 is the most north and the highest elevation of the area in the Khwakurk series with very low geologic information (Figure ). The second group (Figure )) is p3 (Berma Dindara); p4 are the two lowest elevation in the middle part of the area. The third group (Figure )) is p5, p6, p7, p8, and p9 located in the north pediments of Hasarost Mountain, with very complex geology. The annual area variation during the 33-year is almost horizontal trend. However, changes in area of each group are almost harmonic, but area change of each pond in a certain group is varying, owing to digitizing mistakes, weather conditions, time of concentration of the surface water flowing to the ponds, and hydraulic conductivities of the aquifer beds recharging the ponds.
Figure 8a. Pond 1 and 2 area of 33-year.
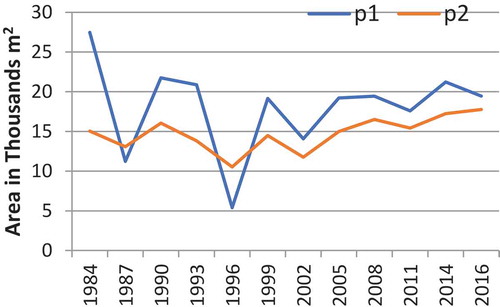
Figure 8b. Pond 3 and 4 area of 33-year.
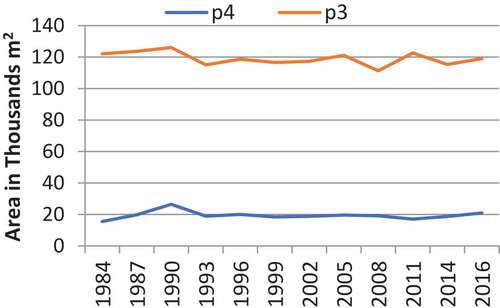
Figure 8c. Pond 4, 5, 6, 7, 8, and 9 area of 33-year.
7. Conclusions and recommendations
The analysis of sustainability and area changes in the natural ponds presented in this paper can be concluded as follows:
Groundwater movement is controlled by the geology of the area; the productive aquifers are moved tectonically, both regionally and locally to face of surface impermeable or semi-impermeable beds and soil. The depressions where previously formed are continuously filling with surface and groundwater. The aquifers supplying water to the ponds are of low-to-medium productivity. Ponds receive water from the first-order rivers flowing to the ponds, or directly from springs, but during the dry seasons groundwater is supplying the ponds.
Temperature is playing a great role in the continuity of the ponds. The air temperature during all the seasons of the year is low to moderate. Land surface temperature (LST) in the hottest months is less than 25°C. The relative humidity is high and evaporation is low in the area.
Seasonally and annually the surface area and the shapes of the ponds are changing, but the general trend of long-period change is almost constant. Most of the ponds are sustaining permanently, and some drying for a short period.
If scientifically the tourism in the area is planned for ecotourism activities, they could attract interior and exterior tourists to the nature of the area, which, most of the natural, biological, and social factors are available. The ponds can be an important economic factor for the region.
Detailed research on each pond individually in the fields of hydrology, geology, and ecosystem is needed to show the detail of chemistry, physic, and biology of the ponds water. And also we recommend to have researches on how ecotourism in the area can become a new source of income for the local people.
Additional information
Funding
Notes on contributors
Sherwan Sharif Qurtas
Sherwan Sharif Qurtas is a senior lecturer at the Civil Engineering Department in the Faculty of Engineering, University of Soran, Iraq. He is specialized in Hydrogeology. He received his PhD degree from University of Salahadding, Department of Geology, in Erbil, Iraq. His research interests include surface and groundwater and their interactions to estimate the recharge from surface and rainfall water and how much the pollutants are entering the water and minimizing the quantity of clean water, which it helps plan for groundwater replenishment and environmental protection. This helps many linked situation in various fields. He continues his research to show the relation between the lithology and the pathways of the formations bearing and transmitting groundwater and the hydrochemistry of springs water. It helps a precise understanding to the water quality in the region and as a regional base for the hydrogechemistry.
References
- AL-Khalide, N. M. (2016). Wadi choman basin morphometric stadies. AL-Mostansiriyah Journal for Arab and International Studies, (55), 288–327.
- Bolton, C. M. G. (1958b). Geological map-Kurdistan Series, scal 1:100,000 Sheet K6 Halabja (Manuscript report No. 278). Baghdad: GEOSURV.
- Buday, T., & Jassim, S. (1984). Tectonic map of Iraq, DG of geological survey and mineral investigation. Baghdad: Cartography Department.
- Cobbett, G. P. R. (1957). Geology of Kani Rash area (Manuscript report No. 270). Baghdad: GEOSURV.
- Duffy, C. J., & Al-Hassan, S. (1988). Ground-water circulation in closed desert basins” topographic scaling and climatic forcing. Water Resources Research, 24, 1675–1688. doi:10.1029/WR024i010p01675
- Haddad, H. Y., & Mahmud, K. W. (2011). Atlas of Erbil governorate (Second ed.). Erbil, Iraq: Salahaddin University and Soran University, Geography Department.
- Hamza, N. M., & Isaac, E. A. (1971). Geology survey of the area between Beanvi and Greater Zab river (Geological survey of Iraq, Internal report). Baghdad.
- Henson, F. (1951). Oil occurrences in relation to regional geology of the middle east. Tulsa Geological Society Digest, 19, 72–81.
- Jassim, S. Z., & Goff, J. C. (2006). Geology of Iraq, Dolin, Prague and Moravian Museum, Czech Republic, Brno. (pp. 341).
- Lowe-McConnell, R. H. (1975). Fish communities in tropical freshwaters. Their distribution, ecology and evolution (pp. 337). N. Y.: Longman Inc.
- Meester, L. D. S., Stoks, D. R., Louette, G., Meutter, F. V. D., Bie, T. D., Michels, E., & Brendonck, L. (2005). Ponds and pools as model systems in conservation biology, ecology and evolutionary biology. Aquatic Conservation, Marine and Freshwater Ecosystems, 15, 715–725. doi:10.1002/aqc.748
- Mitchell, A. H. G. (1976). Tectonic settings for emplacement of subduction-related magmas and associated mineral deposits. In Special paper, Geological Association of Canada (Vol. 14, pp. 3–21). Canada: Metallogeny and plate tectonics.
- Offer, R., Qin, Z., Derimian, Y., & Karnieli, A. (2014). Derivation of land surface temperature for Landsat-8 TIRS using a split window algorithm. Sensor, 14(4), 5769: 5768–5780.
- Qurtas, S. S. (2013). Groundwater evaluation and management using mathematical models for Shamamik Basin (pp. 15: 167). Erbil: Kurdistan Region – Iraq, college of science, Salahaddin University.
- Shapiro, L., & Krollm, H. (2003). Estimates of select economic values of new Hampshire lakes, rivers, streams and ponds, phase II report (Vol. 4, p. 45). USA: New Hampshire Lakes Association.
- Stevanovic, Z., & Markovic, M. (2003). Hydrogeology of Northern Iraq, Climate, Hydrology, Geomorphology & Geology (Vol. 1, 2nd ed.). FAO – Roma, Rome, Italy.
- Todd, D. K. (2005). Ground Water Hydrology (3rd ed., pp. 638). New York and London: John Wiley and Sons, Inc. Toppan printing company (Ltd.).
- Twiss, R. J., & Moores, E. M. (2007). Structural geology (2nd ed.). New York, USA: W. H. freeman and company.
- UN-ESCWA and BGR (United Nations Economic and Social Commission for Western Asia; Bundesanstalt für Geowissenschaften und Rohstoffe). (2013). Inventory of shared water resources in Western Asia. Beirut. https://waterinventory.org/sites/waterinventory.org/files/00-inventory-of-shared-water-resources-in-western-asia-web.pdf.
- USGS Landsat User Services (2016). Landsat-8: Data User Handbook 8. Using the USGS Landsat 8 Product_Landsat Missions. https://landsat.usgs.gov/sites/default/files/documents/Landsat8DataUsersHandbook.pdf
- Williams, J. H., Lane, J. W., Singha, K., & Haeni, F. P. (2001). Application of advanced geophysical logging methods in the characterization of a fractured-sedimentary bedrock aquifer, Ventura County, California (U.S. Geological Survey Water-Resources Investigations Report, 00–4083). p. 28.
- Worboys, M. F., & Duckham, M. (2003). Geographic Information Systems (GIS): A computer science perspective, Taylor & Francis e-library (2nd ed., pp. 1:341). CRC Press, Boca Raton, Florida.
- Xiaolei, Y., Xulin, G., & Zhaocong, W. (2014). Land surface temperature retrieval from Landsat 8 TIRS—Comparison between radiative transfer equation-based method, split window algorithm and single channel method. Journal of Remote Sensing, 6(10), 9830: 9829–9852. Switzerland.
- Zainy, M. T., Al-Ansari, N., Bauer, T., & Ask, M. (2017). The tectonic and structural classifications of the western part of the zagros fold and thrust belt, North Iraq, review and discussion. Journal of Earth Sciences and Geotechnical Engineering, 7(2), 71–89.