
Abstract
Evidence of strike-slip deformation in the Inkisi Formation was overlooked for a long time. After controversial characterization, this paper demonstrates that the Inkisi Formation underwent at least two phases of strike-slip deformation accompanied with a compressive component, which created faults that help determine paleostress. Field observations permitted to characterize NW–SE trends sinistral strike-slip faults systems and NE–SW oriented dextral strike-slip faults systems. The strike-slip faults are associated with flower structures in profile view and with damage zones along tips, wall and linking zones in plan view. Both faults systems (sinistral and dextral) initiated from joints, which show similar orientations with faults. Many kinematic indicators of slip sense or extension have enabled to determine the stress stages and the evolution of the structures. The first tectonic phase has a horizontal maximum principal compressive stress σ1 of 319 ± 21,1/03, which probably have a potential correlation with far-field stress propagation which occurs during the subduction of Gondwana south margin in the Permo-Trias. The second tectonic phase with a slightly inclined maximum principal compressive stress σ1 of 264°± 22,3/12 potentially results from the intraplate stress propagation, due to the opening of the Southern Atlantic Ocean.
PUBLIC INTEREST STATEMENT
The study of the tectonic structures that affected the Inkisi sandstone of Paleozoic age, in the southern Brazzaville has a paramount importance. A large part of the city is built on these sandstones that carry fractures that reach the topographic surface. This constitutes a large danger to the buildings and the stability of the geotechnical structures. This study can also be a good guideline in groundwater exploration.
1. Introduction
Characterization of strike-slip deformation has increased worldwide, as their fault zone characteristics has been proven to have a significant control on fluid flow and earthquakes initiation and termination. These studies evolved with proposition of several examples and models of fault growth and propagation (Kim et al., Citation2000; Martel, Citation1990; Olson & Pollard, Citation1991; Pollard & Aydin, Citation1988; Segall & Pollard, Citation1983). These models include characterization of different types of structures that occur (Christie-Blick & Biddle, Citation1985; Kim, Peacock, & Sanderson, Citation2004; Slyverster, Citation1988) both in plan view and in cross-section around strike-slip faults. Particularly, identification of damage zones structures around strike-slip faults has been subject to classification by Kim and al. (Citation2004). This classification, proven to be reliable, has been applied to the less studied Inkisi Formation in Republic of Congo in order to identify sets of fractures that affect this Formation.
Previous studies on the Inkisi Formation have first revealed two sets of orthogonal non-described fractures (Dadet, Citation1969). Then these fractures were subject of two controversial considerations according to their characterization. They were first considered as faults by Cornet and Pourret (Citation1982) without specifying their classification types, and then reconsidered as synsedimentary hydroplastic faults by Alvarez, Maurin, and Vicat (Citation1995). The latter characterization implies that the Inkisi Formation has not undergone a tectonic event. Nonetheless, in Angola, the Inkisi Formation is overlain by Karoo deposits Formation of Permian age (Oesterlen, Citation1976), which are widespread in the southern Sahara Desert of Africa (Tack et al., Citation2001), but Karoo deposits are deformed in most part of Africa in the Congo basin and in rift segments of Tanganyika–Rukwa–Malawi (Catuneanu et al., Citation2005; Catuneanu, Citation2004; Daly, Lawrence, Dirmu-Tshiband, & Matouana, Citation1992; Daly, Lawrence, Kimun’a, & Binga, Citation1991; Delvaux, Citation2001a, Citation2001b; Delvaux, Kervyn, Macheyeki, & Temu, Citation2012). Thus, it necessarily implies that the underlying unit of Inkisi Formation would be deformed also.
This paper firstly presents a characterization of joints and strike-slip faults by description of different types of damage zones around faults according to the classification of Kim et al. (Citation2004) and their profile view description. Secondly, we present the different fracture systems and determine paleostress with the Win-Tensor program, using the stress inversion method (Delvaux, Citation1993). At the end, we prove that strike-slip faults nucleate from joints.
2. Geological sitting
The Inkisi Formation extends from Republic of Congo to Angola via Democratic Republic of Congo (Figure ). It outcrops in the southern part of Brazzville along the Congo river. It overlays the Congo craton, which is of Archean age, where it is separated by an angular unconformity with underlying units of West Congolian Group, a foreland part of the Panafrican West Congo Orogen (from 625Ma to 490Ma) (Dadet, Citation1969; Alkmim et al., Citation2006).
Figure 1. Location of the studied area (black square) and the distribution of the Inkisi Formation over the Central Africa. Redwrawn after Dadet (Citation1969).
The Inkisi Formation is also part of the “redbeds” sequence in the Congo basin of 1000 m of thickness, where it is correlated with Banalia Group in the Lindi Basin in RDC (Figure ) and the Banio group in Central Africa Republic (Delpomdor & Préat Citation2015; Kadima et al., Citation2011; Tack et al., Citation2008). These three correlated units show arkoses of same types of sedimentary structures.
Figure 2. Lithostratigraphic synthesis of Neoproterozoic to Early Paleozoic period of geological units that overlies the Congo Craton, in Republic of Congo. Compiled after Dadet (Citation1969), Dianzenza-Ndefi (Citation1983), Boudzoumou, (Citation1986), Frimmel et al. (Citation2006), Poidevin (Citation2007), Straathof (Citation2011), Tait et al. (Citation2011), Mickala et al. (Citation2014).
The Inkisi Formation is considered as an individual lithological unit unrelated to Pan-African orogeny (Tack, Wingate, Liégeois, Fernandez-Alonso, & Deblond, Citation2001). The age of the Inkisi Formation is not well constrained. However, it is suggested of pre-Karoo age (320Ma) (Tack et al., Citation2008), because in Angola the Inkisi Formation is overlain by Karoo deposits of Permian age (Oesterlen, Citation1979). Affaton et al. (Citation2016) in Congo Brazzaville suggested a deposition U-Pb age, obtained through detrital zircon between 500 and 800 Ma. However, in Democratic Republic of Congo, Frimmel et al. (Citation2006) suggested U-Pb ages between 558 and 851 Ma. Therefore, the Inkisi Formation seems to be of earlier Paleozoic age.
Alvarez et al. (Citation1995) after a thorough facies description concluded that the Inkisi Formation corresponds to a large deltaic body, but these assertions still debatable as the pro-delta is currently missing in the sequence. However, a well-defined subdivision of Inkisi Formation which agrees with our field observations was done by Boudzoumou (Citation1986). He suggested that the Inkisi Formation is of fluvial origin, and it is made up of repeatedly three terms: (i) coarse sandstones associated with quartzite elliptical pebbles, which sometimes show in its lower part conglomerates; (ii) coarse sandstone with trough cross-bedding; and (iii) alternating fine sandstones to very fine sandstone with horizontal laminations.
The studied area is located in south west of Brazzaville, in the Republic of Congo (Figure ). Fractures have been recorded in the artisanal quarries of Brossete and Kombé along the Congo river.
3. Methodology
The methodology was developed from literature on features of joints and strike-slip faults. The collection of data were done on the field. Then data analyses were computed in programs.
3.1. Field data collection
The collection proceeds first by searching of geological structures. Once found, geographic coordinate of the station was taken. Then we identified faults and joints: firstly by a geometric analysis, by recording their orientation, their architecture, their connections and secondly by a kinematic analysis by looking offsets features (pebbles, etc.), secondary structures along the traces of structures and by looking for slip sense of slip indicators on the surfaces of faults. After a characterization, a sketch of these structures was produced and recorded measurements of structures (by Topochaix compass) were put in the sketch. At the end, photographs of field evidence on identified structures were taken and their number reported on the sketch.
3.2. Data analysis
Data were first recorded in a summary table of measurements with Excel program. Then we produced histograms from strikes measurements. The Win-Tensor program, version: 5.8.8 was used to produce rose diagrams, stereograms and to determine paleostress (Delvaux, Citation1993). The determination of paleostress from the Win-Tensor program used the stress inversion method (Angelier, Citation1994, Citation1989) which complies with the procedure described in Delvaux and Sperner (Citation2003). The stress inversion method helps reconstitute four parameters of the reduced tensors: σ1; σ2; σ3 (where σ1 ≥ σ2 ≥ σ3) and the ratio R = (σ2 − σ3)/(σ1 − σ3) (where 0 < R < 1), which determine the intensity of σ2 relative to σ1; and σ3 . The program determines the index regime called R′ based on the ratio R and on a vertical continuous scale from 0 (radial extension) to 3 (constriction), with R′ = R, for an extension regime (0 to 1); R′ = 2 − R for a strike-slip regime (1 to 2); R′ = 2 + R for a thrust regime (2 to 3). The reduced tensor is first estimated by Right dihedral method. They are more precisely determined with an iterative rotational stress optimization. The program assesses the quality of the obtained tensors from two qualities ranking parameter QR. The first, the QRw, which is a quality rank defined as in World Stress Map project, it ranges from A (best); B (good), C (medium), D (poor) to E (worst). It is determined in function of threshold values of series of criteria (Delvaux et Sperner, Citation2003). The second, the QRt, is a quality rank of diversity of faults orientation and the found slip lineation. The program uses several criteria to evaluate the ranking quality, as well described in Delvaux et Sperner (Citation2003).
Data were input manually in the program, as characterized in the field, as fault with slip line, shear plane with tension facture, shear fractures and joints (see Table ). Additionally, we carry out a grouping into primary subsets, according to field criteria (cross-cutting principle, relative age, reactivation, neoformation, etc.). Furthermore, after processing, the program suggests an optional data separation into secondary subsets of homogeneous orientation of initially chosen subsets.
4. Field data results and faults patterns
4.1. Strike-slip faults
Strike-slip faults form two major sets of fractures that cross cut each other at varying angle (from acute to almost orthogonal). The first set is made up of sinistral strike-slip faults and has strike orientation that ranges from 335° to 019° (Figure ). The second set is made up of dextral strike-slip faults and has strike orientation ranging from 020° to 065° (Figure ). Both sets show a steep dip, ranging from 70° to 90° and their major line plunge at to 5° (Figure ). The polished surfaces of faults are generally filled with palygorskite and calcite (Figure ), accretion steps of calcites (Figure ) and show within some surfaces crystal fiber lineation (Figure ). Through their traces, they showed many kinematic indicators that help inferred the sense of movement, as displaced pebbles (Figure ), pull-apart structures, horstailing splays, etc.
Figure 3. Rose diagrams and stereograms of sinistral strike-slip faults. Three classes of orientations Z1a, Z1b, and Z1c were distinguished.
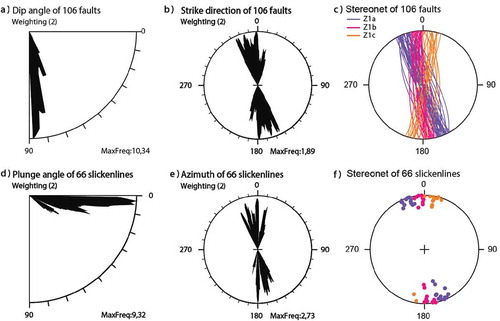
Figure 4. Rose diagrams and stereograms of dextral strike-slip faults. Three classes of orientations Z2a, Z2b, and Z2c were distinguished.
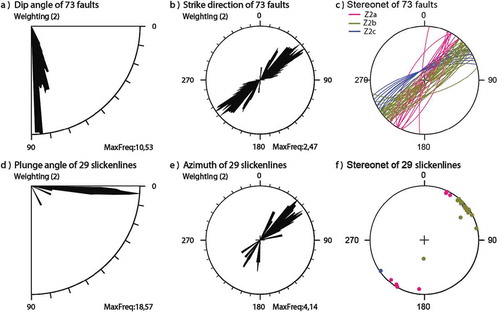
Figure 5. Strike-slip fault surfaces and kinematic indicators. (A) Slickensides highlighted by accretion steps of calcite, or (B) crystal fiber stretching. (C) A left-step sinistral strike-slip with palygorskite and overprint slickensides in its surface show details in (D).
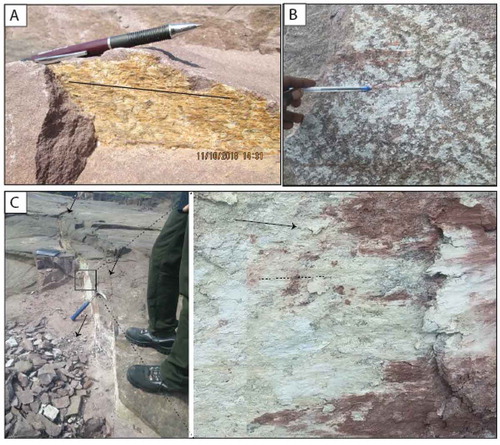
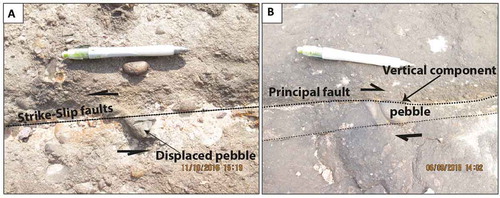
Figure 6. Displaced pebbles within strike-slip faults. (A) Sinistral lateral strike-slip faults with 2 cm of displacement. (B) Dextral strike-slip faults with a small vertical component.
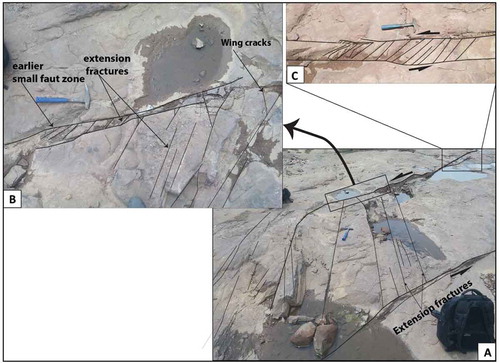
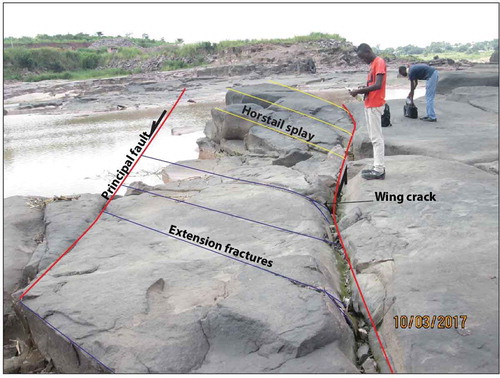
Both strike-slip faults show a progression from single small faults with little displacement (7 mm) to faults zones of moderate displacement (up to 12 cm) and length (up to 400 m). In horizontal plan view, both sets of strike-slip faults (dextral and sinistral) show subparallel faults which relayed each other, associated with bends and characteristic feature of fault damage zones around their tips, linking zones and wedge zones. In cross-section view, both sets show negative and positive flower structures; however, sinistral strike-slip faults showed frequently positive flower structures, while dextral strike-slip faults showed negative structures flowers numerously. Fault damage structures are well expressed by sinistral strike-slip faults, which form compound strike-slip fault zones (Figure ), as described by Martel (Citation1990). Compound strike-slip faults are presumed to accommodate larger displacement than other faults (Martel, Citation1990). Figure shows the relationship of two set fractures. The sinistral strike-slip faults are crossed-cut and displaced by the dextral strike-slip faults. More than five zones of this type were found with a displacement ranging between 2cm and 5cm.
Figure 7. Compound fault zone associated with small fault zone. (A) Compound fault zone with extension fractures. (B) Small fault zone within boundaries of compound fault zone and extension fractures showing wing crack terminations that overprint small fault zone. (C) Another small fault zone with extensions fractures at the tip of the compound fault zone.
4.1.1. Tip zones damage structures
4.1.1.1. Horsetail splays and en-echelon fractures
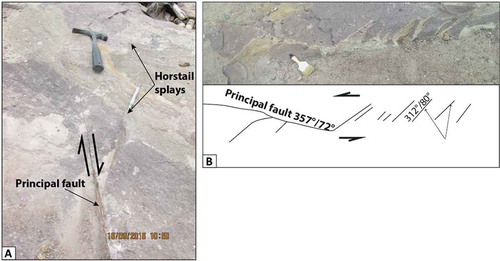
Faults display in some places horsetail fractures at their tips (Figure ). The angles between the main faults and the horsetail fractures range from 20° to 45°. The local orientation of the maximum compressive stress has been assumed to be parallel to horsetail fractures (320° for sinistral fault). Some horsetail fractures show a normal slip component within their traces, a change in their orientation, and wing cracks development at their intersection with the main fault. Wing cracks development within horsetail fractures tips imply that they formed from mode I loading.
Figure 8. Cross-cutting relationship between sinistral strike-slip fault and dextral strike-slip fault. The sinistral strike-slip fault is displaced by dextral strike-slip fault over 2 cm of offset. (A) Cross-cutting relationship. (B) Sketch of cross-cutting relationship of sinistral fault (Z1) and dextral fault (Z2) in A. (C) and (D) Corrugation (b) and crushed rock (a) within the surface of Z2.
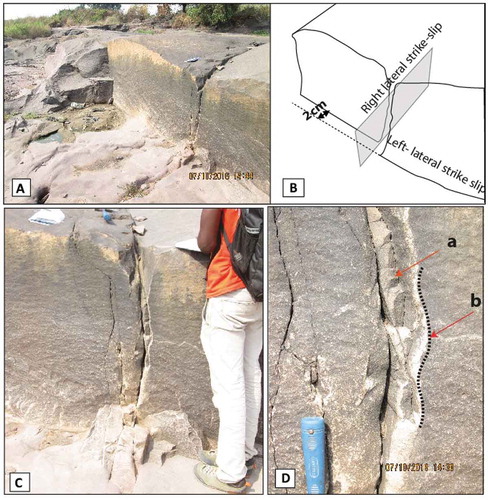
Figure 9. (A): Horsetail splays at 190/85 oriented dextral strike-slip fault tip. (B) En-echelon fractures at sinistral strike-slip fault tip.
En-echelon fractures (Figure ) can be associated with extensions fractures. They are assumed to propagate away from the fault terminations and they show steep dip.
4.1.2. Linking damage zones
They are dominated by extension fractures, dilation jogs and pull-apart structures.
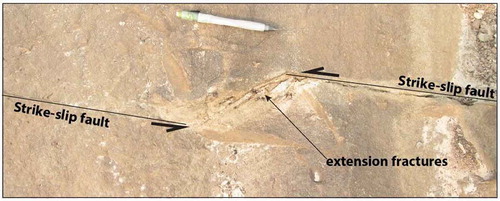
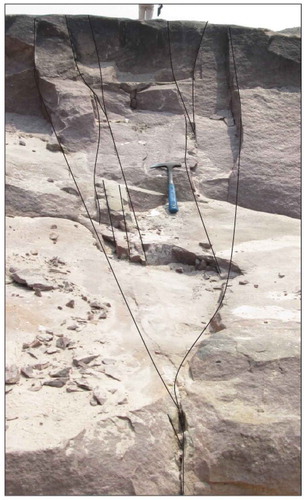
4.1.2.1. Extension fractures
They dominantly link faults (Figure ) and are assumed to develop parallel to the maximum compressive stress σ1. The angles between main faults and extensions fractures range from 40 to 55°. Some of them of wing crack at their intersection with the principal fault. A principal fault might be associated both with extensions fractures and horsetail fractures. The identification of extensions fractures is supported by the presence of wing cracks at the intersection with main fault and additionally, by range of their intersection angle (40° to 55°) with main faults, as described by Hancock (Citation1985). They constitute the type of structures most frequently observed in the field and help greatly to determine paleostress.
Figure 10. Extension fractures around linking zone of a sinistral strike-slip fault, observed in horizontal plan view.
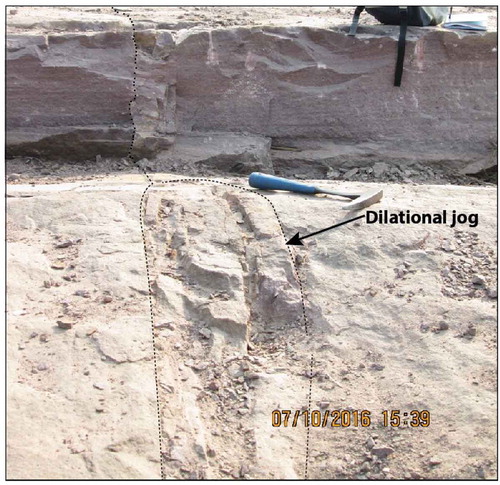
4.1.2.2. Dilation jogs
They appear most of time within the fault traces (Figure ). They often show lens shape with crushed material and duplex.
Figure 11. Dilation jog around strike-slip fault.
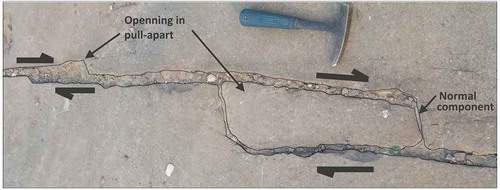
4.1.2.3. Pull-apart
Pull-apart structures (Figure ) are extension fractures that opened up between two linked faults due to increasing slip in fault segment (Kim et al., Citation2004). They show a normal component in their interior, suggesting an opening. The geometric shape is controlled by boundary fractures.
Figure 12. Pull-apart structure associated with a dextral strike-slip fault.
4.1.3. Wall damage zone
Wall damage zone as linking damage has sometimes quite similar architecture. We find extension fractures intersecting two faults traces as in linking damage zone, but here no relay zones, only two bounding strike-slip faults. Extension fractures show also wing crack at their intersection with the main fault (Figure ).
Figure 13. Strike-slip fault showing both a wall damage zone with extension fractures and horsetail splay fractures at its tips. Note wing cracks on extension fractures.
4.1.4. Flower structures
They have been first noticed as lens shaped in plan view, and then observed in profile view at least two or three plans of fractures that bifurcate from one steep fault. Bifurcated planes delimit a space which frequently comprises lots of fractures. Most of the fractures within the space show characteristics of negative flower structures (Figure ) with normal-slip component. Flower structures have same orientation relation to strikes of both strike-slip faults systems.
Figure 14. Flower structures associated with a dextral strike-slip faults.
4.2. Joints
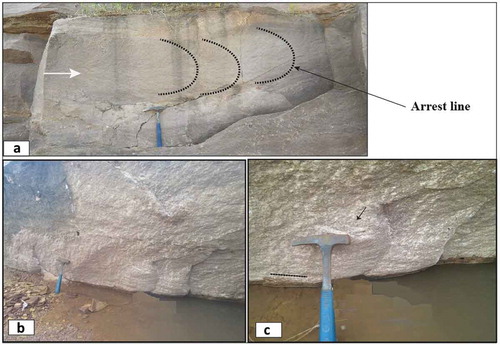
Joints show parallel orientation with strike-slip faults (Figure ). They are predominantly steeply dipping (Figure ). Therefore, they were subdivided into two sets: one parallel to sinistral strike-slip faults (Figure ) and the other parallel to dextral strike-slip (Figure ). Figures and 1 show rose diagrams and stereograms that support this evidence. At least 16% of joints were found with well-marked plumose structures (Figures , 1). Most plumose structures display straight plume axis, and seemed to originate from pebbles or micro-cracks in the rock. Some plumose structures show fine hackles to more noticeable ones within the joint planes. Apart from straight plumes, plumes with many arrest lines have been found (Figure ). Some plumose structures have been found with slickensides overprinting them (Figure. ) as it was described by Barton (Citation1983) and Segall and Pollard (Citation1983). This evidence indicates at least two fault phases of deformation (Pollard & Aydin, Citation1988). Plumose joints with many arrest lines have also through their surface decimetric veins of calcite.
Figure 15. Rose diagrams and stereograms of joints without plumose structures (a,b,c). Distinction of five subsets (a,b,c,d,e,f).

Figure 16. Rose diagrams and stereograms of joints with plumes structures (a,b,c). Distinction of different subsets (d,e,f).
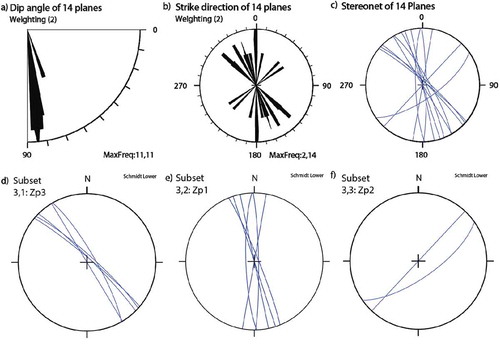
Figure 17. Plumose structures with weakly marked hackle. (B) Sketch of the photo, with the grey arrow showing the propagation direction.
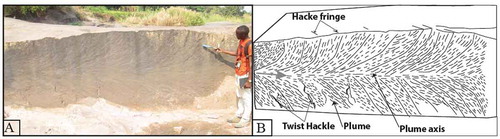
Figure 18. (a) Plumose structures with many arrest lines. (b and c) Well-marked twist hackles with overprinted slickensides.
5. Results of stress inversion
Measurements were grouped into four (04) subsets: (1) subset of sinistral strike-slip (Z1); (2) subset of dextral strike-slip (Z2); (3) subset of parallel joints to Z1; and (4) subset of parallel joints to Z2. From the four subsets, four stages of stress have been found. Chronologically these stages have to be grouped into two tectonic stress stages, because field observations suggested the evolution of joints into faults:
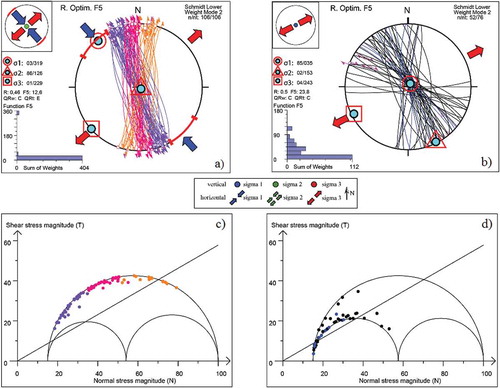
- Stress stage 1 (Figure ): This is the oldest, represented by 182 fractures (106 faults and 76 joints), with 66 striated planes of faults. It started with an extension regime (R′ = 0,5) (Figure ) with NE–SW principal direction of extension, forming the majority of joints with plumes, the quality rank QRw and QRt of this stage are medium. The change in orientation of joints is probably due to rock defaults (Davis, Reynolds & Kluth, Citation2011). The passage from extension regime to strike-slip regime (Figure ) was achieved through a rotation of the maximum compressive stress. The strike-slip regime, slightly compressional (R′ = 1,54) has a maximum compressive stress oriented NW-SW (319 ± 21,1/03). The quality rank QRw is medium and the QRt is poor, therefore the solution is not perfectly constrained, but the orientation of the maximum compressive stress fits the range of the solution of tσ1 inferred on the field from extension fractures or horsetails fractures. The Mohr diagram show that some NW–SE to N–S faults have experienced an intense shear stress while others NNE-SSW faults have experienced an intense normal stress relative to the shear stress.
Figure 19. Fault slip data and stress inversion results. Lower-hemisphere Schmidt stereo plot of the fault-slip data subsets and corresponding stress tensor. (a) Subset 1 data (Z1) results. (b) Subset 3 (joints) data results. (c) Mohr diagram plots of subset 1 data. (d) Mohr diagram plots of subset 3 data.
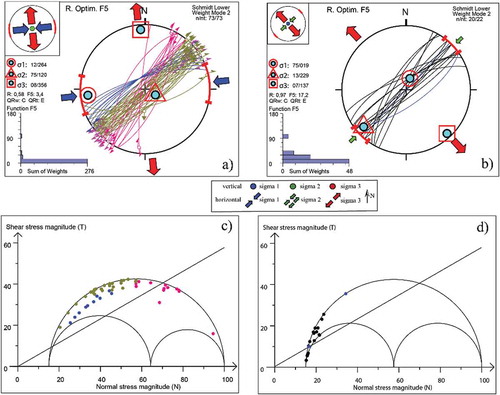
- Stress stage 2 (Figure ): This last stage is defined by 95 fractures (73 faults and 22 joints), with 29 striated planes of faults. It started with an extension regime (Figure ) to slightly strike-slip (R′ = 1,42) with a principal direction of extension oriented NW-SW of average orientation. Then, it evolved into a strike-slip regime to slightly compressional with a principal stress oriented W–E (264 ± 22,3/12) (Figure ). The Mohr diagram of both faults and joints confirms that evolution, of strike slip from joint.
Figure 20. Fault slip data and stress inversion results. Lower-hemisphere Schmidt stereo plot of the fault-slip data subsets and corresponding stress tensor. (a) Subset 2 data (Z2) results. (b) Subset 4 (joints) data results. (c) Subset 2 data plot in Mohr diagram. (d) Subset 4 data in Mohr diagram.
6. Discussion
Our field observations show detail strike-slip faults and joints structures that prove that the Inkisi Formation underwent a strike-slip regime. Strike-slip faults show a large range of minor structures across their traces and their profiles, which go from horsetail fractures, extensional fractures in faults linking zones, dilation jogs, wing cracks, en-echelon fractures at their tips and flowers structures (Figure ).
Figure 21. Schematic diagram which idealizes architecture of structures in Inkisi Formation. J1: joints parallel to Z1; J2: joints parallel to Z2; FS: Flower structures; Hr: horsetail splays; e-f: en-echelon fracture.
Rose diagrams and stereograms reveal that faults and joints are organized into two systems of fractures: the first one shows NW–SE to NNE–SSW trends and comprises sinistral faults and joints, the second one shows NE–SW trends and comprises dextral faults and joints too.
Observations indicate a close link between development of joints and strike-slip faults. The presence of plume structures with many arrest lines and calcite veins within their planes suggests that pore fluid pressure probably plays a role in the formation of these fractures (Bons, Elburg, & Gomez-Rivas, Citation2012; Secor, Citation1965; Tullis and Tullis J., Citation1986). Additionally, joints have parallel orientation with faults. On the other hand, some plume joints have overprinted slickensides on their surfaces. Moreover, faults show crystal fiber lineation (striation) and also accretion steps of calcite. This clearly indicates that strike-slip faults nucleated from joints. The same findings have been made by Segall and Pollard (Citation1983), Kim et al. (Citation2004), and Barton (Citation1983). Thus, the two stress stages found from stress inversions method support this field evidence. Both stages of tectonic strike-slip grew from pre-existing joints and some strike-slip faults form small faults with little displacement and others evolved into fault zones and compound fault zones as described in Martel (Citation1990).
Strike-slip faults show clear examples of damage zones structures through their traces as described by Kim et al. (Citation2004) in the classification of fault damage zones. The assumed compressive principal stress on field from horsetail fractures, en-echelon fractures, and extension fractures of N320° supports our determined maximum principal compressive paleostress.
The early stress stage is broadly constrained, because few conjugates faults planes of that stage have been observed on the field. However, these results place a range of limits for the reduced tensor solution with a maximum compressive stress of 319°± 21,1/03. Although uncertainties are quite large (±21,1°), the orientation of the maximum compressive stress obtained on the field from extension fractures gives an orientation that fits in the interval determine from Win-Tensor. This stress stage has a potential correlation with stresses that propagate from the southern subduction margin of Gondwana at the Permo-Trias which formed the Cap Fold Belt, currently preserved in South Africa. This affirmation is supported by two principal arguments. The first point is that the Inkisi Formation is overlain by Karoo deposits in Angola (Tack et al., Citation2001), and the Karoo deposits have been deformed in most part of Africa by the subduction that affected the southern margin of Gondwana at Permo-Trias (Catuneanu et al., Citation2005). Therefore, the Inkisi Formation might have been affected by this tectonic event. More importantly, the reconstruction of paleostress by Delvaux et al. (Citation2012), in the Tanganyika-Rukwa-Malawi (TRM) rift segment in western Tanzania, located the Karoo deposits, gives three stress stages. The second stage which is well constrained, obtained from Karoo deposits of Permian age, called Namwele-Mkolomo coal field, has caused a dextral strike-slip tectonic associated with a transpression that has a subparallel orientation with our first stage (Figure ). Nonetheless, the stress obtained in TRM is oriented NNW–SSE and cause dextral kinematic, while our orientation is NW–SE and causes sinistral kinematic. This change in kinematic sense might probably be due to a rotation of stress counterclockwise during the collision, as the stress propagated over 2,000 km in the crust (Daly et al., Citation1992, Citation1991). The second point is that in Democratic Republic of Congo, in the Congo basin stratigraphic unit, the Banalia Group are correlated to Inkisi Formation (Delpomdor & Préat, Citation2015; Kadima et al., Citation2011) and they underlay the Karoo deposits that are also affected by the subduction in the southern margin of Gondwana at Permo-Trias (Daly et al., Citation1992). Therefore, the underlaying units of Karoo deposits in the Congo basin must be deformed also. Thus, it proves that the Inkisi Group has been affected by the subduction at Permo-Trias at the southern margin of Gondwana.
Figure 22. Paleotectonic map of the Permo-triassic transition in African part of Gondwna. The reduce tensor find in Brazzaville are in the same range of orientation as that find in the TRM. Modified by from Delvaux (Citation2001b).
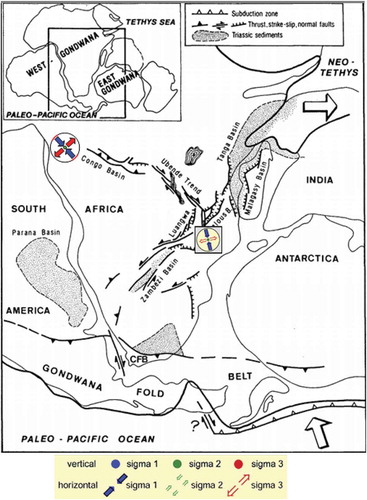
Figure 23. World stress map (2008) and second stress stage reported in the study zone. (Map from www.world-stress-map.org).
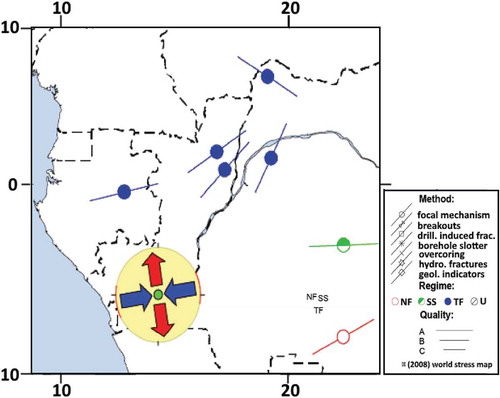
The latest stress stage with a sub-horizontal principal compressive stress (264°± 22,3/12) is not as the early stage well constrained for same reasons, but the maximum compressive stress recorded in extension fractures fits in the same range of that calculated. This stress stage might probably result from ridge push of South Atlantic mid-ocean ridge in continental part. The world map of stress data supports this evidence with the presence of a horizontal compressive stress parallel in orientation with what we determine (Figure ). This explanation has also been given for Northern Europe and Scandinavia, where the horizontal compressive stress is oriented NW–SE
(Fossen, Citation2010). This result suggests that the latest stress stage is still active but must be studied through different methods to confirm its activity.
7. Conclusion
This paper shows and proves that the Inkisi Formation has been affected by at least two strike-slip tectonic events associated both with a compression, initiated from joints. The early event produces parallel sinistral strike-slip faults and joints and the latter event produces parallel dextral strike-slip faults and joints. Both tectonic events show similar features within their structures (horstail splays, extension fractures, dilation jogs, en-echelon fractures, and flower structures), which form the basis of their identification according to Kim et al. (Citation2004) classification of fault damage zones.
The early tectonic deformation with a horizontal principal compressive stress of 319°± 21,1/03 (NW–SE) probably results from the subduction at Gondwana southern margin in Permo-Trias. However, the latest tectonic event with a sub-horizontal principal compressive stress (264°± 22,3/12) (W–E) is potentially generated by ridge push of South Atlantic mid-ocean ridge.
Description
This study of deformations in the Inkisi sandstone Formation shows that it is affected by two major directions of NW–SE and WSW–ENE strike-slip faults. The NW–SE faults have displayed sinistral movement, whereas the WSW–ENE faults that offset the previous one have dextral movement. NW–SE fractures may result from the subduction of Gondwana south margin in the Permo-Trias. The second results from the interplate stress propagation due to the opening of the southern Atlantic ocean.
Acknowledgements
We would like specially to thank Joachim Miyouna for English corrections of the manuscript. Instructive comments of anonymous reviewers substantially improve the quality of the manuscript and were greatly appreciated. We are also grateful to Pr. El Hadji Sow from Cheikh Anta Diop University of Dakar for his advices and encouragements.
Additional information
Funding
Notes on contributors
Timothée Miyouna
Timothée Miyouna is an assistant professor at Marien NGOUABI University of Brazzaville, where he teaches mineralogy and petrology of sedimentary rocks. He extensively worked in gold mineralization in West Africa Belt. Actually, he is working in basin researches and tectonic deformations in the Paleozoic sandstones of Inkisi.
References
- Affaton, P, Kalsbeek, F, Boudzoumou, F, Trompette, R, Thrane, K, & Frei, R. (2016). The Pan-African West Congo belt in the Republic of Congo (Congo Brazzaville): Stratigraphy of the Mayombe and West Congo Supergroups studied by detrital zircon geochronology. Precambrian Research, 272, 185‑202.
- Alkmim, F.F, Marshak, S, Pedrosa-Soares, A.C, Peres, G.G, Cruz, S, & Whittington, A. (2006). Kinematic evolution of the Araçuaí–West Congo orogen in Brazil and Africa: nutcracker tectonics during the Neoproterozoic assembly of Gondwana. Precambrian Research, 149, 43–64.
- Alvarez, P., Maurin, J.-C., & Vicat, J.-P. (1995). La formation de l’Inkisi (Supergroupe Ouest-Congolien) en Afrique Centrale (Congo et Bas-Zaïre): Un delta d’âge Paléozoïque comblant un bassin en extension. Journal of African Earth Sciences, 20(2), 119–131. doi:10.1016/0899-5362(95)00038-U
- Angelier, J. (1989). From orientation to magnitudes in paleostress determinations using fault slip data. Journal of Structural Geology, 11(1/2), 37–50. doi:10.1016/0191-8141(89)90034-5
- Angelier, J. (1994). Fault slip data an paleostress reconstruction. In I. P. Hancock (Ed.), Continental deformation (pp. 53–100). Oxford: Pergamon Press.
- Barton, C. C. (1983). Systhematic jointing in the Cardium Sandstone along the Bow River, PhD thesis, Alberta, Canada: New Haven, Connecticut, Yale University, 301p.
- Bons, D. P., Elburg, A. M., & Gomez-Rivas, E. (2012). A review of the formation of tectonic veins and their microstructures. Journal of Structural Geology, 43, 33–62. doi:10.1016/j.jsg.2012.07.005
- Boudzoumou, F. (1986). La chaîne Ouest-Congolienne et son avant-pays au Congo : relations avec le Mayombien ; sedimentation des sequences d’âge Protérozoïque supérieur. Thèse de doctorat, Université Aix-Marseille, France. 220p.
- Catuneanu, O. (2004). Retroarc foreland systems evolution through time. Journal of African Earth Sciences, 38, 225–242. doi:10.1016/j.jafrearsci.2004.01.004
- Catuneanu, O., Wopfener, H., Eriksson, P. G., Cairncross, B., Rubidge, B. S., Smith, R. M., & Hancox, P. J. (2005). The Karoo basins of South-central Africa. Journal of Earth Sciences, 43, 211–253.
- Christie-Blick, N., & Biddle, T. K. (1985). Deformation and basin formation along strike-slip faults. Special Publication Society of Paleontologists and Mineralogists, N°37, 1–34.
- Cornet, P., & Pourret, G. (1982). Contrôle structural du Congo dans les formations de l’Inkisi en aval de Brazzaville. Annales Université Brazzaville, 1976-1997(12–13), 17–28.
- Dadet, P. (1969). Notice explicative de la carte géologique de la République du Congo au 1:500 000 (pp. 103). Orléans: Mémoire BRGM, n°70.
- Daly, M. C., Lawrence, R. S., Dirmu-Tshiband, K., & Matouana, B. (1992). Tectonic evolution of the Cuvette Centrale, Zaïre. Journal of Geological Society, London, 149, 539–546. doi:10.1144/gsjgs.149.4.0539
- Daly, M. C., Lawrence, S. R., Kimun’a, D., & Binga, M. (1991). Late Paleozoic deformation in central Africa; a result of distant collision? Journal Southern American Earth Sciences, 6, 33–47.
- Davis, G. H, Reynolds, S. J, & Kluth, C. F. (2011). Structural geology of rocks and regions. John Wiley & Sons.
- Delpomdor, F., & Préat, A. (2015). Overview of the Neoproterozoic sedimentary series exposed along margins of the Congo Basin. In M. J. de Wit, F. Guillocheau, & M. C. J. de Wit (eds.), Geology and resource potential of the Congo basin (p. 41–58). Berlin, Heidelberg: Springer Berlin Heidelberg.
- Delvaux, D. (1993). The TENSOR program for paleostress reconstruction: Examples from the east African and the Baikal rift zones (Vol. 5, pp. 216). France: Abstract supplement N°1 to Terra Nova.
- Delvaux, D. (2001a). Tectonic an paleostress evolution of the Tanganyika-Rukwa-Malawi rift segment, East Africain Rift System. In D. P. A. Ziegler, W. Cavazza, A. H. Roberston, & Crasquin-Soleau (Eds.), Peri-Tethys Memoir 6: Peri Tethyan Rift/Wrench Basins and Passive Margins (pp. 545–567). Paris 186: Mém. Mus. National Hist. Nat.
- Delvaux, D. (2001b). Karoo rifting in western Tanziania: Precursor of Gondwana breakup. In Contributions to Geology and Paleontology of Gondwana (pp. 111–125). Cologne: In honour of Prof. Dr. Helmut Wopfner.
- Delvaux, D., & Sperner, B. (2003). Stress tensor inversion from fault kinematic indicators and focal mechanism data: The TENSOR program. In D. Nieuwland (Ed.), New Insights into Structural Interpretation and Modelling (Vol. 212, pp. 75–100). Geological Society, London, Special Publications.
- Delvaux, D., Kervyn, K., Macheyeki, S. A., & Temu, E. B. (2012). Geodynamic significance of the TRM segment in the East African Rift (W-Tanzania): Active tectonics and paleostress in the Ufipa plateau and Rukwa basin. Journal of Structural Geology, 37, 161–180. doi:10.1016/j.jsg.2012.01.008
- Dianzenza-Ndefi, H. (1983). Les sédiments du Protérozoique supérieur et leurs frmations au Nord-Ouest de la Cuvette Congolaise (Afrique Centrale) (Apport des datations par les méthodes Rb-Sr et K-Ar. Louis Pasteur). Strasbourg, France.
- Fossen, H. (2010). Structural Geology (pp. 163). New York: Cambridge University Press.
- Frimel, H. E., Tack, L., Basei, M. S., Nutman, A. P., & Boven, A. (2006). Provenance and chemostratigraphy of the Neoproterozoïc West congolian Group in the Democratic Republic of Congo. Journal of African Earth Sciences, 46(2006), 221–239. doi:10.1016/j.jafrearsci.2006.04.010
- Hancock, P. L. (1985). Brittle microtectonics: Principles and practice. Journal of Structural Geology, 7, 437–457. doi:10.1016/0191-8141(85)90048-3
- Kadima, E, Delvaux, D, Sebagenzi, S.N, Tack, L, & Kabeya, S.M. (2011). Structure and geological history of the Congo Basin: an integrated interpretation of gravity, magnetic and reflection seismic data. Basin Research, 23, 499-527.
- Kim, Y.-S, Andrews, J.R, & Sanderson, D.J. (2000). Damage zones aroundstrike-slip fault systems and strike-slip fault evolution, Crackington, Haven, southwest England. Geoscience Journal, 4, 53–72.
- Kim, Y.-S. P., Peacock, D. C., & Sanderson, J. (2004). Fault damage zones. Journal of Structural Geology, 26, 503–517. doi:10.1016/j.jsg.2003.08.002
- Martel, S. J. (1990). Formation of compound strike-slip zones, Mount Abbot quadrangle, California. Journal of Structural Geology, 12(7), 869–882. doi:10.1016/0191-8141(90)90060-C
- Mickala, O. R., Vidal, L., Boudzoumou, F., Affaton, F., Vandamme, D., Borshneck, D., … Miche, H. (2014). Geochemical characterization of the Marinoan “Cap Carbonate” of the Niari-Nyanga Basin (Central Africa). Precambrian research, 255, Part 1, 357–380.
- Oesterlen, M. (1976). Karoo-System und präkambrische Unterlage im nördlichen Angola-I. Stratigraphie, Tektonik und Petrographie. Geologisches Jahrbuch, Reihe B, 20, 3-55, Hannover.
- Oesterlen, M. (1979). Karoo system und präkambrishe unterlage im nördlichen Angola-II. Diagenese un Sedimentologie des Karoo Systems. Geologisches Jahrbuch, Reihe B, 36, 3-41, Hannover.
- Olson, E. J., & Pollard, D. D. (1991). The initiation and growth of en échelon veins. Journal of Structural Geology, 13(5), 595–608. doi:10.1016/0191-8141(91)90046-L
- Poidevin, J. L. (2007). Stratigraphie isotopique du strontium et datation des formations carbonatées et glaciogéniques néoprotérozoiques du Nord et de l’Ouest du craton du Congo. Comptes Rendus Geoscience, 339, 259–273. doi:10.1016/j.crte.2007.02.007
- Pollard, D., & Aydin, A. (1988). Progress in understanding jointing over the past century. The Geological Society of America, 100, 1181–1204. doi:10.1130/0016-7606(1988)100<1181:PIUJOT>2.3.CO;2
- Secor, D. J. (1965). Role of fluid pressure in jointing. American Journal of Science, 263, 633–646. doi:10.2475/ajs.263.8.633
- Segall, P., & Pollard, D. D. (1983). Nucleation and growth strike-slip faults in granite. Journal of Geophysics Research, 14, 555–568. doi:10.1029/JB088iB01p00555
- Straathof, G. B. (2011). Neoproterozoic low latitude glaciations: An African perspective. PhD, thesis, University of Edinburgh, U.K, Edinburgh, p. 263
- Sylvester, A. G. (1988). Strike slip faults. Geological Society of America Bulletin, 100, 1666–1703. doi:10.1130/0016-7606(1988)100<1666:SSF>2.3.CO;2
- Tack, L., Delvaux, D., Kadima, E., Delpomdor, F., Tahon, A., Dumont, P., … Dewaele, S. (2008). The 1.000 m thick Redbeds sequence of the Congo River Basin (CRB): A generally overlooked testimony in Central Africa of post-Gondwana amalgamation (550 Ma) and pre-Karoo break-up (320 Ma). 22nd Colloquium of African Geology, Hammamet, Tunisia, November 4-6, 2008, Abstract book, 86-88.
- Tack, L., Wingate, M., Liégeois, J.-P., Fernandez-Alonso, M., & Deblond, A. (2001). Early Neoproterozoic magmatism (1000-910 MA) of the Zadinian and Mayumbian Groups (Bas-Congo): Onset of Rodinian rifting at western edge of the Congo craton. Precambrian Research, 110, 277–306. doi:10.1016/S0301-9268(01)00192-9
- Tait, J., Delpomdor, F., Préat, A., Tack, L., Straathof, G., & Nkula, V. K. (2011). Neoproterozoic sequences of the West Congo and Lindi/Ubangi Supergroups in the Congo Craton, Central Africa. Geological Society, London, Memoirs, 36, 185–194.
- Tullis, T. E., & Tullis, J. (1986). Experimental rock deformation techniques, In Hobbs B. E., & Heard H. C. (eds.), Mineral and rock deformation; laboratory studies; the Paterson volume: Geophysical Monograph, Monash University, Clayton, Victoria, Australia, v. 36, p. 297–324.
Appendices
Table A1. Input data table of joints and faults slip in Win-Tensor with primary subset associated. Type (1: fault with slip line; 3: faults with tension fracture, 4: plane of fracture); column slip sense (S: Sinistral; D: dextral; T: tension); column confidence level (C: certain; P: probable)