
ABSTRACT
The aim of this study was to compare gaseous emissions from the combustion of conventional fuels (methane and gasoil) and biomass fuels (wood and peat) by the application of the CFD code FLUENT software in a furnace combustion chamber. According to the results, the combustion temperature obtained for conventional fuels was higher than it obtained for biomass fuels. Results also showed significantly lower emissions of CO2, NOx, and soot with the combustion of biomass compared to the methane and gasoil, but SO2 emissions from combustion of the conventional fuels were higher than that of biomass fuels. Also, results showed that the quantity of gaseous emissions is closely related to combustion temperature, molecular structure, and fuel characteristics.
1. Introduction
Biomass is readily available worldwide, especially in rural areas.Citation1–Citation3 Biomass burning is one of the significant global sources of trace gases (CO, CH4, H2, CH3Cl, NO, HCN, CH3CN, COS) and particle emissions in the atmosphereCitation4 and may have an impact on the chemical composition of the atmosphere, the formation of photo oxidants and thus on air quality on a regional scale, and climate change.Citation5
Climate change and the rising cost of energy, associated with decreasing fossil fuel reserves, are incentives for the development of new green energy technologies using renewable resourcesCitation6–Citation8 The production of energy and heat by the combustion of certain biomass fuels can contribute to the efforts to reduce the reliance on fossil energy and then reduce greenhouse gas emissions.Citation9 In fact, the combustion of biomass could be considered “carbon neutral” when the carbon (C) emitted during the combustion is leveled by C absorbed by plants during growthCitation2,Citation10,Citation11 or when C emissions from decomposition of biomass (mainly as CO2 and CH4) are avoided. It must be said that carbon neutrality is not automatically reached for any biomass combustion system. The net life cycle emission can vary greatly in function of several factors, e.g., the source of the biomass,Citation12 the yield, and the soil C of the displaced agricultural system.Citation13
The use of such biomasses as fuel is a good way for farmers to exploit their marginal lands, to diversify their incomes, and to produce sustainable energy in order to limit fossil fuel use. A wide proportion of the scientific research in biomass combustion is destined to woody fuels, while research in agricultural biomass is less intensive.Citation14 In fact, literature shows that biomass is likely to have a significant chlorine and nitrogen content, resulting in HCl and NOx emissions. Technical issues such as corrosion, fouling, and slanging are also frequently highlighted.
The process of biomass combustion involves a number of complex physical and chemical aspects.Citation10 Combustion occurs when air and fuel are mixed together and the ignition temperature is reached. When complete combustion is achieved, carbon (C) and hydrogen (H) are, respectively, oxidized to carbon dioxide (CO2) and water (H2O), producing energy as heat at elevated temperatures.Citation9 Other compounds released from the complete combustion are nitrogen oxides (NOx, mainly nitrogen monoxide (NO) and dioxide (NO2)), nitrous oxide (N2O), sulfur oxides (SOx, mainly sulfur dioxide (SO2)), hydrogen chloride (HCl), particulate matter (PM), and heavy metals. The gaseous emissions from the combustion process are influenced by many factors. For instance, an overall lack of available oxygen (O2), an inadequate mixing of air and fuel in the combustion chamber, too low combustion temperatures, and too short residence time can lead to the formation of incomplete combustion compounds including carbon monoxide (CO), methane (CH4), non-methane volatile organic compounds (NMVOC), polycyclic aromatic hydrocarbons (PAH), PM, ammonia (NH3), and ozone (O3). These compounds have an adverse effect either on climate, the environment, or human health.Citation10
Several authors have studied emissions from various biomasses.Citation4,Citation15 Andreae et al.Citation16 calculated the SO2 and NOx emissions based on a mass balance of carbon released and the various emission ratios relative to CO2 determined in the smoke. Streets and WaldhoffCitation17 estimated atmospheric emissions of SO2 and NOx from biofuels, whereas Van Aardenne et al.Citation18 evaluated NOx emissions due to anthropogenic activities. These studies are based on Regional Air Pollution Information and Simulation Model for Asia methodology. The literature cited above shows the various field/laboratory experiments conducted to measure emission factors and emission ratios.
Also GhenaiCitation19 carried out numerical investigation on syngas and methane using a k–ε turbulence model. This researcher observed that the gas temperature for the all five syngas compositions studied is lower than that of methane, and this was attributed to their lower heating value as well as the mixture of combustible and non-combustibles constituents present in the syngas. They concluded that for the same fuel mass flow rate, the power generated and the average NOx mass fraction for syngas are lower than that of methane while higher mass of CO2 was emitted.
The combustion and emission characteristics are numerically investigated and compared with the case of pure methane combustion in a two-burner 200-MW package boiler by Habib et al.Citation20 In this research, a detailed reaction kinetics mechanism of 21 steps and 11 species was considered for the modeling of syngas–air combustion. The results showed a combustion delay in case of pure methane combustion, compared to syngas combustion. The case of 33% CO:67% H2 syngas composition was found to have the shortest flame compared to that of other syngas compositions. The cases of 50% CO:50% H2 and 67% CO:33% H2syngas resulted in the lowest and highest maximum boiler temperature, respectively.
Miles et al.Citation21 examined combustion of biomass and coal with respect to cost-effectiveness of the recoverable energies, and in this study they expressed some factors such as lesser risk, lower cost, and steady state of recoverable energies, reduced production of greenhouse gases, CO2, SOx, and NOx, and some other cases as the advantages of substitution of this type of fuel in the industry.
Numerous works have proposed a wide variety of strategies to implement several submodels into commercial CFD codes to couple the thermal conversion of the solid phase with the CFD simulation of the remaining processes. A recent review of the numerical modeling of combustion systems was presented by Karim and Naser.Citation22 Most published CFD models of biomass combustion systems are based on compact domains, where the combustion of the packed bed occurs through either a zero- or one-dimensional approach. Porteiro et al.Citation23 used a zero-dimensional bed that took into account the individual contribution of each particle of the bed in a transient simulation. The mass, energy, and species were exchanged by the bed and the furnace through a boundary surface. In researchCitation24–Citation25 a similar approach was used in a steady and computationally fast model that implemented the zero-dimensional bed inside the CFD domain. Other works use a one-dimensional bed model coupled with the CFD domain by a boundary surface to simulate the biomass advancing along the grate where it is consumed. This method was applied by other authorsCitation26–Citation28 who modeled the one-dimensional bed as a “walking column” of biomass that advances to the next position in the grate while the thermal conversion of biomass takes place. Zhou et al.Citation29 extended the Van der Lans et al.Citation26 model to a more detailed account of the properties in order to achieve more accurate predictions.
In the present study gaseous emissions from the combustion of conventional fuels (methane and gasoil) and biomass fuels (wood and peat) were determined and compared together by the application of the CFD model in a furnace combustion chamber.
2. Mathematical model
The mathematical model describing the combustion process is based on the equations of mass, momentum, species, and energy as well as equations for turbulence and models. The CFD simulations in this work were performed using the realizable k-ε (RNG version) model turbulence flow and the eddy dissipation concept (EDC) by Gran and MagnussenCitation30 and Ertesvåg and MagnussenCitation31 for turbulent combustion coupling in conjunction with three different reaction mechanisms developed for biomass combustion.Citation32 The submodels for initial heat-up, drying, devolatilization, char combustion, and final heating/cooling of the ash include heat and mass transfer equations. The eddy dissipation model in combination with reaction kinetics serves to calculate the rate of fuel consumption as the lowest step of mixing rates proportional to the decay of fuel, oxygen, and product swirls as well as a kinetic rate without consideration of the influence of turbulent fluctuations. The generalized equations that govern the conservation of mass, momentum, and energy as well as the equations for species transport can be written as:Citation33–Citation35
Continuity equation:
Momentum equation in θ-axis:
Momentum equation in X-axis:
Energy equation:
Biomass combustion processes can be expressed by Eq. (5):
where y, z, a, b, and c are, respectively, the mass fractions of hydrogen, oxygen, nitrogen, sulfur, and chlorine per atom of carbon in the biomass, w is the amount of moisture per kmol of feedstock, r is the quantity of oxygen (O2) supplied to the process per kmol of feedstock, and ni are the numbers of species moles of i (kmol).The molar biomass composition and the molar moisture quantity are obtained from standard ultimate and proximate analyzes. The variable r is calculated from the air-to-fuel ratios measured experimentally.
Methane combustion processes can be expressed by Eqs. (6) and (7):
The properties of wood and methane are shown in .
Table 1. Properties of wood and methane.
2.1. Geometry conditions
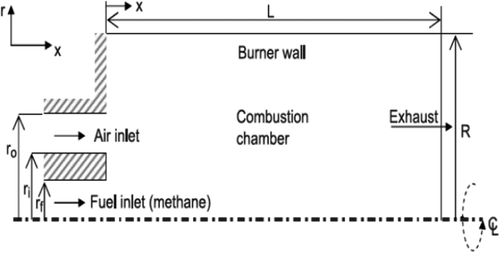
In this study, the geometry of the model has been considered by means of study of Yapici et al.Citation36. In their study, they have analyzed the effects of oxygen rate on the produced entropy from combustion of methane fuel in a combustion chamber; the geometry of the furnace combustion chamber (in which the ratio of chamber length to its diameter is very high) along with inlet and outlet conditions and symmetry is shown in . also shows the geometric dimensions of the combustion chamber.
Table 2. Geometric dimensions of combustion chamber.
Figure 1. Schematic of geometry of the combustion chamber.
2.2. Solution procedures
Boundary conditions that included walls, axis, and mass flow inlet and pressure outlet were defined for each of the zones, and the furnace side walls have a constant temperature boundary condition (300°K).
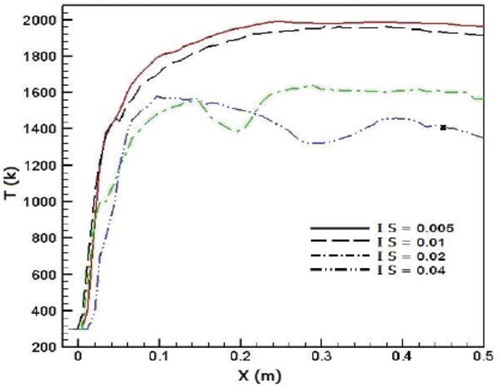
The model was 3-dimensional and in full scale. GAMBIT software was used for the construction of model geometry. Four mesh sizes were generated to obtain accurate results as different mesh sizes have a different impact on the solution of the model (). According to the , there are no significant differences between axial temperature results for No. 3 and No. 4 mesh sizes. So the appropriate mesh size consisting of approximately 78,100 hexahedral elements was selected. In the current study, the ANSYS FLUENT software was used for the simulations, and the meshing from GAMBIT was exported to FLUENT for the next CFD setup.
Table 3. Number of meshing at any phase.
Figure 2. Comparison of results from simulation on independence of the mesh sizes.
Within the present research, the simulations were performed with the following biomass combustion submodels:
The initial heat-up stage, which follows the inner law of the original DPM. During this stage, the particle mass stays constant, and the particle temperature is calculated from the modified FLUENT DPM energy equation.
The stage of drying of a single fuel particle is modeled by two subsequent steps, vaporization and boiling (according to the vaporization law and boiling law of the original DPM). The mass loss during drying is calculated via original DPM equations. The temperature of the particle is determined from the modified FLUENT DPM energy equation.
Devolatilization process: During this process, the mass loss follows a biomass-specific submodel, described below. The submodel remains in effect as long as the mass of the particle exceeds the mass of the char. The solution of the modified FLUENT DPM energy equation gives the temperature of the particle.
The stage of char combustion, which follows the surface combustion law of the original DPM. The biomass char is assumed to consist only of carbon and oxidizes according to Eq. (8):
where Sb is the burnout stoichiometric ratio. The surface reaction proceeds at the rate given by the diffusion-limited surface reaction model (a part of the original DPM) until the combustible fraction is consumed. The particle temperature is calculated from the modified FLUENT DPM energy equation.(8)
The stage of final heating/cooling of the ash follows the inert law of the original DPM. The solution of the modified FLUENT DPM energy equation delivers the temperature of the remaining ash.
3. Results and discussion
3.1. Methane combustion
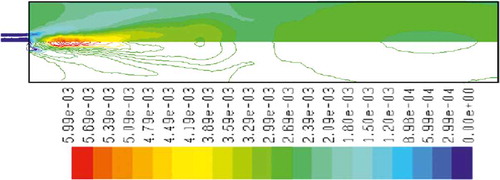
– show the mass fraction of methane fuel, temperature, O2, CO2, NOx, and soot for methane combustion, respectively. According to , methane reacts immediately after that the combustion begins, and it can be observed that mass fraction of methane fuel was distributed only at the chamber inlet. shows the gas temperature in the furnace chamber for methane combustion. According to the results, the maximum temperature has occurred in the axial line, and also the combustion temperature was increased in radial axis. Also, oxygen mass fraction reached zero, especially at the axial line of the chamber during the combustion process (). CO2 emission from methane combustion is shown in . According to the figure, the maximum CO2 emission from methane combustion happens at the axial line of the combustion chamber. This parameter also is higher in the outlet area of the chamber than that at the inlet area of the chamber.
Figure 3. Methane fuel mass fraction contour for methane combustion.
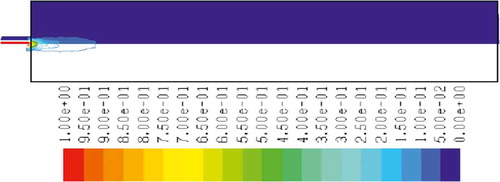
Figure 4. Temperature distribution contour for methane combustion.
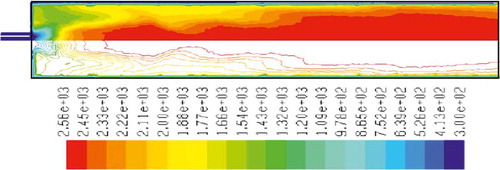
Figure 5. O2 mass fraction contour for methane combustion.
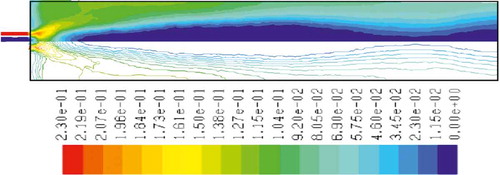
Figure 6. CO2 mass fraction contour for methane combustion.
and show NOx and soot mass fraction produced from methane combustion, where it can be seen that the minimum rate occurs in the inlet area of the chamber, while the maximum rate of producing these emissions took place in the outlet area of the chamber. Since NOx and soot formation depends on the temperature of the combustion chamber, it can be clearly seen that by increasing combustion temperature, NOx and soot emissions increase linearly.
Figure 7. NOx mass fraction contour for methane combustion.
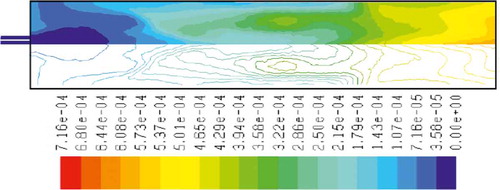
Figure 8. Soot mass fraction contour for methane combustion.
3.2. Wood combustion
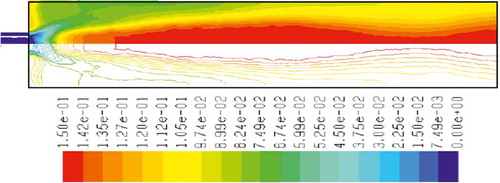
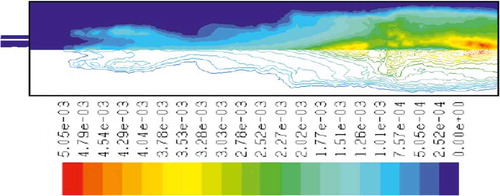
to 15 show the mass fraction of wood, temperature, O2, CO2, NOx, soot, and SO2 for wood combustion, respectively. Similar to methane combustion, wood reacts immediately after the combustion begins, and it can be observed that mass fraction of wood fuel was distributed only at the chamber inlet (). According to , the maximum combustion temperature occurs in the inlet area of the chamber, and a relatively uniform reduction in temperature throughout the chamber can be observed. Unlike methane combustion, mass fraction of oxygen did not reach zero during the combustion process (). The distribution of CO2 mass fraction is shown in . This parameter has the maximum amount at the beginning combustion zone of the chamber, and it has been distributed uniformly throughout the chamber. and indicate the mass fraction of NOx and soot, respectively. According to the results, the maximum soot production happens in the inlet area of the combustion chamber, but the amount of this parameter leads to zero in other regions of the combustion chamber. SO2 emission from wood combustion is shown in . This parameter also has the maximum amount at the beginning combustion zone of the chamber, and it has been distributed uniformly throughout the chamber.
Figure 9. Wood fuel mass fraction contour for wood combustion.
Figure 10. Temperature distribution contour for wood combustion.
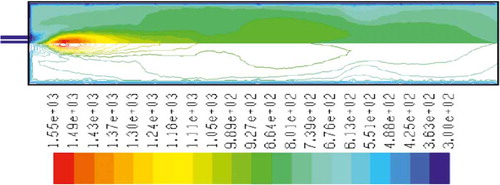
Figure 11. O2 mass fraction contour for wood combustion.
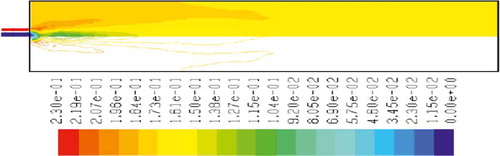
Figure 12. CO2 mass fraction contour for wood combustion.
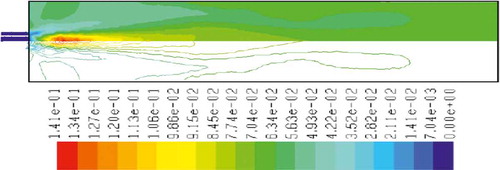
Figure 13. NOx mass fraction contour for wood combustion.
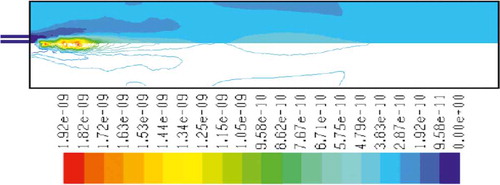
Figure 14. Soot mass fraction contour for wood combustion.
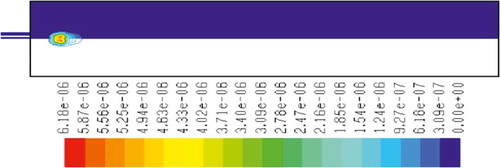
Figure 15. SO2 mass fraction contour for wood combustion.
3.3. Comparison of combustion temperature and gaseous mass fraction for different fuels combustion
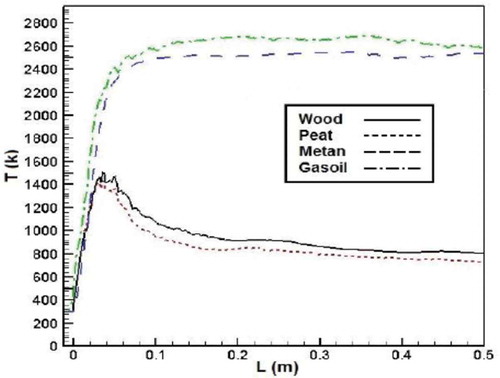
shows results of axial temperature of different fuels’ combustion. As the figure shows, at the first, axial temperature for biomass fuels raised and then decreased through the combustion chamber. But for conventional fuels, the temperature grew up first and then has a constant value during the combustion chamber. According to the results, the axial temperature of methane and gasoil is higher than that of biomass fuels. It could be due to the higher heating values of conventional fuels, which causes higher combustion temperature. Another possible reason is higher moisture content of biomass fuels that leads to lower temperature.Citation37
Figure 16. Comparison of gas temperature in the axial line of the combustion chamber.
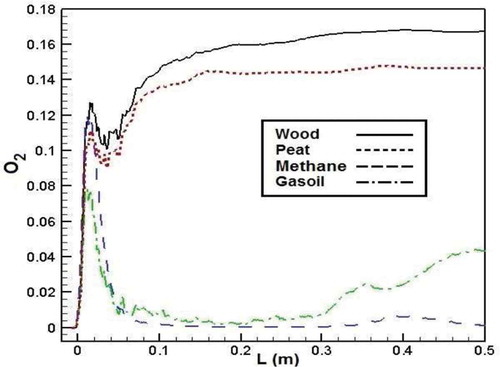
shows the O2 mass fraction of different fuels in the combustion chamber. According to the results, the wood combustion process has the maximum O2 mass fraction in the furnace chamber, and the minimum O2 mass fraction belongs to methane combustion. As the figure shows, O2 mass fraction of biomass in the combustion chamber is higher than that of methane and gasoil because of more oxygen content in the molecular structure of biomass fuels than that of conventional fuels. In fact, oxygen content in the molecular structure of biomass fuels increases the quantity of O2 available in the reactants of which resulted in the higher O2 mass fraction for biomass fuels in the combustion chamber.Citation38–Citation40
Figure 17. Comparison of O2 mass fraction in the axial line of the combustion chamber for different fuels.
shows CO2 emission from the combustion of different fuels. According to the results, at first, CO2 emission increases for all fuels. After that, carbon dioxide dropped through the combustion chamber in biomass combustion. But CO2 emission has a constant value during the combustion chamber for conventional fuels.
Figure 18. Comparison of CO2 mass fraction in the axial line of the combustion chamber for different fuels.
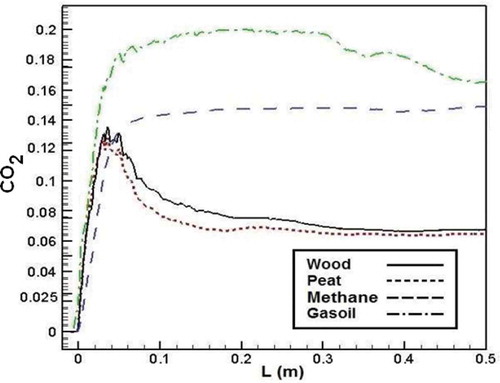
CO2 formation is related to combustion temperature and existing O2 gas in the combustion chamber. On the other hand, although the oxygen content of biomass fuels is more than that of methane and gasoil but because of higher C content in the molecular structure of methane and gasoil, higher CO2 emission was emitted during the methane and gasoil combustion process.Citation38,Citation40 Besides this reason, higher temperature in conventional fuel combustion leads to more CO2 in the combustion chamber compared to biomass fuels.Citation20,Citation40
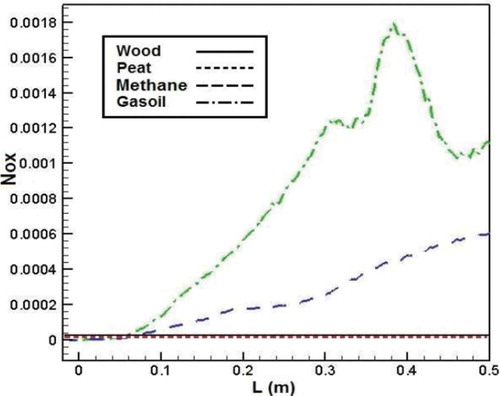
shows NOx emission from the combustion of different fuels. According to the figure, NOx emission produced from biomass combustion is lower than that of methane and gasoil. NOx emission leads to zero value for biomass fuels. The possible reason is the effects of temperature on NOx formation, and so the lower gas temperature during wood combustion, which was attributed to the lower heating value of biomass, causes lower NOx emission.Citation20
Figure 19. Comparison of NOx mass fraction in the axial line of the combustion chamber for different fuels.
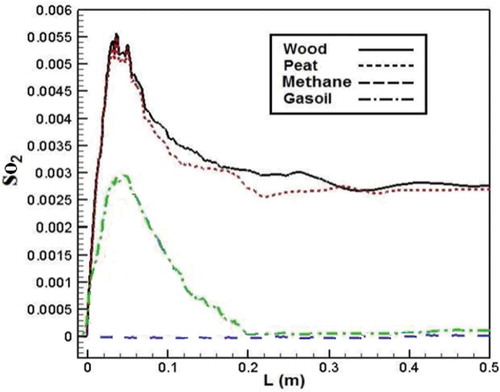
SO2 emission is a result of the complete oxidation of S in the fuel.Citation39 So shows SO2 emission leads to zero value for methane fuel. According to the results, at first, SO2 emission increase for other fuels. After that, sulfur dioxide emission dropped throughout the combustion chamber. According to the figure, SO2 emission from biomass combustion is higher than that of gasoil combustion. The main possible reason may be higher amounts of S in biomass structure than that of gasoil, which increases the sulfur dioxide emission (SO2).Citation39–Citation40 Another reason could be that there is excess O2 during the combustion chamber for biomass fuels, which contributes to more SO2 formation.
Figure 20. Comparison of SO2 mass fraction in the axial line of the combustion chamber for different fuels.
High gas temperatures and a lack of oxygen in local areas in the cylinder may cause high soot formation rates.Citation41 shows soot mass fraction in the combustion process of different fuels. According to the figure, there is a significant variation between soot formation of methane and gasoil and biomass combustion, as the soot mass fraction for biomass fuels is near to zero in the combustion chamber.
Figure 21. Comparison of soot mass fraction in the axial line of the combustion chamber for different fuels.
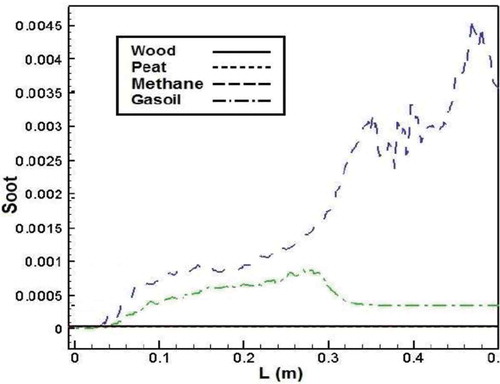
It can be explained that the biomass fuels have an increase in fuel oxygen content but a decrease of carbon content, leading to a reduction of soot formation.Citation38 Also, oxygen content of biomass fuels causes larger fractions of the fuel carbon to be converted to CO or CO2 rather than soot formation.Citation42 In addition, higher gas temperature in methane and gasoil combustion influences the rate of soot formation.Citation41
4. Conclusion
The present article demonstrated the application of the mathematical model (CFD simulation) describing the combustion process based on the equations of mass, momentum, species, and energy as well as equations for turbulence and models to predict gaseous emissions from methane, gasoil, and biomass combustion. The simulation allowed estimates of CO2, NOx, SO2, and soot emission in the case of combustion of four dedicated fuels.
In addition:
The combustion temperature obtained for conventional fuels was higher than that obtained for biomass fuels.
CO2 emissions from biomass fuel combustion were lower than for methane and gasoil combustion.
NOx and soot emissions from biomass combustion were significantly lower than from both methane and gasoil combustion and were almost zero.
The SO2 emissions for conventional fuels were lower than that of biomass fuels.
According to the results, the quantity of gaseous emissions is closely related the combustion temperature, molecular structure, and fuel characteristics.
The results also demonstrated that special attention must be paid to the use of biomass as fuel.
References
- Demirbas, A. Potential Applications of Renewable Energy Sources, Biomass Combustion Problems in Boiler Power Systems and Combustion Related Environmental Issues. Prog. Energ. Combust. Sci. 2005, 31, 171–192.
- Saidur, R.; Abdelaziz, E. A.; Demirbas, A.; Hossain, M. S.; Mekhilef, S. A Review on Biomass as a Fuel for Boilers. Renew. Sustain. Energ. Rev. 2011, 15, 2262–2289.
- Alicea, M.; Coriglianoa, O.; Fragiacomoa, P. Energetic-Environmental Enhancement of Waste and Agricultural Biomass by Anaerobic Digestion Process. Energ, Tech. Policy 2014, 1, 59–69.
- Andreae, M. O.; Merlet, P. Emission of Trace Gases and Aerosols from Biomass Burning. Global Biogeochem. Cycl. 2001, 15, 955–966.
- Andreae, M. O.; Jones, C. D.; Cox, P. M. Strong Present-Day Aerosol Cooling Implies a Hot Future. Nature 2005, 435, 1187–1190.
- Shirneshan, A.; Almassi, M.; Ghobadian, B.; Borghei, A. M.; Najafi, G. H. Effects of Biodiesel and Engine Load on Some Emission Characteristics of a Direct Injection Diesel Engine. Current World Environ. 2012, 7, 207–212.
- Shirneshan, A.; Almassi, M.; Ghobadian, B.; Najafi, G. Investigating the Effects of Biodiesel from Waste Cooking Oil and Engine Operating Conditions on the Diesel Engine Performance by Response Surface Methodology Iranian J. Sci. Tech, Trans. Mech. Eng. 2014, 38, 289–301.
- Dattaa, A.; Mandala, B. K. Use of Jatropha Biodiesel as a Future Sustainable Fuel. Energ. Tech. Policy 2014, 1, 8–14.
- Demirbas, A. Biofuels Securing the Planet’s Future Energy Needs. Energ. Conv. Manag. 2009, 50, 2239–2249.
- Van Loo, S.; Koppejan, J. The Handbook of Biomass Combustion and Co-Firing; Earthscan: Sterling, VA, 2008.
- Vassilev, S. V.; Baxter, D.; Andersen, L. K.; Vassileva, C. G. An Overview of the Chemical Composition of Biomass. Fuel 2010, 89, 913–933.
- Haberl, H.; Sprinz, D.; Bonazountas, M.; Cocco, P.; Desaubies, Y.; Henze, M.; Hertel, O.; Johnson, R. K.; Kastrup, U.; Laconte, P.; Lange, E.; Novak, P.; Paavola, J.; Reenberg, A.; Van Den Hove, S.; Vermeire, T.; Wadhams, P.; Searchinger, T. Correcting a Fundamental Error in Greenhouse Gas Accounting Related to Bioenergy. Energ, Policy, 2012, 45, 18–23.
- Sanscartier, D.; Deen, B.; Dias, G.; Maclean, H. L.; Dadfar, H.; Mcdonald, I.; Kludze, H. Implications of Land Class and Environmental Factors on Life Cycle GHG Emissions of Miscanthus as a Bioenergy Feedstock. GCB Bioenerg. 2014, 6, 401–413.
- Villeneuve, J.; Palacios, J. H.; Savoie, P.; Godbout, S. A Critical Review of Emission Standards and Regulations Regarding Biomass Combustion in Small Scale Units (<3 MW). Bioresource Tech. 2012, 111, 1–11.
- Spiro, P. A.; Jacob, D. J.; Logan, J. A. Global Inventory of Sulfur Emissions with 1° × 1° Resolution. J. Geophys. Res. Atmospheres 1992, 97, 6023–6036.
- Andreae, M. O.; Atlas, E.; Cachier, H.; Cofer, W. R. E. A. Trace Gas and Aerosol Emissions From Savanna Fires. Biomass Burn. Global Change 1996, 1, 278–295.
- Streets, D. G.; Waldhoff, S. T. Biofuel Use in Asia and Acidifying Emissions. Energy 1998, 23, 1029–1042.
- Van Aardenne, J. A.; Carmichael, G. R.; Levy, H.; Streets, D.; Hordijk, L. Anthropogenic NOx Emissions in Asia in the Period 1990–2020. Atmospher. Environ. 1999, 33, 633–646.
- Ghenai, C. Combustion of Syngas Fuel in Gas Turbine Can Combustor. Adv. Mech. Eng. 2010, 2, 342357.
- Habib, M. A.; Mokheimer, E. M. A.; Sanusi, S. Y.; Nemitallah, M. A. Numerical Investigations of Combustion and Emissions of Syngas as Compared to Methane in a 200 MW Package Boiler. Energy Conv. Manag. 2014, 83, 296–305.
- Miles, T. R.; Miles Jr.; T. R., Baxter, L. L.; Bryers, R. W.; Jenkins, B. M.; Oden, L. L. Boiler Deposits From Firing Biomass Fuels. Biomass Bioenerg. 1996, 10, 125–138.
- Karim, M.; Naser, J. Progress in Numerical Modelling of Packed Bed Biomass Combustion. 19th Australasian Fluid Mechanics Conference, Melbourne, Australia, 2014.
- Porteiro, J.; Collazo, J.; Patiño, D.; Granada, E.; Moran Gonzalez, J. C.; Míguez, J. L. Numerical Modeling of a Biomass Pellet Domestic Boiler. Energ. Fuels 2009, 23, 1067–1075.
- Collazo, J.; Porteiro, J.; Míguez, J. L.; Granada, E.; Gómez, M. A. Numerical Simulation of a Small-Scale Biomass Boiler. Energ. Conv. Manag. 2012, 64, 87–96.
- Gómez, M. A.; Comesaña, R.; Feijoo, M. A. Á.; Eguía, P. Simulation of the Effect of Water Temperature on Domestic Biomass Boiler Performance. Energies 2012, 5, 1044–1061.
- Van der Lans, R. P.; Pedersen, L. T.; Jensen, A.; Glarborg, P.; Dam-Johansen, K. Modelling and Experiments of Straw Combustion in a Grate Furnace. Biomass Bioenerg. 2000, 19, 199–208.
- Kær, S. K. Numerical Modelling of a Straw-Fired Grate Boiler. Fuel 2004, 83, 1183–1190.
- Yin, C.; Rosendahl, L.; Kær, S. K.; Clausen, S.; Hvid, S. L.; Hille, T. Mathematical Modeling and Experimental Study of Biomass Combustion in a Thermal 108 MW Grate-Fired Boiler. Energ. Fuels 2008, 22, 1380–1390.
- Zhou, H.; Jensen, A. D.; Glarborg, P.; Jensen, P. A.; Kavaliauskas, A. Numerical Modeling of Straw Combustion in a Fixed Bed. Fuel 2005, 84, 389–403.
- Gran, I. R.; Magnussen, B. F. A Numerical Study of a Bluff-Body Stabilized Diffusion Flame. Part 2. Influence of Combustion Modeling and Finite-Rate Chemistry. Combust. Sci. Tech. 1996, 119, 191–217.
- Ertesvåg, I. S.; Magnussen, B. F. The Eddy Dissipation Turbulence Energy Cascade Model. Combust. Sci. Tech. 2000, 159, 213–235.
- Løvås, T.; Houshfar, E.; Bugge, M.; Skreiberg, Ø. Automatic Generation of Kinetic Skeletal Mechanisms for Biomass Combustion. Energ. Fuels 2013, 27, 6979–6991.
- Reynolds, W. Fundamentals of Turbulence for Turbulence Modeling and Simulation; Defense Technical Information Center: Fort Belvoir, VA, 1987.
- Shih, T.-H.; Liou, W.; Shabbir, A.; Yang, Z.; Zhu, J. A New K-E Eddy Viscosity Model for High Reynolds Number Turbulent Flows. Comput. Fluids 1995, 24, 227–238.
- Habib, M. A.; Ben-Mansour, R.; Badr, H. M.; Ahmed, S. F.; Ghoniem, A. F. Computational Fluid Dynamic Simulation of Oxyfuel Combustion in Gas-Fired Water Tube Boilers. Comp. Fluids 2012, 56, 152–165.
- Yapici, H.; Basturk, G.; Kayatas, N.; Albayrak, B. Numerical Study of Effect of Oxygen Fraction on Local Entropy Generation in a Methane-Air Burner. Sadhana 2004, 29, 641–667.
- Demirbaş, A. Sustainable Cofiring of Biomass with Coal. Energ. Conv. Manag. 2003, 44, 1465–1479.
- Demirbas, A. Biohydrogen, for Future Engine Fuel Demands; Springer: Berlin, Germany, 2009.
- Brassard, P.; Palacios, J. H.; Godbout, S.; Bussieres, D.; Lagace, R.; Larouche, J.-P.; Pelletier, F. Comparison of the gaseous and Particulate Matter Emissions from the Combustion of Agricultural and Forest Biomasses. Bioresource Tech. 2014, 155, 300–306.
- Fournel, S.; Marcos, B.; Godbout, S.; Heitz, M. Predicting Gaseous Emissions From Small-Scale Combustion of Agricultural Biomass Fuels. Bioresource Tech. 2015, 179, 165–172.
- Tan, P.-Q.; Hu, Z.-Y.; Lou, D.-M.; Li, Z.-J. Exhaust Emissions From a Light-Duty Diesel Engine with Jatropha Biodiesel Fuel. Energy 2012, 39, 356–362.
- Buyukkaya, E. Effects of Biodiesel on a DI Diesel Engine Performance, Emission and Combustion Characteristics. Fuel 2010, 89, 3099–3105.