
 ?Mathematical formulae have been encoded as MathML and are displayed in this HTML version using MathJax in order to improve their display. Uncheck the box to turn MathJax off. This feature requires Javascript. Click on a formula to zoom.
Abstract
The paper explores the nature of change and finds evidence in favor of deceleration hypothesis: prior changes of a given type decrease the likelihood of a subsequent change of the same type while controlling for unobserved heterogeneity. We analyze leadership changes by explaining factors that influence football teams to replace their coaches. We use panel data for 33 National Football League’s teams from 1976 to 2008.
Public Interest Statement
Change was always considered essential to organizational survival and is becoming more and more important in the times of globalization, deregulation, and competitive pressure. This paper explores leadership changes by explaining factors that influence football teams to replace their coaches by using panel data for 33 US National Football League’s (NFL) teams from 1976 to 2008. There is a big variation in the number of times NFL teams replaced their coaches. For example, Oakland Raiders team has changed its coaches 11 times in 32 years while Tom Landry led Dallas Cowboys for 28 years from 1960 to 1988. We find evidence that a higher number of previous coach replacements decrease the likelihood of a subsequent change (while controlling for unobserved heterogeneity) suggesting that organizations learn from changes. Also, football teams are less likely to replace the coach when the team is successful (high win/loss ratio) and more likely to replace older coaches.
1. Introduction
‘Although there is no progress without change, not all change is progress.’ Footnote1 Wooden and Jamison (Citation2005)
Change was always considered essential to organizational survival (Van de Ven, Citation1986) and is becoming more and more important in the times of globalization, deregulation, and competitive pressure. However, surprisingly big number of change initiatives fails. Many studies claimed that about 70% of all changes in organizations fail and this failure rate has been consistent for decades (Burnes & Jackson, Citation2011; Hammer & Champy, Citation1993; Higgs & Rowland, Citation2005; Kotter, Citation1990; McKinsey & Company, Citation2008; Rogers, Meehan, & Tanner, Citation2006). Therefore, understanding the differential capability of organizations to change remains a central, ongoing research question in organizational theory (Bercovitz & Feldman, Citation2008; Dacin, Goodstein, & Scott, Citation2002; and a literature review in Greenwood & Hinings, Citation2006). Pettigrew, Woodman, and Cameron (Citation2001) called for new research and bigger collaboration between social science and management research and By (Citation2005) pointed out that there is a lack of empirical research on change management.
Previous studies on the subject concentrated on three types of organizational changes: changes in companies’ rules, leadership, and strategies (see Beck, Brüderl, & Woywode, Citation2008 for a comprehensive literature review). One branch of research focuses on the consequences of change and the other focuses on the causes of change. Our paper focuses on triggers of changes in leadership. Exploring factors behind leadership changes might provide us with new perspectives on ways to avoid inefficiencies. However, very few empirical studies focused on leadership changes. This paper addresses this gap in the context of replacement of the US National Football League (NFL) coaches. There is a big variation in the number of times NFL teams replaced their coaches. For example, Oakland Raiders team has changed its coaches 11 times in 32 years (1976–2008) while Coach Tom Landry led Dallas Cowboys for 28 years from 1960 to 1988.
Of a particular interest is whether the number of prior rule changes influences the likelihood of future rule changes—the topic addressed in this paper. One scenario is that organizations learn from previous changes to find the best leader who does not have to be replaced in the near future (supporting the “deceleration hypothesis”). The other scenario is that organizations with many previous changes have established routines and changing the leadership is not as difficult as for companies with less experience in change (supporting the “repetitive momentum hypothesis”). We test these opposite hypotheses using an example of the NFL teams replacing their coaches. In the next section, we review the literature on the repetitive momentum and deceleration hypotheses. Next, we estimate the probability of change using a logit model and we estimate the time between changes using a hazard model.
2. The Existing Literature: Deceleration and Repetitive Momentum Hypotheses
Institutions recognize and seek to understand the nature of changes. The arguments for positive effect of prior changes (the “repetitive momentum hypothesis”) take into account that companies set up routines and are more confident to execute more future changes (“learn to change by changing”) and, therefore, decrease the marginal cost of change. Schulz (Citation1998) estimated the rate of revision of administrative rules of a large US research university using a hazard model and found the number of previous rules revisions to be positive and significant. Ocasio (Citation1999) used data from 120 US industrial corporations listed in the Moody’s Industrial Directory and found the past number of insider-CEO successions to be positively related to the rate of the CEO successions. Delacroix and Swaminathan (Citation1991) explored three kinds of organizational change: brand-portfolio changes, product-line change, and change in land ownership status in the California Wine industry. They found positive and significant effects of the number of preceding changes on the probability of subsequent change.
The alternative view, presented by Beck et al. (Citation2008), is that if change leads to the refinement of organizational procedures, there should be less need to change these procedures again. As a consequence, prior changes should stabilize organization by establishing appropriate market strategies, finding good matches for firm’s leadership, and formulating more stable rules earlier. With regard to experience, one can assume that organizational members who have learned how to deal effectively with a rule system should be able to design rules in such a way that, for some time, they do not require further changes. Beck et al. (Citation2008) studied coach replacement in Bundesliga German soccer league and found that the team’s rank affects the replacement of coaches positively and the number of previous replacements has negative effect. Beck and Kieser (Citation2003) found significant and negative effect of previous changes on rule change probability using data on the personnel rules of a German bank (rules were merged, reordered, reformulated, or abolished altogether). Beck et al. (Citation2008) argued that the support for the repetitive momentum hypothesis found in previous studies (that prior changes increase the likelihood of future changes) might be a result of a bias introduced by unobserved heterogeneity. Except for Beck et al. (Citation2008) and Beck and Kieser (Citation2003), no other study controlled for companies’ fixed effects. As observed by Beck et al. (Citation2008) not accounting for unobserved heterogeneity may be the reason of finding of a positive effect of prior change on the probability of the subsequent change. Organizations may differ in their propensity to change. For example, some organizations may exist in high rate of technological change or more innovative industries. These organizations accumulate more changes over their life course so, at any point of time, their overall number of changes is higher than those of organizations in other industries. As a consequence, organizations with high propensity to change will dominate the risk set at high numbers of prior changes and the estimated coefficient will be biased and higher than the true effect.
3. Data and Methodology
As explained above, to ensure unbiased estimates, unobserved heterogeneity needs to be taken into account and panel data provide such opportunity. Data on changes in the NFL coaches and the team’s win–loss percentage for 33 NFL teams from 1976 to 2008 were collected from the Pro-football-reference.com website. In the logit model, the dependent variable takes a value of 1 when the change occurred and 0 otherwise. To assess the effects of previous changes, we constructed a variable, the number of preceding changes. The variable is set at 0 at the first year of data and it takes a value of 1 in the year following the first change, a value of 2 in the year following the second change, and so on. In line with previous research, this variable is converted to a logarithm form (after adding .01 to all data because of the presence of zeros). A negative and significant coefficient on this variable would offer support of deceleration hypothesis (when the change propensity decreases as changes accumulate) while the positive coefficient would offer a support of the repetitive momentum hypothesis (when the change propensity increases as changes accumulate). We present basic descriptive statistics and correlations in Table .
Table 1. Descriptive Statistics and Correlations (n = 775)
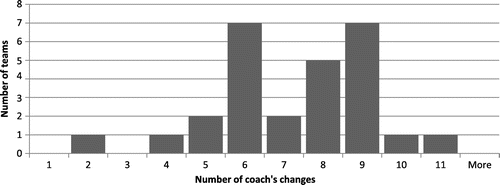
For a closer look at patterns of change, Figure presents a histogram of the number of teams that changed their coaches. During the 32 years studied (1976–2008), Oakland Raiders football team replaced its coach the most often: 11 times. While Pittsburgh Steelers replaced its coach the least—only two times. The histogram is bi-modal at six times (26% of teams) and nine times (26% of teams). In addition, during the 32-year period, there were 196 changes in coaches, representing an average of six changes per year across all 27 teams included in the study (22% of teams change their coach in a given year) or one change per team about every 4.4 years.
Figure 1. Histogram: the number of times teams changed their coaches (1976–2008).
It is reasonable to suspect that the more successful is the team, the less likely it is that the coach will be replaced. Therefore, we control for the team’s win–loss percentage. The higher the team’s win–loss percentage, the lower will be the probability of a change in a given year. We also control for coach’s age (in a logarithm form). In our sample, the mean coach’s age was 51.
Our dependent variable is a binary choice coded as one when a given team in a given year changed its coach and zero otherwise. We estimate the probability of a change in a given year and team: Prob(change occurs) or Prob(yit = 1), where i is a team and t is a year. We believe that a set of factors included in the vector x explains this probability; therefore, Prob(yit = 1I x) = F(x, β) where β are the parameters to be estimated. We assume the logistic distribution, therefore, and estimate it using the maximum likelihood method. Beck et al. (Citation2008) criticized previous studies for not accounting for unobserved heterogeneity: some organizations or teams may have a higher inherent propensity to change than others. To correct for this, one has to use panel data (instead of cross-sectional data) and estimate a fixed-effects model. Therefore, our function F becomes
, where μi are team fixed effects that control for unmeasured factors (i denotes a team) and we estimate the fixed-effects logit model. Therefore, no bias arises since μi team fixed effects capture all time-constant team-specific unobserved heterogeneity such as team’s change propensity. A vector x consists of the number of previous changes, the coach’s age, and the team’s win–loss percentage.
4. Results
Table presents the results of the estimation of the football coach replacement. The table includes two models to illustrate the difference in models with and without fixed effects. The first column presents a pooled model without fixed effects and second column presents a panel data model with fixed effects. Therefore, our main results are in the second column. Indeed, the first column points to the shortcomings of the previous studies: the coefficient on the number of previous changes is insignificant. However, the fixed effects panel data binomial logit estimation gives negative and significant coefficients confirming Beck et al. (Citation2008) deceleration hypothesis: prior changes of a given type decrease the likelihood of a subsequent change of the same type while controlling for unobserved heterogeneity. In addition, if a team was successful, as reflected by a high win–loss percentage, the probability of replacing the coach significantly decreases. Also, older coaches were more likely to be replaced.
Table 2. Estimation Results
5. Robustness Check: Duration Analysis (Survival and Hazard Curves)
We use a hazard model to estimate the time it takes for a change to happen. One can expect that the longer the time after the last change, the more likely it is that a coach will be replaced the following year. On the other hand, if a coach has remained unchanged for a long period of time, it may signal his high quality (an effective coach) and hence the less likely it is that there will be a change in the near future. Alternatively, a long period with no change may suggest that it is difficult to introduce change. Duration analysis is the preferred method to estimate such phenomena because of its ability to handle right-censored data—we do not observe changes beyond the end of our data.
Duration analysis is sometimes called “time until failure” since it was originally used by engineers to test durability of devices or biomedical researchers to test survival rates after medical procedures. Only relatively recently, social scientists have discovered the usefulness of duration analysis in modeling, for example, time until business failure (e.g. Bandopadhyaya & Jaggia, Citation2001), length of unemployment spells (e.g. Kupets, Citation2006), or intervals between purchases (Raymond, Beard, & Gropper, Citation1993). Closer to our topic, Audas, Dobson, and Goddard (Citation1999) used a hazard function model to estimate involuntary and voluntary coaches’ job termination for English professional soccer and found team’s performance, league position, and managerial and coach’s experience to influence the termination hazard. Scully (Citation1994) used hazard functions to estimate the tenure for baseball, basketball, and football coaches and found managerial efficiency (the ability of the coach to extract the largest win percentage from a given set of player inputs) to be a good predictor of managerial survival.
To proceed more formally, let T be a nonnegative random variable representing the waiting time until the change occurs. We will assume that T has a continuous probability distribution f(t), where t is a realization of T (Greene, Citation2003). We define a duration spell of n observations as the time it takes for the change to occur (or censored time at the end of the data): t1, t2, …, tn. The cumulative distribution function (c.d.f.) is F(t) = Prob(T ≤ t) = . Its complement S(t) = 1 − F(t) = Prob(T ≥ t) is called the survivor function and defined as. For example, S(5) is the probability that the spell is of length at least 5 or, in other words, the probability that a coach have not been changed for five years. Now, we can define the hazard rate as the conditional probability that a coach will be changed in a short time interval following period t, given that it was not changed (survived) up to period t: λ(t) = f(t)/S(t). We say that the hazard rate is the rate at which spells are completed after duration t, given that they last at least until t. Note that since we have to end our observation at a certain year, some spells will not end. Since we do not observe the end of the spell, our data for that observation are “right censored.”
Our dependent variable measures the length of time between changes: how long coaches “survive” between changes. As explained above, this variable is called a “spell,” and it is simply the number of years for which teams “survive” without change (it takes a value of 1 in the year following the change, a value of 2 in the next year, and so on). We want to show how our covariates (as regressors are usually called in the duration literature) affect the duration of spells at any particular time (how they affect the “hazard of dying”, i.e. changing coaches).
We present estimations of the hazard and survivor functions using the Kaplan–Meier estimator (assuming nothing about the underlying distribution of duration spells and without considering any covariates), followed by the estimations of the logistic hazard models. The survival function (Figure ) indicates that less than 10% of the spells lasted more than 12 years.Footnote2 The hazard rate (Figure ), which is the probability that a team will replace its coach given that it has not done it from 1 to 12 years, is pretty stable and ranges from .14 to .30. We present the results of the estimation of the replacement of football coaches Cox’s proportional hazard model in Table .
Figure 2. Estimated survival function for coach replacement.
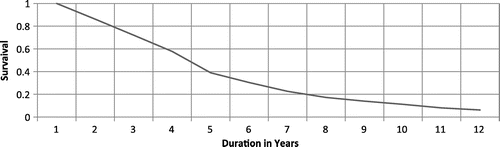
Figure 3. Kaplan–Meier hazard function (time to change team’s coach).
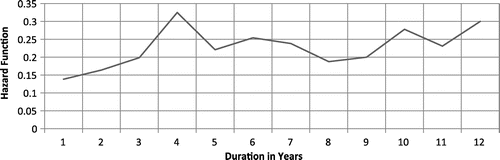
Table 3. Cox’s Proportional Hazard Model (t-statistics are in Parenthesis).
The estimates of the logistic hazard model confirm our results from the logistic model. The time between coaches’ replacements (the number of years from the last change) is statistically significantly longer if there were more changes in the past (since, as reported in Table , the probability of change in any given year was lower). The negative coefficients on the win–loss percentage in Table suggested that the probability of coach replacement in any given year when a team was successful is lower. However, job offers are more likely to be made to successful managers or coaches (Audas et al., Citation1999). This may explain the negative coefficients on the win–loss percentage in Table (the time between the changes is lower for more successful teams).
6. Discussion and Conclusions
The goal of this study was to find how the probability of future organizational change is affected by the number of previous changes of the same type controlling for the surrounding environment. We investigated change in organizations using data on the US NFL coaches’ replacement. There is no agreement in the literature about the effect of the number of previous changes on the propensity to change and two opposite theories exist. Most cited is the repetitive momentum hypothesis positing that numerous prior changes of a given type increase the likelihood of a subsequent change of the same type. However, more recently, Beck et al. (Citation2008) proposed the deceleration hypothesis that states that prior changes of a given type decrease the likelihood of a subsequent change of the same type. We have found evidence in favor of Beck’s et al. (Citation2008) deceleration hypothesis: teams that replaced their coaches many times in the past were less likely to change them in the future. However, this effect can only be uncovered when proper methodology is used to avoid confounding effects. The fixed-effects logit model allows one to avoid the bias due to unobserved heterogeneity and is instrumental in providing support for the deceleration hypothesis.
Our results also suggest that a football team is less likely to replace its coach when the team is successful (high win/loss ratio) and more likely to replace its coach when the coach is older.
6.1. Limitations
The question remains whether studying behavior of football teams generalize to other organizations as suggested by previous authors exploring sport markets (e.g. Bell, Brooks, & Markham, Citation2013). However, even if the generalization is limited, we think that shedding light on behavior of football teams is of sufficient economic, social, and cultural importance to justify study on its own (as also noted by Audas et al. [Citation1999]). Many previous studies argued that the results obtained in analyzing behavior of sport teams may be extended to other organizations where obtaining data and clear results are more difficult. One of the shortcomings of our analysis, which may call for further work, is that there may be a difference between voluntary and involuntary coach replacement that we do not take into account.
Therefore, further testing should be conducted by employing methodologies similar to ours and using data panning a broader spectrum of settings.
6.2. Implications
Subject to the limitations discussed above, our study makes an important contribution to the management literature by lending support for the deceleration hypothesis. It is one of few studies investigating change in organizations’ leadership, filling an important gap in the literature.
Our results have strong implications for future research on organization change by showing strong history dependence (e.g. frequency of changes and the passage of time between changes). Research that does not account for the organizational history and past experiences with change would provide an incomplete and potentially flawed picture of organizations (as also postulated by Amburgey, Kelly, & Barnett, Citation1993). Equally strong is evidence for using fixed effects while studying change. If omitted, the results may be incorrect and misleading.
Understanding why teams replace their coaches is important for achieving a truly unbiased assessment of its consequences. For example, Fizel and D’Itri (Citation1997) used data for college basketball teams and showed that when managers of losing teams are dismissed, the teams tend to do even worse. Hadley, Poitras, Ruggiero, and Knowles (Citation2000) analyzed the performance of the NFL teams and head coaches and showed that the efficient coaching can account for an additional three to four victories in any given season. These results could be tested by using a simultaneous examination of both the causes and consequences of coach replacement something that has not been done in the literature so far.
Finally, our results should also be of interest to the sport economics literature. In particular, the sport betting markets seek any information about teams (here, the change in team leadership) that may help to ultimately predict games’ outcome and the head coach can make a big difference in the team’s performance. Brady, Bolchover, and Sturgess (Citation2008) gave the example in soccer when coach Bill Shankly had built the foundations of Liverpool’s success, winning three League Championships. However, Liverpool did not win the European Cup until 1977, by which time Shankly’s assistant Bob Paisley had taken over.
Additional information
Notes on contributors
Agnieszka Bielinska-Kwapisz
Agnieszka Bielinska-Kwapisz is an assistant professor in the College of Business at Montana State University. With an MS in Mathematics, a PhD in Economics, and Six Sigma Master Black Belt Certification, her strength is in quantitative analysis as applied to a variety of problems in economics and business. Thus far, she has applied her skills to projects in the areas of Public Finance, Health Economics, Education, and Risk and Uncertainty. She published her research results in the National Tax Journal, Mathematical Social Sciences, Southern Economic Journal, Applied Financial Economics, Journal of Public Finance and Public Choice, Journal of Education for Business, Economics Research Education for Business, Economics Research International, and Journal of Studies on Alcohol. She has been successful in securing grants from the National Institutes of Health with (D.J. Young) and the National Academy of Sciences. She is a member of the Journal of Management and Finance Editorial Advisory Board (Gdansk, PL).
Notes
1. Wooden and Jamison (Citation2005). http://www.ted.com/talks/john_wooden_on_the_difference_between_winning_and_success.html. Accessed on November 16, 2013.
2. We present only the first 12 years since graphs are not meaningful at the end when the number of “at risk” spells is very small.
References
- Amburgey, T. L., Kelly, D., & Barnett, W. P. (1993). Resetting the clock. The dynamics of organizational change and failure. Administrative Science Quarterly, 38, 51–73.
- Audas, R., Dobson, S., & Goddard, J. (1999). Organizational performance and managerial turnover. Managerial and Decision Economics, 20, 305–318.10.1002/(ISSN)1099-1468
- Bandopadhyaya, A., & Jaggia, S. (2001). An analysis of second time around bankruptcies using a split-population duration model. Journal of Empirical Finance, 8, 201–218.10.1016/S0927-5398(01)00023-8
- Beck, N., Brüderl, J., & Woywode, M. (2008). Momentum or deceleration? Theoretical and methodological reflections on the analysis of organizational change. Academy of Management Journal, 51, 413–435.
- Beck, N., & Kieser, A. (2003). The complexity of rule systems. Experience and Organizational Learning, Organization Studies, 24, 793–814.
- Bell, A., Brooks, C., & Markham, T. (2013). The performance of football club managers: Skill or luck? Economics & Finance Research, 1, 19–30.
- Bercovitz, J., & Feldman, M. (2008). Academic entrepreneurs: Organizational change at the individual level. Organization Science, 19, 69–89.10.1287/orsc.1070.0295
- Brady, C., Bolchover, D., & Sturgess, B. (2008). Managing in the talent economy: The football model for business. California Management Review, 50, 54–73.10.2307/41166456
- Burnes, B., & Jackson, P. (2011). Success and failure in organizational change: An exploration of the role of values. Journal of Change Management, 11, 133–162.10.1080/14697017.2010.524655
- By, R. T. (2005). Organizational change management: A critical review. Journal of Change Management, 5, 369–380.
- Dacin, M. T., Goodstein, J., & Scott, W. R. (2002). Institutional theory and institutional change: Introduction to the special research forum. Academy of Management Journal, 45, 45–56.10.5465/AMJ.2002.6283388
- Delacroix, J., & Swaminathan, A. (1991). Cosmetic, speculative, and adaptive organizational change in the wine industry: A longitudinal study. Administrative Science Quarterly, 36, 631–661.
- Fizel, J. L., & D’Itri, M. (1997). Managerial efficiency, managerial succession and organizational performance. Managerial and Decision Economics, 18, 295–308.10.1002/(ISSN)1099-1468
- Greene, W. H. (2003). Econometric analysis (5th ed.). Upper Saddle River, NJ: Prentice Hall.
- Greenwood, R., & Hinings, C. R. (2006). Radical organizational change. In S. Clegg, C. Hardy, T. Lawrence, & W. R. Nords (Eds.), The sage handbook of organization studies (pp. 814–842). London: Sage.10.4135/9781848608030
- Hadley, L., Poitras, M., Ruggiero, J., & Knowles, S. (2000). Performance evaluation of national football league teams. Managerial and Decision Economics, 21, 63–70.10.1002/(ISSN)1099-1468
- Hammer, M., & Champy, J. (1993). Reengineering the corporation: A manifesto for business revolution. New York, NY: Harper Collins.
- Higgs, M., & Rowland, D. (2005). All changes great and small: Exploring approaches to change and its leadership. Journal of Change Management, 5, 121–151.10.1080/14697010500082902
- Kotter, J. (1990). A force for change: How leadership differs from management. New York, NY: Simon & Schuster.
- Kupets, O. (2006). Determinants of unemployment duration in Ukraine. Journal of Comparative Economics, 34, 228–247.10.1016/j.jce.2006.02.006
- McKinsey & Company. (2008, July 1–7). Creating organizational transformations. The McKinsey Quarterly. Retrieved November 19, 2013, from http://gsme.sharif.edu/~change/McKinsey%20Global%20Survey%20Results.pdf
- Ocasio, W. (1999). Institutionalized action and corporate governance: The reliance on rules of CEO succession. Administrative Science Quarterly, 44, 384–416.10.2307/2667000
- Pettigrew, A. M., Woodman, R. W., & Cameron, K. S. (2001). Studying organizational change and development: Challenges for future research. Academy of Management Journal, 44, 697–713.10.2307/3069411
- Raymond, J. E., Beard, T. R., & Gropper, D. M. (1993). Modelling the consumer’s decision to replace durable goods: A hazard function approach. Applied Economics, 25, 1287–1292.10.1080/00036849300000095
- Rogers, P., Meehan, P., & Tanner, S. (2006). Building a winning culture. Boston, MA: Bain.
- Scully, G. W. (1994). Managerial efficiency and survivability in professional team sports. Managerial and Decision Economics, 15, 403–411.10.1002/(ISSN)1099-1468
- Schulz, M. (1998). A model of obsolescence of organizational rules. Computational & Mathematical Organization Theory, 4, 241–266.
- Van de Ven, A. H. (1986). Central problems in the management of innovation. Management Science, 32, 591–607.
- Wooden, J., & Jamison, S. (2005). Wooden on leadership: How to create a winning organization (1st ed.). New York, NY: McGraw-Hill.