
 ?Mathematical formulae have been encoded as MathML and are displayed in this HTML version using MathJax in order to improve their display. Uncheck the box to turn MathJax off. This feature requires Javascript. Click on a formula to zoom.
Abstract
This paper uses an Italian firm-level panel data-set over the period 1994–2006 to investigate the nexus between corporate taxation and investment. Studying the effects of corporate taxation on investment at the micro level has two advantages. Firstly, investment is free of aggregation biases and secondly, the firm-level dimension allows asking whether the effects of corporate taxation differ across firms with different characteristics. In the empirical analysis, we employ a Generalized Method of Moments estimator, which permits us to handle not only the dynamic structure of the model and of the predetermined or endogenous explanatory variables, but also firm-specific factors, heteroskedasticity, and autocorrelation of individual observations. We find that corporate taxes distort investment decisions. The results are robust to the inclusion of many controls.
Public Interest Statement
This paper investigates the relationship between corporate taxation and investment choices. The linkage between corporate taxation and firm economic performance has received persistent attention in both the academic literature and policy debates. One of the main drivers of economic growth is investment and how corporate taxes affect investment behavior of firms is, indeed, a question of great importance. Our results suggest that corporate taxes play a relevant role in shaping firms’ investment propensity. As expected, findings support the debate on the high level of business taxation in Italy, which has been at the heart of the corporate tax reforms enacted starting from 1998. International tax competition calls for further reforms to lower firms’ tax burden to foster enterprises’ investment and competitiveness.
1. Introduction
The linkage between corporate taxation and firm economic performance has received persistent attention in both the academic literature and policy debates. One of the main drivers of economic growth is investment and how corporate taxes affect investment behavior of firms is, indeed, a question of great importance. It is well understood that company taxation can have large effects on firms’ investment decisions. Corporate taxes impinge directly on the incentive to accumulate capital and to perform research.
To tackle this issue, starting from the mid-80s many OECD countries have undertaken significant reforms of their business tax system under the general objective of reducing the distortionary effects of taxes on investment, in way to foster firms’ competitiveness and attract foreign investments (Johansson, Heady, Arnold, Brys, & Vartia, Citation2008).
The literature examining the effects of corporate taxation on investment is large and starting with Hall and Jorgenson (Citation1967), and Jorgenson (Citation1963), has attempted to assess the relevance of the tax distortions. Researchers, generally speaking, find adverse effects of corporate income taxes on investment, although studies differ with regard to the strength and magnitude of the influence. A small selection of studies includes Summers (Citation1981), Feldstein, Dicks-Mireaux, and Poterba (Citation1983), Auerbach (Citation1983, Citation2002), King and Fullerton (Citation1984), Auerbach and Hassett (Citation1992, Citation2002), Cummins, Hassett, and Hubbard (Citation1996), Djankov, Ganser, McLiesh, Ramalho and Shleifer (Citation2010). Chirinko (Citation2002), Hassett and Hubbard (Citation2002), and Hines (Citation2001, Citation2007) survey aspects of this literature. Fazzari, Hubbard, and Petersen (Citation1988) and Devereux and Griffith (Citation2003) point out that corporate taxes affect investment by reducing current period cash flow available to fund it.
Earlier empirical studies addressing the relationship between taxation and investment were based on aggregate data. However, as it is difficult to isolate effects of individual fundamentals on business investment from aggregate variables (that move together over the business cycle), recently, there has been a shift in attention away from macro modeling toward micro modeling. Such interest has also been driven by data availability, but also by increasing awareness of the inappropriateness of aggregate data if one wishes to understand the fundamental determinants of investment.
Studying the effect of corporate taxation on investment at the disaggregate level has two advantages. Firstly, investment is free of aggregation biases and secondly, the firm-level dimension of the data allows investigating whether the effects of corporate taxation differ across firms with different characteristics. Clearly, policy interventions on the corporate tax structure, by virtue of firms’ heterogeneity in the composition of their assets and the investments financing, induce heterogeneous effects across firms.
Another important issue to consider when analyzing the impact of corporate taxes on investment is the assumptions concerning the underlying investment model. Different models are commonly used in the literature and different predictions about the impact of tax policy on the level and timing of investment have been reached. Between these models, the q-based theory, the capital user cost approach, the Euler-based approach. A review of the literature on the range and results of different investment models is beyond the scope of this paper. The interested reader is referred to a number of studies that include Chirinko (Citation1993), Hubbard, Kashyap, and Whited (Citation1995), Gilchrist and Himmelberg (Citation1995), Audretsch and Elston (Citation2002), Behr (Citation2005), Bond, Klemm, Newton-Smith, Syed and Vlieghe (Citation2004), Chirinko and von Kalckreuth (Citation2003), and Dwenger (Citation2009).
To illustrate the relationship between corporate taxes and investment, researchers suggest considering two indicators, the marginal tax rate and the average tax rate. The first measures the effect of a corporation income tax on the cost of capital for a marginal investment, i.e. for which the marginal return equals the cost of capital. The marginal rate therefore deals with the effects of taxation on the level of investment, i.e. the extensive margin. The average tax rate measures the fraction of pre-tax value of a profitable (infra-marginal) investment project taken away by the corporation tax for profitable. This indicator relates to binary decisions over a set of mutually exclusive (similar) profitable opportunities available to the firm (for instance, the decision of a multinational firm over where locating investment or a decision regarding investment in a particular sector compared to others). In this respect, the average tax rate measures the impact of company taxes on the intensive margin.
Both indicators capture the potential distortion of a corporation tax on the size of investment. Furthermore, in order to take into account the main features of the business tax system (statutory rate, depreciation allowances, and tax credits), we consider the effective tax rates.
This paper presents a microeconometric analysis of the corporate taxation effects on investment in Italy for the period 1994–2006. Though Italy was somehow a latecomer to the tax-cut process that regarded many OCED countries, in this period, the country introduced two main reforms with the declared aim of reducing the tax-induced distortions on firms. Therefore, from a policy perspective, we believe Italy is an interesting case to study and to our knowledge, no empirical research exists addressing this issue for Italy.
Most existing empirical studies employ the cost of capital approach dating back to Jorgenson (Citation1963), Hall and Jorgenson (Citation1967), and King (Citation1974), and further developed by Devereux and Griffith (Citation1998, Citation2003). This method exploits variation of the tax adjusted user cost over time or across sectors to detect the impact on investment choices; thus, providing evidence on the corporate tax rates elasticity.
The approach we use in the paper is based on the one recently proposed by Egger, Loretz, Pfaffermayr, and Winner (Citation2009) to compute firm-specific effective (marginal, average) corporate tax rates. This approach echoes the standard methodology originally developed by Devereux and Griffith (Citation1998). Calculation of firm-specific tax rates incorporates information on the actual (observed from the data) company assets structure and its financial policy; thus, allowing a more accurate calculation of effective tax rates than the standard Devereux–Griffith procedure.
The analysis grounds on a panel of 880 firms for the period 1994–2006, built combining firms’ survey data available from several waves of the Survey on the manufacturing enterprises carried out by the Italian Banking Group Unicredit every three years, and company accounts.
Anticipating our main results, we find that: (i) corporate taxes have a negative effect on investment at the firm level and (ii) the negative effect of corporate taxes is not uniform across firms of different size and age.
The remainder of the paper is organized as follows. Section 2 presents the methodology to calculate firm-specific (average, marginal) tax rates, while Section 3 briefly discusses the main changes to the business tax system introduced in Italy in 1994–2006 and illustrates the trend in the effective company tax rates over this period. Then, Section 4 describes the data, whereas Sections 5 and 6 examine the econometric strategy and the related empirical results. Finally, Section 7 offers some concluding remarks.
2. Calculation of effective corporate tax rates
As said, the methodology to compute the effective corporate tax rates follows the approach proposed by Egger et al. (Citation2009) to calculate firm-specific tax rates. The idea behind this framework is to compute the tax burden falling on a hypothetical investment project incorporated into a neoclassical investment model by taking into account the main determinants of the corporate (statutory tax rates, tax allowances, specific investment tax credits) and the personal tax system. Because these rates focus on firms’ incremental investment decisions, they are also defined as forward-looking tax rates, opposed to backward-looking tax measures which are based on past investment decisions observed on actual data. Therefore, they have the great advantage of being independent of tax planning activities of the company and are exogenous from company’s actual investment and financing decisions.
Below, we outline the basic features of the model in the case of a domestic investment. In line with most studies, we adopt the same notation of Devereux and Griffith (Citation1998).
Let consider a firm that at time t increases its capital stock by one unit. At time t + 1, this investment is worth (1 − δ) (1 + π) where δ is the depreciation rate and π the inflation rate. Following Devereux and Griffith (Citation1998), we assume the company maintains its capital stock constant in subsequent periods. The investment return at time t + 1 can be expressed as (p + δ) (1 + π), where p is the real financial rate of return of the investment.
As well known from Modigliani and Miller (Citation1958), in the absence of taxation the net present value of the economic rent produced by the investment (R*) will be independent form the source of finance (equity, debt) and can be expressed as follows:(1)
(1)
where r measures the real interest market rate.
The introduction of the tax system changes this result and the post-tax net present value will depend on how the investment is financed. Specifically, we can derive three equations for the net present value in the case of retained earnings, issues of new shares, debt financing. For the sake of exposition, these equations are not reported here and we refer to the original work of Devereux and Griffith (Citation1998).
The empirical analysis of this paper uses two types of effective tax rates, the marginal (EMTRs) and the average tax rates (EATRs). The first measure how taxation affects the marginal unit, the one for which the return equals the marginal cost, while the second relate to how taxation affects the inframarginal units, i.e. the ones for which the return of the investment is greater than the marginal cost.
The two indicators respond to different purposes. EATRs analyze how the tax system influences binary choices decisions of the company, for instance, the choice a firm faces when deciding whether or not to undertake a specific type of investment, or the choice of a multinational when deciding between a given number of mutually exclusive locations for its investment. More generally, in binary choices, given a net present value of the investment, the firm evaluates the impact of taxation on the post-tax present value for each choice.
Then the size of investment is modeled as a marginal choice and in this case, the relevant indicator is the EMTR. Indeed, this measures how taxation affects the marginal unit, for which the return equals the marginal cost.
Specifically, EATRs measure the average tax burden on an investment giving a predefined rate of profitability. EATRs are calculated as the difference between the pre-tax net present value of investment R* (Equation 1) and its after-tax net present value (R) over the pre-tax rate of return on capital, defined by the ratio between the rate of profitability p and (1 + r), where r is the market interest rate.
Formally, we have(2)
(2)
Given the cost of capital, that is the before-tax rate of return of a marginal investment, computed again from the equations of the investment net present value, EMTRs are calculated as:(3)
(3)
where p′ is the cost of capital and r′ = r as we abstract from shareholders’ taxation.Footnote1
As said, the methodology allows computing firm-specific effective tax rates.
Below, we report the parameters used in the calculation of EATRs and EMTRs, grounded on the relevant literature (see for instance again Egger et al., Citation2009):
| number1. | p = 0.20; | ||||
| number2. | r = 0.05; | ||||
| number3. | π = 0.025. | ||||
Furthermore, we assume the following rates of economic depreciation:
| number4. | machinery δm = 0.01225; | ||||
| number5. | building δb = 0.0361; | ||||
| number6. | intangible assets δI = 0.15; | ||||
| number7. | inventories δinv = 0. | ||||
Computation of firm-specific tax rates comes from the use of weights reflecting the actual (based on information available in the data-set) company assets structure and its financial policy.
The first is used in the calculation of the net present value of economic depreciation ratesFootnote2 (see Equation 11 in Egger et al., Citation2009) and the second one when weighting the combinations of financing opportunities to obtain overall measures of EMTRs and EATRs. Specifically, we assume companies have two choices, equity capital and debt. Choices are weighted on the basis of the actual debt–equity ratio computed for each firm considering accounts data available in the data-setFootnote3 and therefore reflecting the companies’ actual financial policy. Again, for the sake of exposition, we refer to Egger et al. (Citation2009) for the various equations of R* entering the calculation of EATRs and the expression of the cost of capital in the calculation of EMTRs.
The following section reports average and marginal tax rates computed for the period 1994–2006.
3. The corporate tax reforms in Italy: an overview
Starting from the mid-80s, many OECD countries reformed their corporate tax systems to reduce the nominal tax rates on firms. Moreover, this trend shows no sign of stopping.
Reductions in the statutory corporate tax rates were deemed desirable in order to reduce the distortionary effects of corporate taxation on investments, to foster firms’ competitiveness, as well as to attract foreign investments. However, in order to preserve the overall tax revenue, in most countries, reductions in nominal tax rates were often combined with a widening of the tax base, achieved through a less-generous application of depreciation practices and eliminations or reductions in specific tax credits.
Italy was somehow a latecomer to the corporate tax rates cut reforms. Indeed, from its inception in the early 1970s, its business income tax regime changed only marginally for over 20 years and until the mid-90s, Italy moved in the opposite direction than other industrialized countries, actually increasing the corporate tax rate mainly due to its budgetary constraints. In 1994, the first year under consideration in this paper, the system contemplated a corporate income tax (IRPEG) with a rate of 37%, an additional local profits tax (ILOR) with a rate of 16.2%, a tax on the company net assets of 0.72%. The combined rate amounted to 53.95%, among the highest in Europe.
Then in the period between 1994 and 2006, the corporate tax system underwent two major reforms, one in 1998 and the other one in 2004, both with the declared objective of reducing the tax burden on firms and simplifying the whole system. Recently, in 2012, the system was reformed once again, but effects of this reform are outside the scope of this paper due to lack of data.
The primary objective of the 1998 reform was a selective reduction in the burden of taxation aimed at narrowing the tax distortion between equity and debt financing, existing in the previous regime (as well as in any system that provides interest costs deductibility). To this end, the main change enacted by the reform was the introduction of the Dual Income Tax (DIT) system in replacement of the previous uniform tax rate system. The new regime also set the abolition of the local tax on profits and net assets, and the introduction of a regional tax (IRAP) on firms’ value added,Footnote4 with a rate of 4.25% in replacement of the repealed taxes. The DIT scheme remained in place until its repeal at the beginning of 2004, although some modifications were introduced in July 2001 in order to rein in its effects.
The DIT system was an Allowance for Corporate Equity and worked as a dual-rate schedule where overall profits are divided into two components. The first approximates normal profits or ordinary income, which is the opportunity cost of new financing with equity capital, compared to other forms of capital investments, and taxed at the preferential rate of 19%. The second component of overall profits is computed residually from total profits after ordinary income and represents business extra profits. Such profits are taxed at the prevailing statutory rate, 37% from 1998 to 2000 then cut to 36% in 2001.
From 1998 to 2000, the combined overall company tax rate was 41.25%, reduced to 40.25% in 2001–2002 though the ‘effective’ statutory tax rate could be much lower depending on the amount of profits qualifying for the DIT allowance (Oropallo & Parisi, Citation2007).
In order to speed up the impact of the reform on firms’ activity, in the years 1999–2001, a temporary (both to corporations and unincorporated firms) incentive for investments in new instrumental goods financed through company’s own capital was enacted. The effects of this provision therefore cumulated with the DIT allowance: new investments financed through capital benefited from a tax credit, while their return was eligible to a reduced statutory tax rate.
In July 2001, when a new government came into power, some modifications to the DIT scheme were enacted under the purpose of lessening its effects (see Oropallo & Parisi, Citation2007 for details) and a new temporary (for 2001 and 2002) investment tax incentive was enacted in substitution of the previous one. Furthermore, the statutory tax rate was cut from 36 to 34% in 2003. Actually, such changes anticipated the intention of the (new) policy-maker to repeal the dual-rate allowance, as it was at the beginning of 2004 when a new tax reform came into effect.
The 2004 reform moved back to a uniform tax rate system with a statutory rate of 33%. The new regime set some changes to the definition of the corporate tax base by introducing a participation-exemption regime and by removing the full imputation of dividends, and brought in an optional consolidated tax statement for corporate groups, in this way attaining, in the policy-maker’s proposals, simplification in the tax base computation.
The 2004 system remained in place until 2012 when an ACE allowance (Aiuto per la Crescita Economica), similar to the DIT scheme, was reintroduced.Footnote5 As said above, the effects of this reform are beyond the scope of this paper because of lack of data.
Figure displays the statutory corporate tax rate and the average, marginal tax rates calculated using the methodology described in Section 2.
Figure 1. Statutory corporate tax rates, effective average (EATR), and marginal (EMTR) corporate tax rates (Years 1994–2006).
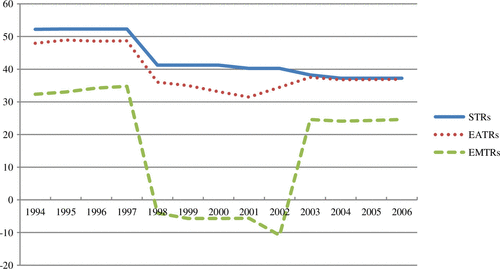
In the whole period, the global corporate statutory tax rate declines from 53.95 to 31.40%.
The EATR exhibits a significant fall (about 8% points) in 1998 due to the introduction of the DIT system and IRAP, given the abolition of ILOR and the tax on company net assets existing in 1997. The strengthening of the DIT scheme along with the introduction of the tax credit for equity-funded investments, further reduce the EATR from 36.5% in 1998 to 32.1% in 2001.
The EMTR follows the same descending trend, falling from 34.8% in 1997 to only 2% in 1998. It becomes even negative in 1999–2001: the DIT scheme and the investment tax relief strongly reduced the cost of capital for equity-funded marginal investments (i.e. for which the return equals the marginal cost) and taxation at the margin actually turns into a subsidy.Footnote6
The modifications to the DIT scheme enacted in 2001 along with the introduction of a new investments tax reliefFootnote7 in substitution of the previous one increase the EATR in 2002 and 2003. Because of the generous operation of the new investment incentive (that applies to both equity and debt-funded investments) the cost of capital for marginal investments further decreases resulting in a lower (−19%) EMTR in 2002 compared to 2001.
The 2004 reform reduces the EATR from 37.6 to 36.8%. Here, we have to note that some changes enacted with the 2004 reform cannot be incorporated in the calculation of the effective tax rates (for instance the participation-exemption regime and group tax consolidation); therefore, in 2004–2006, we expect the EATR to be slightly lower than the one reported in Figure .
4. Data and descriptive statistics
The empirical analysis, based on a panel data-set, covers the years 1994–2006. Data combine company accounts and firm survey data available from the Unicredit Bank. The data collection started in 1972 and has been performed through a questionnaire submitted to a sample of firms of the manufacturing sector every three years. Size class, geographical area, and industry to be representative of the population of Italian manufacturing firms with more than 10 employees stratify the sample.Footnote8 Company accounts are collected by CERVED, a consortium of private equity funds that evaluates businesses reliability and their financial structure, and are available for the entire corporate sector (about 700,000 companies) and throughout the entire period considered in this paper.
The final data-set contains information on firm’s features (size, employment structure, legal status, participation in groups), and firm’s activities (investments, internationalization, finance). The company accounts cover the information needed to compute the firm-specific corporate (marginal and average) tax rates, as explained in Section 2.
Table displays a breakdown of companies present in the panel by Pavitt (Citation1984) industrial taxonomy and size (number of employees).
Table 1. Number of companies present in the data-set by Pavitt sector and firm size
The data-set includes 880 companies. The majority of firms belong to traditional and special sectors. About 65% of the sample by international standards can be classified as small–medium companies (with up to 100 workers), in line with the well-known features of the Italian manufacturing sector.
Table illustrates the main statistics of the variables used in the analysis (mean value, the standard deviation, the minimum, and the maximum value).
Table 2. Summary statistics (mean values, standard deviation in italics) for investment on capital stock, cash flow on total assets, debt-to-equity ratio, sales on total assets
The variable It/Kt − 1 represents the investment rate, i.e. gross investment (purchase of material goods in the year t) normalized by the beginning-of-the period capital stock (total amount of material goods at time t − 1).
The remaining variables define, respectively, the company cash flow over total assets (CFt/At − 1), the short-term debt–equity ratio (SDt/At − 1), the long-term debt–equity ratio (LDt/At − 1), defined by the ratio of (short term, long term) financial debts over total assets, the ratio between sales and total assets (St/At − 1). In all cases, total assets are measured at the beginning of the period (time t − 1) while cash flow, debts, sales are measured at time t.
5. The econometric strategy
In line with the recent literature on investments, we estimate a firm-level investment equation that relies on the Euler equationFootnote9 of the standard neoclassical model of capital accumulation subject to symmetric and quadratic adjustment costs.Footnote10 Corporate taxes enter through the firm-specific tax rate. As explained, we adopt EATR and EMTR as tax indicators.
Our empirical specification is the following:
where the dependent variable is the investment rate, .
and
are, respectively, the lagged dependent variable and its square. The lagged dependent variable captures the dynamic adjustments of the investment rate to changes in the other covariates included in the model. We expect that the coefficient on the linear lagged value is positive, while the coefficient on its square negative, reflecting adjustment costs (Becker & Sivadasan, Citation2010).
EATR and EMTR define, respectively, the effective average and marginal tax rates. In the estimation, EATR and EMTR are included separately as regressing the two tax rates simultaneously causes problems with the model identification because they are necessarily collinear.
is the output measured by firm-specific turnover deflated by an industry-specific output price deflator to firm assets. The output-to-asset ratio controls for imperfect competition or decreasing returns to scale.
is the ratio of the lagged value of cash flow to firm assets. The cash flow is included to estimate the impact of financial constraints on investment spending. Indeed, it acts as a measure of frictions involved in the allocation of resources to firms and enables to capture the effects of financial market imperfections (Fazzari, Hubbard, & Petersen, Citation1988; Fazzari, Hubbard, Petersen, Blinder, & Poterba, Citation1988). Because corporate taxes affect cash flow, cash flow is a potentially relevant channel through which corporate tax policies affect firms’ investment activities.
and
are, respectively, the short- and long-term financial debts relative to firm assets. Theoretical prediction suggests that a high debt ratio affects negatively investment because it increases the firm systemic risk. To account for possible differences due to the debt maturity, we include the ratio of both short-term and long-term debt.
Finally, εi, t is an idiosyncratic unobservable shock that affects firm i’s decision concerning investment expenditure in year t.
In the estimation, we use additional instrumental variables, which are not part of Equation 1, namely, firm size (log), export status, a dummy for firm localization (North–East, North–West, Center and South of Italy).
All estimates are obtained using a two-step system GMM estimator with finite-sample correction and robust standard errors. More specifically, we employ the system GMM estimator outlined by Arellano and Bover (Citation1995) and improved by Blundell and Bond (Citation1998).Footnote11
This estimator allows handling not only the dynamic structure of the model and predetermined or endogenous explanatory variables, but also the “unobserved heterogeneity” present in the firm-level data-set, heteroskedasticity, and autocorrelation of individual observations.Footnote12 As well known, the GMM has a potential advantage in dealing with endogeneity and simultaneity of the right-hand side variables with the error term using past variables as instruments for endogenous variable. Dealing with endogeneity is particularly important in this context because the tax rates, the lagged investment ratio, its square are chosen simultaneously with the investment level. Therefore, we treat these variables as potentially endogenous and we use two lags. Furthermore, as instrumental variables we include cash flow, short- and long-term debts, export, log of size, age, the geographical area.
6. Empirical results
Table shows the results from the dynamic panel data model.
Table 3. Effects of corporate taxes (EATR, EMTR) on investments. Dynamic panel-data estimation (GMM)
All the coefficients have the expected sign. Results clearly show that taxes distort firm-level investment: coefficients of EATR and the EMTR are both negative and statistically significant.
The EATR has an estimated parameter of -11.17. This value implies that a one-percentage-point increase in the average tax rate is associated with a −0.112% point’s decrease in the investment/fixed asset ratio, suggesting that the impact of corporate taxes on investment is relevant.
The estimated coefficient for EMTR is −1.66: meaning that a one-percentage-point increase in the marginal tax rate is associated with a −0.017% point’s decrease in the investment/fixed asset ratio. Let note that the EATR has a larger coefficient than the EMTR and this can be attributed to the differential impact of the two taxes on investment dynamics. As discussed, the EMTR measures the effects on marginal investment decisions while the EATR captures discrete investment choices. If the EMTR yields lower elasticities than the EATR, it indicates that taxes matter more at the extensive margin than at the intensive margin. Sunk costs can lead to investment behavior hysteresis even in the case of reduced profits because of higher taxation. Investment tends to be more responsive to the average tax indicator.
The lagged investment-to-capital ratio enters positively (about 1.71 for both estimated equations), its square negatively (−0.002 for both indicators). These results show that the actual investment ratio depends on last year’s investment ratio and reflects increasing costs as the firm undertakes additional investment or disinvestment. The estimated values of the adjustment cost parameters suggest that adjustment costs play an important role in explaining the patterns of firm’ investment.
Output, S, exhibits a significantly positive coefficient (0.4 for both estimated equations) exerting a positive effect on firm-level investment rates. As might be expected, a high turnover indicates that the firm’s market share is relevant and this implies higher investments. Furthermore, this result is consistent with the presence of imperfect competition.
The estimated coefficients for short- and long-term debts are negative and significantly different from zero in both exercises. As expected, the effect of longer debt is stronger, supporting the liquidity risk hypothesis. Furthermore, long-term debt limits firms from exploiting new investment opportunities. This finding is in line with the agency theory prediction on the negative relation between leverage and investment. Thus, our results provide strong evidence that the level of debt and its maturity affect firms’ investment policy. Indeed, according to the European Commission (Citation2008), Italian firms are more exposed to debt than other European companies are. The IMF (Citation2009) has underlined excessive exposure of Italian firms also. This seems to endorse our findings about the behavior of Italian firms over the period considered.
It is worth noting that a significant positive cash flow effect in the case of EATR reflects the presence of imperfections in credit markets that prevents firms from being able to undertake an efficient amount of investment. In contrast, cash flow seems not relevant in the case of EMTR. This result appears plausible from a theoretical standpoint.
Investment–cash flow sensitivities are a standard metric in the literature that examines the impact of financing imperfections on corporate investment. Indeed, a rich empirical literature has tested this hypothesis (see, among others, Audretsch & Elston, Citation2002; Bond, Elston, Mairesse, & Mulkay, Citation2003; Fagiolo & Luzzi, Citation2006; Musso & Schiavo, Citation2008; Oliveira & Fortunato, Citation2006). However, financial constraints are one of the possible interpretations of significant coefficients on the cash flow variables. If investment depends on expected future sales and if cash flow acts as a proxy for these omitted expected future profitability variables, cash flow coefficient would be significant even in the absence of financing constraints (e.g. Kaplan & Zingales, Citation1997, Citation2000).
One of the control variables (not reported in the table) is firm age, which is not significant. This suggests that: (i) young firms are generally less profitable and therefore less affected by corporate taxation; or/and (ii) among young firms, there is a disproportionately high share of small firms that might benefit from exemptions or reduced rates.
The consistency of the GMM estimator depends on the validity of the assumption that the error terms do not exhibit serial correlation and on the validity of the instruments. To address the issues, we use the specification tests suggested by Arellano and Bond (Citation1991), Arellano and Bover (Citation1995), and Blundell and Bond (Citation1998).
The tests on first- and second-order autocorrelation suggest that the models are correctly specified, as the null hypothesis of no second-order serial correlation in the differenced error term cannot be rejected. Failure to reject the null hypotheses of both tests Sargan and Hansen, gives support to our model as shown in Table .
7. Concluding remarks
This paper sheds light on the importance of corporate taxation on firm investment choices. We illustrate how differently a change in the effective average and marginal tax rates affects investment at firm level. To this end, we compute firm-specific forward-looking effective tax rates for a panel of Italian companies for years 1994–2006. Results suggest that increases in the tax parameters cause a fall in the investment ratio, both at the extensive and at the intensive margins, though with a different weight. In line with the literature, cash flow and leverage play a relevant role in shaping investment behavior.
As expected, our findings support the debate on the high level of business taxation in Italy, which has been at the heart of the corporate tax reforms enacted starting from 1998. International tax competition calls for further reforms to lower firms’ tax burden to foster enterprises’ investment and competitiveness.
Acknowledgments
The authors would like to thank the Editor and two anonymous referees for their useful comments and suggestions. Daniela Federici wishes to thank the Honors Center for Italian Universities (H2CU). The usual disclaimer applies.
Additional information
Funding
Notes on contributors
Valentino Parisi
This contribution is part of a wider research project concerning the effects of corporate taxation on entrepreneurship dynamics. The research interest is motivated by new insights in the light of the recent literature which emphasize the role of heterogeneity within firms. Our focus has been the role of corporate taxation in shaping investment as well export behavior at the firm level. The effect of corporate taxes on investment and entrepreneurship is one of the central questions in both tax policy and economic growth.
Notes
1. This is in line with the literature (see Devereux & Griffith, Citation1998; Egger et al., Citation2009). Indeed, considering that other companies own a relevant part of companies and that this choice cannot be modeled, personal taxation may not be so relevant and could lead to biased estimates of effective tax rates.
2. We calculate the share of tangible fixed assets, intangible fixed assets, and stock of current assets over total assets, for each firm.
3. The debt–equity ratio is the ratio between current and non-current liabilities and company total assets. From the analysis, we exclude firms for which the debt–equity ratio is negative or greater than 1.
4. This is a regional tax paid by corporations and unincorporated firms on their value added net of depreciation and amortizations, i.e. with no deduction of interest expense and labor costs from the tax base. Therefore, IRAP strengthens the neutrality features of the overall corporate tax system.
5. In the actual system, the statutory rate is 27.5%. Normal profits derive from net annual capital increase multiplied by the imputed rate of 3% and are deducted from taxable profits in line with the ACE scheme.
6. Calculation of effective tax rates is exogenous from the actual behavior of firms and therefore, implicitly assumes that firms are eligible to the DIT allowance and the investment provision. Obviously, if this was not the case, the effective tax rates would be higher: in 2001 39.2% (EATR) and 26.2% (EMTR).
7. As explained in Section 2, the changes enacted in 2001 strongly weakened the DIT allowance which was also made optional to the new (and generous) investment tax relief. Calculation of the effective tax rates reflects the assumption that companies opt for the tax credit rather than the DIT system.
8. The sample is representative of the Italian economic structure.
9. The application of the Euler equation to the analysis of firm-level investment is motivated by the need of incorporating expectations about the future profitability of investment plans. Firms’ optimal investment path is estimated by removing the shadow value of capital (by equating the Euler equation to the first-order conditions for investments) and substituting expected values by their realized values.
10. Following the literature on dynamic investment functions, firm assets weight the dependent and independent variables (except the dummy variables).
11. To implement the system GMM estimator, we use the xtabond2 command in STATA introduced by Roodman (Citation2009). Although the two-step estimator is asymptotically more efficient, the reported standard errors tend to be downward biased (Arellano & Bond, Citation1991; Blundell & Bond, Citation1998). To compensate, xtabond2 makes available a finite-sample correction to the two-step covariance matrix derived by Windmeijer (Citation2006). This can make two-step robust estimations more efficient than one-step robust, especially for system GMM.
12. For a review on GMM methods and a comparison of its performance with OLS and panel data regression (fixed and random effects), see Roodman (Citation2009).
Related Research Data
References
- Arellano, M., & Bond, S. (1991). Some tests of specification for panel data: Monte Carlo evidence and an application to employment equations. The Review of Economic Studies, 58, 277–297.https://doi.org/10.2307/2297968
- Arellano, M., & Bover, O. (1995). Another look at the instrumental-variable estimation of error-components models. Journal of Econometrics, 68, 29–51.https://doi.org/10.1016/0304-4076(94)01642-D
- Audretsch, D. B., & Elston, J. A. (2002). Does firm size matter? Evidence on the impact of liquidity constraints on firm investment behavior in Germany. International Journal of Industrial Organization, 20(1), 1–17.https://doi.org/10.1016/S0167-7187(00)00072-2
- Auerbach, A. J. (1983). Taxation, corporate financial policy and the cost of capital. Journal of Economic Literature, 21, 905–940.
- Auerbach, A. J. (2002). Taxation and corporate financial policy. In A. Auerbach & M. Feldstein (Eds.), Handbook of public economics (Vol. 3, pp. 1251–1292). Amsterdam: North-Holland.
- Auerbach, A. J., & Hassett, K. (1992). Tax policy and business fixed investment in the United States. Journal of Public Economics, 47, 141–170.
- Auerbach, A. J., Hassett, K. (2002). Taxation and economic efficiency. In A. Auerbach & M. Feldstein (Eds.), Handbook of Public Economics (Vol. 3, pp. 1347–1421). Amsterdam: Elsevier.
- Becker, B., & Sivadasan, J. (2010). The effect of financial development on the investment-cash flow relationship: Cross-country evidence from Europe. The B.E. Journal of Economic Analysis & Policy, 10(1), 1–49.
- Behr, A. (2005). Investment, q and liquidity. Evidence for Germany using firm level panel data. Jahrbuecher für Nationaloekonomie und Statistik, 225, 2–21.
- Blundell, R. W., & Bond, S. R. (1998). Initial conditions and moment restrictions in dynamic panel data models. Journal of Econometrics, 87, 115–143.https://doi.org/10.1016/S0304-4076(98)00009-8
- Bond, S., Elston, J., Mairesse, J., & Mulkay, B. (2003). Financial factors and investment in Belgium, France, Germany, and the United Kingdom: A comparison using company panel data. Review of Economics and Statistics, 85, 153–165.https://doi.org/10.1162/003465303762687776
- Bond, S., Klemm, A., Newton-Smith, R., Syed, M., & Vlieghe, G. (2004). The roles of expected profitability, Tobin’s Q and cash flow in econometric models of company investment ( Working Paper No. 04/12). London: Institute for Fiscal Studies.
- Chirinko, R. S. (1993). Business fixed investment spending: Modeling strategies, empirical results, and policy implications. Journal of Economic Literature, 31, 1875–1911.
- Chirinko, R. S. (2002). Corporate taxation, capital formation, and the substitution elasticity between labor and capital (CESifo Working Paper No. 707). Munich: CESifo.
- Chirinko, R. S., & von Kalckreuth, U. (2003). On the German monetary transmission mechanism: Interest rate and credit channels for investment spending ( Discussion Paper CESifo No. 838). Munich: CESifo.
- Cummins, J. G., Hassett, K. A., & Hubbard, R. G. (1996). Tax reforms and investment: A cross-country comparison. Journal of Public Economics, 62, 237–273.https://doi.org/10.1016/0047-2727(96)01580-0
- Devereux, M., & Griffith, R. (1998). The taxation of discrete investment choices (IFS Working Paper 98/16). London: IFS.
- Devereux, M., & Griffith, R. (2003). Evaluating tax policy for location decisions. International Tax and Public Finance, 10, 107–126.https://doi.org/10.1023/A:1023364421914
- Djankov, S., Ganser, T., McLiesh, C., Ramalho, R., & Shleifer, A. (2010). The effect of corporate taxes on investment and entrepreneurship. American Economic Journal Macroeconomics, 2, 31–64.https://doi.org/10.1257/mac.2.3.31
- Dwenger, N. (2009). Corporate, taxation and investment: Explaining investment dynamics with firm-level panel data (Discussion Papers). Berlin: DIW.
- Egger, P., Loretz, S., Pfaffermayr, M., & Winner, H. (2009). Firm-specific forward-looking effective tax rates. International Tax and Public Finance, 16, 850–870.https://doi.org/10.1007/s10797-009-9124-1
- European Commission. (2008). Study on effects of tax systems on the retention of earnings and the increase of own equity. Unpublished.
- Fagiolo, G., & Luzzi, A. (2006). Do liquidity constraints matter in explaining firm size and growth? Some evidence from the Italian manufacturing industry. Industrial and Corporate Change, 15, 173–202.
- Fazzari, S., Hubbard, R. G., & Petersen, B. (1988). Investment, financing decisions, and tax policy. American Economic Review, 78, 200–205.
- Fazzari, S., Hubbard, R. G., Petersen, B. C., Blinder, A. S., & Poterba, J. M. (1988). Financing constraints and corporate investment. Brookings Papers on Economic Activity, 1, 141–206.https://doi.org/10.2307/2534426
- Feldstein, M., Dicks-Mireaux, L., & Poterba, J. (1983). The effective tax rate and the pretax rate of return. Journal of Public Economics, 21, 129–158.https://doi.org/10.1016/0047-2727(83)90047-6
- Gilchrist, S., & Himmelberg, C. (1995). Evidence on the role of cash flow for investment. Journal of Monetary Economics, 36, 541–572.https://doi.org/10.1016/0304-3932(95)01223-0
- Hall, R. E., & Jorgenson, D. (1967). Tax policy and investment behavior. American Economic Review, 57, 391–414.
- Hassett, K., & Hubbard, R. G. (2002). Tax policy and business investment. In M. Feldstein & A. Auerbach (Eds.), Handbook of public economics (Vol. 3, pp. 1293–1343). Amsterdam: North-Holland.
- Hines, J. R. (2001). Corporate taxation. In N. J. Smelser & P. B. Baltes (Eds.), International encyclopedia of the social & behavioral sciences (pp. 2810–2812). Kidlington: Elsevier Science.
- Hines, J. R. (2007). Corporate taxation and international competition. In A. J. Auerbach, J. R. Hines, & J. Slemrod (Eds.), Taxing corporate income in the 21st century (pp. 268–295). New York, NY: Cambridge University Press.
- Hubbard, R. G., Kashyap, A., & Whited, T. (1995). Internal finance and firm investment. Journal of Money Credit and Banking, 27, 683–701.https://doi.org/10.2307/2077743
- IMF. (2009). Debt bias and other distortions: Crisis-related issues in tax policy. Fiscal Affairs Department. Unpublished.
- Johansson, A., Heady, C., Arnold, J., Brys, B., Vartia, L. (2008). Tax and economic growth ( Working Papers 620). Paris: OECD Economics Department.
- Jorgenson, D. (1963). Capital theory and investment behavior. American Economic Review, 52, 305–360.
- Kaplan, S., & Zingales, L. (1997). Do investment-cash flow sensitivities provide useful measures of financing constraints? Quarterly Journal of Economics, 112, 168–216.
- Kaplan, S., & Zingales, L. (2000). Investment-cash flow sensitivities are not valid measures of financing constraints. The Quarterly Journal of Economics, 115, 707–712.https://doi.org/10.1162/003355300554782
- King, M. (1974). Taxation and the cost of capital. The Review of Economic Studies, 41, 21–35.https://doi.org/10.2307/2296396
- King, M., & Fullerton, D. (1984). The taxation of income from capital. Chicago, IL: Chicago University Press.https://doi.org/10.7208/chicago/9780226436319.001.0001
- Modigliani, F., & Miller, M. H. (1958). The cost of capital, corporation finance, and the theory of investment. American Economic Review, 48, 261–297.
- Musso, P., & Schiavo, S. (2008). The impact of financial constraints on firm survival and growth. Journal of Evolutionary Economics, 18, 135–149.https://doi.org/10.1007/s00191-007-0087-z
- Oliveira, B., & Fortunato, A. (2006). Firm growth and liquidity constraints: A dynamic analysis. Small Business Economics, 27, 139–156.https://doi.org/10.1007/s11187-006-0006-y
- Oropallo, F., & Parisi, V. (2007). Will Italy’s tax reform reduce the corporate tax burden? A microsimulation analysis. Rivista di Statistica Ufficiale, 1, 31–55.
- Pavitt, K. (1984). Sectoral patterns of technical change: Towards a taxonomy and a theory. Research Policy, 13, 343–373.https://doi.org/10.1016/0048-7333(84)90018-0
- Roodman, D. (2009). How to do xtabond2: An introduction to “difference” and “system” GMM in Stata. Stata Journal, (StataCorp LP.) 9, 86–136.
- Summers, L. H. (1981). Taxation and corporate investment: A q-theory approach. Brookings Papers on Economic Activity, 67–127.https://doi.org/10.2307/2534397
- Windmeijer, F. (2006). GMM for panel count data models (Discussion Papers 06/591). Bristol: Department of Economics, University of Bristol.