
 ?Mathematical formulae have been encoded as MathML and are displayed in this HTML version using MathJax in order to improve their display. Uncheck the box to turn MathJax off. This feature requires Javascript. Click on a formula to zoom.
Abstract
In this study, we investigate the existence of long-term co-movements among the prices of commodity futures contracts. We use a cointegration test, which accounts for the presence of a structural break. We show that while there is a long-term relationship among agricultural and among non-agricultural commodity futures prices when a structural break is taken into account, there is no such relationship without allowing for a structural break. We also show that these break points, in fact, occur a few months before the recent global financial crisis. Although the previous literature broadly casts doubt on such price co-movements, our results confirm that market performance improved during the sample period.
Public Interest Statement
This study on price linkages among commodity futures contracts would be of interest to a wide range of individuals including policy-makers and investors. Commodities and their futures prices have attracted significant attention and have become increasingly important in recent years, because of their numerous advantages. For instance, they can reduce investor risks in financial markets and play an important role in explaining macroeconomic phenomena such as the early stages of recessions for advanced economies, boom and bust cycles for developing countries and sovereign defaults. A key factor in facilitating these advantages is price co-movements among commodities. Unless they are not related, we are not able to detect and use valuable information. Therefore, this study’s findings are a starting point for investors and policy-makers and indicate that more attention should be paid to these price dynamics.
1. Introduction
Pindyck and Rotemberg (Citation1990) demonstrate that the prices of several commodities such as wheat, cotton, copper, gold, crude oil, lumber and cocoa are likely to move together. They suggest that this co-movement of commodity prices is caused in part by the herd behaviour of traders in financial markets—a phenomenon called the excess co-movement hypothesis (ECMH).
Considerable attention has been paid to commodity and their futures prices and they seem to become increasingly important in recent years.Footnote1 Gorton and Rouwenhorst (Citation2006) show that investors in financial markets can reduce their risk to take advantage of commodity futures. Chinn and Coibion (Citation2014) present optimistic results of the broader use of futures prices as predictors of subsequent spot price movements. Commodity prices have also arguably played a crucial role in explaining macroeconomic fluctuations. Hamilton (Citation2009) discusses that a large increase in oil price can account for much of the early stage of the recent recession. Not limited to oil prices, Bosworth and Lawrence (Citation1982) point out that the twin oil price shocks of the 1970s were accompanied by the twin food price shocks. Furthermore, some of developing countries have been dependent on primary commodities for a large part of their exports and suffered sharp boom and burst patterns as a result of commodity price changes. Reinhart and Rogoff (Citation2009) suggest that spikes in commodity prices are almost invariably followed by waves of new sovereign defaults. In addition to commodity futures, Acharya and Gaikwad (Citation2014), for example, investigate the impact of introduction of pre-open call auction on price co-movement in Indian stock exchanges.
It is an urgent issue for both investors and policy-makers to examine dynamics and linkages among commodity futures prices. Interdependencies between agricultural commodity futures prices have been investigated and past studies show mixed evidence while relatively less attention has been paid to non-agricultural commodity futures prices and existing studies show negative evidence of the ECMH among them.
Geoffrey Booth and Ciner (Citation2001) find that the prices of the four agricultural commodities traded on the Tokyo Grain Exchange (TGE) move independently, thus indicating the rejection of the ECMH. Their data range from July 1993 to March 1998. Bhar and Hamori (Citation2006) also analyse the interdependence of the futures prices of these four commodities using a more recent data-set, from August 1994 to December 2003. They find that the prices move independently for the total sample period. Their results also imply that there are price co-movements from 2000 to 2003 but not during the 1990s. They suggest that this difference could reflect the notion that price discovery, as emphasized by Malliaris and Urrutia (Citation1996), helps the market function better. Dawson and White (Citation2002) show no interdependence among soft commodities such as barley, cocoa, coffee, sugar and wheat on the London International Financial Futures Exchange. On the other hand, Malliaris and Urrutia (Citation1996) show a long-term relationship among the six commodity futures contracts (corn, wheat, oats, soybean, soybean meal and soybean oil) traded on the Chicago Board of Trade from January 1981 to October 1991, which is consistent with the ECMH.
Tsuchiya (Citation2010) shows that the prices of the four precious metal commodity futures traded at the Tokyo Commodity Exchange (TOCOM) do not move together in the long-run. The data range from May 2002 to May 2010. Ciner (Citation2001) also examines the long-run relationship between the prices of gold and silver futures contracts traded at the TOCOM and find that there is not a long-term relationship among the two in the period from 1992 to 1998. Ciner (Citation2002), however, finds evidence suggesting that trading volume for gold, platinum and rubber futures contracts traded on the TOCOM conveys valuable information to the market about absolute value of returns.
This study aims to investigate whether long-term price co-movements exist in each commodity futures market while taking into account the presence of a structural break. The recent global financial crisis caused a significant negative level shift in those commodity futures prices and thus can be considered a structural change. If we do not assume it is a structural change, we would be unable to uncover long-term price co-movements because price linkages are probably broken during turmoil periods. Although linkages among agricultural commodity futures prices have been examined following the findings of Pindyck and Rotemberg (Citation1990), non-agricultural commodity futures prices have attracted limited research attention. Further, this study examines whether the functioning of these futures markets improved from their performance in the 1980s and 1990s. In particular, we use the price indexes for four precious metal and four agricultural commodity futures contracts traded on the TOCOM and TGE, respectively.
We find that there is a long-run relationship among the four precious metal commodity futures prices when a structural break is assumed; however, there is no such relationship without this assumption. The estimated date of the structural break is approximately one month before 15 September 2008, the starting point of the recent financial crisis called the “Lehman shock”. We also find similar results for the four agricultural commodity futures prices. The estimated date of the structural break is 26 August 2008, which is approximately three weeks before the Lehman shock. These results indicate that the precise date for the recent financial crisis is actually the Lehman shock. Our results also imply that the futures markets of precious metals and agricultural commodity have improved its functioning over the 10-year sample period, in line with the findings of Malliaris and Urrutia (Citation1996) and Bhar and Hamori (Citation2006).
The remainder of this article is organized as follows. Section 2 describes the data-set. Section 3 presents the results of the unit root tests. Section 4 describes the cointegration test with a structural break and presents the empirical results. Section 5 summarizes the findings.
2. Data
We use the Nikkei-TOCOM Sub Commodity IndexesFootnote2 for four precious metal futures contracts traded at the TOCOM: gold, palladium, platinum and silver. Each commodity listed at the TOCOM has its Sub Index. Each Sub Index is the figure of the fluctuation rates of the daily settlement prices in the core contract-month (fifth or sixth contract-monthFootnote3), from base date (31 May 2002, on which the Index price is set at 100) to the applicable date. The sample period covers the end of May 2002 to the end of December 2010. The data comprise a total of 2104 observations for each contract with no observations missing.
We also use the TG Sub Indexes comprising the TG IndexesFootnote4 for the four agricultural futures contracts traded on the TGE: corn, soybean, red bean and sugar. Each commodity has its own Sub Index, which represents the fluctuation rates of the daily settlement prices in the core contract-month (furthest contract-monthsFootnote5), from the base date (31 March 2003, on which the Index price is set at 100) to the applicable date. The sample covers 31 March 2003 to 30 December 2010. The data comprise 1901 observations for each contract.
Figure plots the four precious metal futures prices. For gold, platinum and silver, they have an upward trend since the beginning of the sample period and experience a large drop around the mid-July of 2008. Since then, they started to increase again. Note that the silver price increased considerably toward the end of the sample period. On the other hand, the palladium price has stagnated until a sudden drop around the mid-July 2008 and, however, it continued to increase afterward as the other three futures prices.
Figure 1. Nikkei-TOCOM sub commodity indexes.
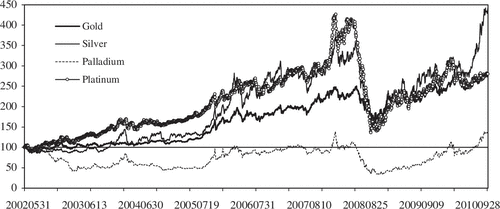
Figure plots the four agricultural futures prices. In contrast to the precious metal futures prices, there is no clear trend. However, all except red bean exhibits similar price development since the mid-2007 with the previous metal futures prices.
Figure 2. TG sub-commodity indexes.
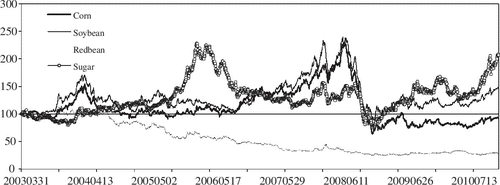
Table shows basic statistics of each commodity futures price. Among the precious metal futures, the prices of platinum and silver record more than four times high as the initial point of the sample while that of palladium stagnates. Silver varies the most among the four prices. Gold is the modest in terms of both price level and variability. The agricultural futures prices exhibit less divergence than the precious metal futures prices in terms of both price level and variability.
Table 1. Descriptive statistics
3. Unit root tests
First, we test stationarity for the level and first difference of the natural logarithm of the futures prices. We use two tests to see the robustness of the result: the augmented Dickey–Fuller (ADF) unit root tests and the Kwiatkowski–Phillips–Schmidt–Shin (KPSS) unit root tests. Then, we apply the Zivot–Andrews unit root tests with endogenous structural break detection.
Table shows that the prices of all the commodity futures contracts are integrated of order one, I(1). The ADF testFootnote6 tests the null hypothesis (that a variable contains a unit root) against the alternative: that a variable contains no unit root. We employ three specifications for the test: the auxiliary regression includes a constant and time trend (I); auxiliary regression includes a constant (II); and auxiliary regression includes none (III). For the price level, the ADF tests indicate that the futures price contains a unit root in every case. For the first difference of price, the tests indicate that there is no unit root in all cases.
Table 2. Augmented Dickey–Fuller test
Table shows the results of the KPSS tests for the level, and the first difference of the natural logarithm of all the commodity futures prices. Unlike the ADF test, the KPSS testFootnote7 tests the null hypothesis that a variable contains no unit root against the alternative that a variable contains a unit root. We employ two specifications for the test: the auxiliary regression includes a constant and time trend (I); and auxiliary regression includes a constant (II). For the price level, the KPSS tests indicate that the futures price contains a unit root in every case. For the first difference of price, the tests indicate that there is no unit root in all cases.
Table 3. KPSS test
We obtain consistent results from the ADF and KPSS tests. Therefore, this leads us to the conclusion that the prices of the four precious metals and four agricultural futures contracts are integrated of order one, I(1).
Furthermore, we apply the Zivot–Andrews unit root tests with endogenous structural break detection since the recent financial crisis might have caused a structural break for those futures prices.
Perron (Citation1989) showed that the inference drawn from a Dickey–Fuller type test becomes unreliable in the case of a potential structural break, and proposed models where the structural break point is assumed to be known. However, Zivot–Andrews (Citation1992) pointed out the problem of setting the break point exogenously and proposed a test that circumvents that possibility by endogenously determining the most likely occurrence of a structural break. The estimation procedure is to choose the date of the structural shift for the null hypothesis of a unit root as shown below. The test statisticsFootnote8 is the t-ratio as in Perron (Citation1989):(1)
(1)
where Δ = [0, 1]. The three different models are(2)
(2)
(3)
(3)
(4)
(4)
where DUt(λ) = 1 if t > Tλ and 0 otherwise, and for t > Tλ and 0 otherwise.
Table shows the results of the Zivot–Andrews testsFootnote9 for the level and first difference of the natural logarithms of all the commodity futures prices. We use three specifications for the test: the auxiliary regression includes a constant and time trend (I); auxiliary regression includes a constant (II); and auxiliary regression includes none (III). Each specification corresponds to a model with the corresponding superscript for estimated parameters. The lag length of each specification for each variable is set as chosen in the ADF tests.
Table 4. Zibot–Andrews test
First, we focus on the precious metal futures prices. For the level, the hypothesis of a unit root is rejected in specification I and III of platinum and silver futures prices. For the first differenced series, the hypothesis of a unit root is rejected in each specification of all futures prices. In contrast to Dawson and White (Citation2002), we obtain evidence that there is a structural break in each series.
The estimated break points for the futures prices of palladium and platinum lie between March 2008 and December 2008, which includes 15 September 2008, the starting point of the “Lehman shock”. However, those of gold and silver vary widely. The Zivot–Andrews test estimates 12 May 2006 as a break point for the futures price of gold in specifications I and 2 August 2002 in specification II. Furthermore, it estimates 19 April 2006 as a break point for the futures price of silver in specifications I and 1 July 2010 in specification II.
Next, we focus on the agricultural futures prices. For the level, the hypothesis of a unit root is rejected in only one specification (corn futures price). For the first differenced series, the hypothesis of a unit root is rejected in each specification of all futures prices. Therefore, it can be concluded that all prices are integrated of order one, I(1).
The estimated break points for the futures prices of corn and soybean centre on 15 September 2008, but those of red bean and sugar do not. The Zivot–Andrews test estimates 14 November 2003 as a break point for the futures price of red bean in specifications I and III and 1 August 2005 in specification II. Furthermore, it estimates 6 February 2006 as a break point for the futures price of sugar in specifications I and III and 30 April 2010 in specification II.
Those dispersions of break points and rejections of the null for the price levels might indicate that there are more than two break points. However, investigating this issue is beyond the scope of the present paper.
4. Cointegration tests
We use Johansen’s full information maximum likelihood cointegration analysis, in line with the past literature, to test for long-run co-movements. Johansen (Citation1991) develops two likelihood ratios to test for the number of cointegration vectors in an unrestricted vector autoregression (VAR) model: the maximum eigenvalue test and the trace test. The former tests the null hypothesis of r cointegrating vectors against the alternative hypothesis of r + 1 cointegrating vectors. The latter tests the null hypothesis of r cointegrating vectors at most against the alternative hypothesis of more than r vectors. Neither test has a standard asymptotic distribution; however, Monte Carlo simulations based on critical values exist. The critical values are obtained from Osterwald-Lenum (Citation1992).
To assess the robustness of our findings, we apply lag lengths of one and two, and we use three specifications of deterministic trends since the result of a cointegration test depends on these two factors. A lag length of two is selected according to the AIC. Since AIC is likely to choose a long lag length, a lag length of one is also examined.Footnote10 The specifications are as follows: the cointegrating equations have no intercepts and the level data have no deterministic trends (I); the cointegrating equations have intercepts but the level data have no deterministic trends (II); and both the cointegrating equations and the level data have linear trends (III).
Table shows the results of the maximum eigenvalue tests and trace tests. The panel (a) shows the results of the four precious metal futures prices. The trace tests indicate that there are no cointegrating relations for all lag lengths and specifications. The maximum eigenvalue tests also show that there are no cointegration relations for all lag lengths and specifications. Therefore, we conclude that the four precious metal futures prices move independently during the sample period as shown in Tsuchiya (Citation2010).
Table 5. Cointegration tests
The panel (b) shows the results of the four agricultural futures prices. The trace tests indicate that there are no cointegrating relations for all lag lengths and specifications. The maximum eigenvalue tests show that there is no cointegration at the 1% significance level in two of the three specifications for both lag lengths, whereas specification III implies one cointegrating relation in both lag lengths. Therefore, we conclude that the four agricultural futures prices move independently during the sample period.
However, as shown in Table , the Zivot–Andrews unit root tests indicate an endogenous structural break for those futures prices. Therefore, we apply the method developed by Lutkepohl, Saikkonen, and Trenkler (Citation2004), in which the structural shift is a simple shift in the level of the process. This assumption is consistent with observations that most asset prices showed a large decrease during the crisis.
Lutkepohl et al. (Citation2004)Footnote11 assume that the K × 1 vector process {yt} is generated by a constant, a linear trend and level shift terms:(5)
(5)
where dtτ is a dummy variable defined by dtτ = 0 for t < τ and dtτ = 1 for t ≥ τ. The shift assumes that the shift point τ is unknown and that it is expressed as a fixed fraction of the sample size:(6)
(6)
where and
define real numbers and [·] defines the integer part. It is also assumed that the process {xt} can be represented as a VAR(p) and that the components are at most I(1) and cointegrated with rank r.
The estimation of the break point is based on the regressions:(7)
(7)
where Ai with i = 1, … , p assigns the K × K coefficient matrices and is the error process.
The estimator for the break point is defined as:
(8)
(8)
where and
are the least-squares residuals of Equation 3. Once the break point
has been estimated, the data are adjusted according to
(9)
(9)
Finally, Johansen’s (Citation1991) procedure for determining the cointegration rank can be applied to these adjusted series.
Table Footnote12 shows the results of Lutkepohl et al.’s (Citation2004) cointegration test with a structural break. The panel (a) shows one cointegrating relationship among the four futures prices in specification I and two cointegrating relationships in specification II. The estimated dates of the break points are 14 July 2008 in specification I and 1 August 2008 for specifications I and II, respectively. The estimated dates of the structural break are approximately one month and two weeks before the Lehman shock. This fact implies that the commodity futures prices are good indicators of macroeconomic conditions represented by those spot commodity prices; this finding is thus consistent with the results of Chinn and Coibion (Citation2014). The estimated dates of the structural breaks differ by only two weeks. The number of cointegrating relationships and estimated dates of break points are robust within each specification. These results indicate that the precise date for the recent financial crisis is actually the Lehman shock. In contrast to the results by Johansen’s (Citation1991) cointegration analysis, we obtain evidence that there is at least one cointegrating relationship among the four precious metal futures prices. Therefore, we conclude that there are long-term relationships among the four commodity futures prices, which is in contrast to the findings of Ciner (Citation2001) and Tsuchiya (Citation2010). In addition, Figure indicates an upward trend for the four precious metal futures prices. It thus seems more reasonable to consider the two cointegrating relationships in specification II.
Table 6. Cointegration tests with a structural break
The panel (b) shows two cointegrating relations among the four agricultural futures prices and the estimated date of the break point is 26 August 2008 in all model specifications. In contrast to Johansen’s (Citation1991) cointegration analysis, we obtain robust results. Therefore, we conclude that there are long-run relationships among the four commodity futures prices since there are cointegrating relations between them.
Furthermore, our results imply that the futures market of precious metals and agricultural commodity have improved its functioning over the 10-year sample period, in line with the findings of Malliaris and Urrutia (Citation1996) and Bhar and Hamori (Citation2006). One of the possible reasons for the improvement of market functioning is that the depth of the market has increased as pointed out by Chinn and Coibion (Citation2014).
Finally, we examine a vector error correction model (VECM) representation because the existence of cointegration implies that the model can be represented as a VECM. The VECM is represented as a VAR in the first differences of Equation 7, augmented by the error correction terms αe, where e = βy. α can be interpreted as speed-of-adjustment parameters, β is a normalized cointegration vector and e represents deviation from long-term equilibrium. Therefore, the VECM illustrates that the short-term dynamics of the commodity futures prices in the system are influenced by the deviation from long-term equilibrium and adjust according to speed-of-adjustment parameters.
We examine whether these parameters are equal to zero because if they are all equal to zero, the long-term relationship does not exist. For the precious metal futures prices, we consider specification II because they seem to demonstrate an upward trend. In contrast, for the agricultural futures prices, we consider specification I because Figure indicates no such trend. Note that there are two cointegrating relationships for both markets. We denote e1 the error correction term for the first cointegrating relationships and e2 for the second cointegrating relationship.
Table shows the estimates for the speed-of-adjustment parameters.Footnote13 It indicates the suitability of the VECM because most of the estimates are significantly different from zero. Among the precious metal futures prices, the speed-of-adjustment of gold is low, while those of platinum and silver are high. Among the agricultural futures prices, speed-of-adjustment of soybean is low, while those of red bean and sugar are high.
Table 7. VECM results: estimates of α
5. Conclusion
We examine long-term price relationships among the four precious metal commodity futures contracts traded at the TOCOM and the four agricultural commodity futures contracts traded on the TGE using Johansen’s cointegration analysis and one with a structural break developed by Lutkepohl et al. (Citation2004). The recent financial crisis forces us to use the latter to investigate long-term co-movements among commodity futures prices; however, structural breaks have been rarely taken into consideration in the literature.
The cointegration tests indicate that there are long-run relationships among those commodity futures prices, allowing for a structural break. However, there are no such relations without that premise. Therefore, our finding supports the ECMH in the precious metals and agricultural commodity futures markets whereas past literature such as Ciner (Citation2001) and Tsuchiya (Citation2010) show negative evidence of the ECMH among non-agricultural commodity futures prices. The estimated date of the structural break is between the mid-July and the beginning of August in 2008 for the precious metals and the end of August for the agricultural commodity. These results indicate that the precise date for the recent financial crisis is actually the Lehman shock. This fact indicates that futures prices are good indicators of their spot prices, thus of macroeconomic fluctuations.
Our findings also imply that the futures markets have improved its functioning over the 10-year sample period, in line with the findings of Malliaris and Urrutia (Citation1996) and Bhar and Hamori (Citation2006). This might reflect the fact that the depth of the futures market has increased. In recent years, it is likely that there could be long-run relationships among commodity futures prices because of the growing use of futures markets. Further investigation of other meal and commodity futures markets is needed.
Additional information
Funding
Notes on contributors
Yoichi Tsuchiya
Yoichi Tsuchiya is an assistant professor at School of Management, Tokyo University of Science, Japan. After MA program, he has worked as an economist at the Japan Center for Economic Research and forecasted the Japanese economy. He received PhD in Economics in June 2013 by Department of Economics, State University of New York at Buffalo.
His research interests are applied econometrics, economic forecasting and macroeconomics. He has published his papers in academic journals including Applied Economics, Economics Letters and International Review of Economic and Finance.
Notes
1. See, for example, Chinn and Coibion (Citation2014) for more discussions.
2. The Nikkei-TOCOM Commodity Index is the aggregated figure of all the Sub Index, multiplied by a weight percentage for each component.
3. This is because those contract-month are the most active. Unlike the Japanese futures contracts, the nearest contracts are usually the most active in the US futures contracts.
4. The TG Index is the aggregated figure of all the Sub Indexes multiplied by a weight percentage for each component. It represents fluctuations in domestic agricultural commodity prices and is used as a benchmark for agricultural commodity investors.
5. This is because those contract-months are the most active. Unlike Japanese futures contracts, the nearest contracts are usually the most active in US futures contracts.
6. See Dickey and Fuller (Citation1979) for details.
7. See Kwiatkowski et al. (Citation1992) for details.
8. The presentation of the Zivot–Andrews test with endogenous structural break detection follows Pfaff (Citation2008).
9. Dawson and White (Citation2002) also applied the Zivot–Andrews tests and showed that no significant structural break is present in any series.
10. The lag length of one is selected according to the BIC.
11. The presentation of the cointegration test with a structural break follows Pfaff (Citation2008).
12. The lag lengths of two and one are chosen following the previous Johansen’s cointegration tests.
13. The other specifications yield consistent results although they are not reported here.
References
- Acharya, H. R., & Gaikwad, V. (2014). Pre-open call auction and price discovery: Evidence from India. Cogent Economics & Finance, 2, 944668.
- Bhar, R., & Hamori, S. (2006). Linkages among agricultural commodity futures prices: Some further evidence from Tokyo. Applied Economics Letters, 13, 535–539.https://doi.org/10.1080/13504850500400421
- Bosworth, B. P., & Lawrence, R. Z. (1982). Commodity prices and the new inflation. Washington, DC: Brookings Institute.
- Chinn, M. D., & Coibion, O. (2014). The predictive content of commodity futures. Journal of Futures Markets, 34, 607–636.https://doi.org/10.1002/fut.v34.7
- Ciner, C. (2001). On the long run relationship between gold and silver prices: A note. Global Finance Journal, 12, 299–303.https://doi.org/10.1016/S1044-0283(01)00034-5
- Ciner, C. (2002). Information content of volume: An investigation of Tokyo commodity futures markets. Pacific-Basin Finance Journal, 10, 201–215.https://doi.org/10.1016/S0927-538X(01)00037-3
- Dawson, P. J., & White, B. (2002). Interdependencies between agricultural commodity futures prices on the LIFFE. Journal of Futures Markets, 22, 269–280.https://doi.org/10.1002/fut.2217
- Dickey, D. A., & Fuller, W. A. (1979). Distribution of the estimators for autoregressive time series with a unit root. Journal of the American Statistical Association, 74, 427–431.
- Geoffrey Booth, G., & Ciner, C. (2001). Linkages among agricultural commodity futures prices: Evidence from Tokyo. Applied Economics Letters, 8, 311–313.https://doi.org/10.1080/135048501750157486
- Gorton, G., & Rouwenhorst, G. (2006). Facts and fantasies about commodity futures. Financial Analysts Journal, 62, 427–431.
- Hamilton, J. D. (2009). Causes and consequences of the oil shock of 2007–08. Brookings Papers on Economic Activity, 215–261.https://doi.org/10.1353/eca.0.0047
- Johansen, S. (1991). Estimation and hypothesis testing of cointegration vectors in Gaussian vector autoregressive models. Econometrica, 59, 1551–1580.https://doi.org/10.2307/2938278
- Kwiatkowski, D., Phillips, P. C. B., Schmidt, P., & Shin, Y. (1992). Testing the null hypothesis of stationarity against the alternative of a unit root Journal of Econometrics, 54, 159–178.https://doi.org/10.1016/0304-4076(92)90104-Y
- Lutkepohl, H., Saikkonen, P., & Trenkler, C. (2004). Testing for the cointegrating rank of a VAR process with level shift at unknown time. Econometrica, 72, 647–662.https://doi.org/10.1111/ecta.2004.72.issue-2
- Malliaris, A. G., & Urrutia, J. L. (1996). Linkages between agricultural commodity futures contracts. Journal of Futures Markets, 16, 595–609.https://doi.org/10.1002/(ISSN)1096-9934
- Osterwald-Lenum, M. (1992). A note with quantiles of the asymptotic distribution of the maximum likelihood cointegration rank test statistics. Oxford Bulletin of Economics and Statistics, 54, 461–472.https://doi.org/10.1111/obes.1992.54.issue-3
- Perron, P. (1989). The great crash, the oil price shock, and the unit root hypothesis. Econometrica, 57, 1361–1401.https://doi.org/10.2307/1913712
- Pfaff, B. (2008). Analysis of integrated and cointegrated time series with R (2nd ed.). Berlin: Springer.https://doi.org/10.1007/978-0-387-75967-8
- Pindyck, R. S., & Rotemberg, J. J. (1990). The excess co-movement of commodity prices. The Economic Journal, 100, 1173–1189.https://doi.org/10.2307/2233966
- Reinhart, C. M., & Rogoff, K. S. (2009). This time is different. Princeton, NJ: Princeton University Press.
- Tsuchiya, Y. (2010). Linkages among precious metals commodity futures prices: Evidence from Tokyo. Economics Bulletin, 30, 1772–1777.
- Zivot, E., & Andrews, D. W. K. (1992). Further evidence on the great crash, the oil-price shock, and the unit-root hypothesis. Journal of Business & Economic Statistics, 10, 251–270.