
 ?Mathematical formulae have been encoded as MathML and are displayed in this HTML version using MathJax in order to improve their display. Uncheck the box to turn MathJax off. This feature requires Javascript. Click on a formula to zoom.
Abstract
This paper investigates the dynamic linkages between trading volume and investors sentiments for the S&P500 stock exchange. Two sentiment indicators are considered, the overconfidence and the net optimism-pessimism indicator. Non-linear dynamic approach, namely the asymmetric autoregressive distributed lag (NARDL) model is used to capture the long-term and short-term non-linear connections between the investor sentiment and the stock market liquidity. Empirical findings suggested an asymmetric long-term market liquidity reaction to investor sentiment. In the short-term, the stock market liquidity react rapidly and asymmetrically to changes in overconfidence sentiment, while the optimism and pessimism sentiment has insignificant short-term impact on trading volume.
JEL classification:
Public Interest Statement
Several studies have shown that investors anticipate the future return evolution based on their feeling and they respond according to their expectations. They react aggressively or diminish their trading depending on whether they anticipate an increase or a decrease in future returns. However, these studies didn’t show whether the stock market liquidity reacts asymmetrically to investor’s over and under-confidence sentiment. Also, we are not sure that the impact of optimism and pessimism sentiment on stock market liquidity is asymmetric. In this study, we verify whether there’s an asymmetric relationship between investor sentiment and stock market liquidity when investors are more or less over (under) confident and when they are upper-optimistic or upper-pessimistic. We use the NARDL approach to examine this relation in S&P500 stock market.
1. Introduction
The change of return over the time (days, weeks, months or any other unit of time) provides information about the influences of the investors’ expectation and therefore their beliefs. They feel optimistic when they realized prior gains and pessimistic when they realized prior losses. Based on their feeling, they anticipate the future return evolution and they respond according to their expectations. They react aggressively or diminish their trading depending on whether they anticipate an increase or a decrease in future returns. So trading volume constitutes accordingly a good indicator describing the reaction of the stock market to the change in investor sentiments.
Investors regulate their expectation according to the appearance of new information and this process influences significantly their trading volume. Since information are embedded in the prices and returns and all new information can be detected considering the change on returns, it will be interesting to investigate the relationship between the two components of the stock markets (i) returns and (ii) trading volume. The first allows supervising investors over (under) confidence (see Baker & Stein, Citation2004), while the second supervises the stock market liquidity (see Chordia, Roll, & Subrahmanyam, Citation2001; Kamara & Koski, Citation2001; Lee, Fok, & Liu, Citation2001). Otherwise investor over and under-confidence and stock market liquidity appear to be empirically moving together.
Several recent studies in the last decade have attached more attention to the dynamic causality between trading volume and stock return (Chen, Hong, & Stein, Citation2001; Chordia & Swaminathan, Citation2000). Previously the linear and non-linear causality between these variables has been studied by several researchers (Campbell, McCloy, Oppler, & Sager, Citation1993; Gallant, Rossi, & Tauchen, Citation1992; Hiemstra & Jones Citation1994).
In this paper, we try to examine whether the stock market liquidity reacts asymmetrically to investor’s over and under-confidence sentiment. We study also the asymmetric impact of optimism and pessimism sentiment on stock market liquidity. We will verify whether there’s an asymmetric relationship between investor sentiment and stock market liquidity when investors are more or less over (under) confident and when they are upper-optimistic or upper-pessimistic. This research is motivated by the fact that investors’ beliefs drive their investment decisions and their forecast about the future evolution of stock market.
Thus we keep a commonly known proxy of overconfidence namely the lagged stock return and we propose a new specification of the optimism-pessimism sentiment based on the results of the AAII survey on investor forecast of the bullish and bearish trends of the S&P500 market. We use the dynamic Non-linear Autoregressive Distributed Lag (NARDL) to examine the dynamic asymmetric relation between the stock market liquidity and the investor sentiment indicators. This method seems suitable to oversee the asymmetry in long and short-term response of the dependent variable to positive and negative regressor changes.
Using weekly stock market data S&P500 over the period from July 17, 1987 to October 29, 2015, empirical findings confirm the asymmetric response of the stock market liquidity to both overconfidence and optimism-pessimism indicators in the long-term. At short term, a rapid asymmetric reaction to over (under) confidence is noticed. However, the variation of the optimism-pessimism indicator has insignificant predictive power.
This paper is organized as follow. Section 2 presents theoretical and empirical literature on the relation between the investor sentiment indicators and the stock market liquidity. Section 3 describes the data and the methodology. Section 4 presents the results on dynamic relation between the stock market liquidity and the investor sentiment.
2. Literature review
Previous studies in finance have attached greater importance to the efficient market hypothesis. During the last two decades, new research topic has attracted the attention of academics as well as practitioners. Investors do not act rationally, their human psychology drives their investment decisions (Akerlof & Shiller, Citation2009; Dhaoui, Citation2013, Citation2015; Dhaoui & Khraief, Citation2014). This finding of investor irrationality is not recent. In 1936 Keynes said that “most, probably, of our decisions to do something positive, the full consequences of which will be drawn out over many days to come, can only be taken as the results of animal spirits, a spontaneous urge to action rather than inaction, and not at the outcome of a weighted average of quantitative benefits multiplied by quantitative probabilities” (Keynes, Citation1936, p. 168).
Eighty years later, Akerlof and Shiller (Citation2009) have analyzed the issue of rationality of financial market and recommended to get more attention to psychological influences on investor decisions process. They argued that “It is necessary to incorporate animal spirits into macroeconomic theory in order to know how the economy really works. In fact the macroeconomics of the past thirty years has gone in the wrong direction. In their attempts to clean up macroeconomics and make it more scientific, the standard macroeconomists have imposed research structure and discipline by focusing on how the economy would behave if people had only economic motives and if they were also fully rational” (Akerlof & Shiller, Citation2009, p. 168).
Among various psychological factors, the overconfidence, optimism and pessimism are the sentiment that most captured the attention of researches (Akerlof & Shiller, Citation2009; Barberis, Shleifer, & Vishny, Citation1998; Daniel, Hirshleifer, & Subrahmanyam, Citation2001; De Bondt & Thaler, Citation1985; Dhaoui, Citation2013; Haruvy, Stahl, & Wilson, Citation1999; Otten, Citation1989; Weinstein, Citation1980). Several studies measured the overconfidence based on the type of impact of the lagged stock price on the trading volume (Boynton, Oppenheimer, & Reid, Citation2009; Dhaoui, Bourouis, & Boyacioglu, Citation2013; Kcherem & Bouri, Citation2009; Ulussever, Yumusak, & Kar, Citation2011). According to these authors, there may be a probable relationship between the investor’s over (under) confidence and the stock market reaction.
Other authors have examined relationship between the trading volume and stock price (Brailsford, Citation1996; Brock & LeBaron, Citation1996; Crouch, Citation1970; Epps, Citation1975, Citation1977; Godfrey, Granger, & Morgenstern, Citation1964; Granger & Morgenstern, Citation1963; Hiemstra & Jones, Citation1994; Karpoff, Citation1987; Lee & Rui, Citation2002; Mestel, Gurgul, & Majdosz, Citation2003). Although the results are sometimes nuanced, a positive relationship remains mainly reported. The stock price appears, especially, to have a significant positive impact on trading volume.
Mestel et al. (Citation2003) used the Australian stock market data to examine empirically the relationship between stock returns, return volatility and trading volume. Their empirical findings reported only weak support for contemporaneous as well as dynamic relationship between stock returns and trading volume. However, they support a strong contemporaneous relationship between return volatility and trading volume. These results indicate that the knowledge of one of the two variables (i.e. stock returns and trading volume) cannot improve their forecasts. However, by applying Granger’s test for causality, they find that return volatility contains information about upcoming trading volume.
Based on daily data market of five countries (Indonesia, Malaysia, Philippines, Singapore and Thailand), Pisedtasalasai and Gunasekarage (Citation2007) studied the causal and dynamic relationship between the stock returns and the trading volume. They used a Vector Autoregression Model to examine the causal relation and in the same time to trace the dynamic relationship between the two variables. Introducing dummy variable to capture the Monday effect and the Asian Financial crisis in 1997, they found a statistically significant causality running from stock returns to trading volume for the case of Indonesia, Malaysia, Singapore and Thailand. The causality running from trading volume to the stock returns was statistically significant only for Singapore.
Later Pathirawasam (Citation2011) examined the relationship between trading volume and stock returns using 266 stocks traded at the Colombo Stock Exchange over the period 2000–2008. The empirical finding indicate that (i) stock returns are positively related to the contemporary change in trading volume and (ii) past trading volume change is negatively related to stock returns. He argues that investor misspecification about upcoming earnings or illiquidity of low volume stocks constitutes the main reason for the negative relationship between trading and stock returns.
Furthermore, Chen (Citation2012) tried to analyze empirically whether the linkages between stock returns and trading volume were depending on stock markets fluctuation. Investigating the state of bull and bear stock markets using the S&P500 price index data over the period spanning February 1973 to October 2008, he showed a strong evidence of asymmetry on contemporaneous relationship between returns and trading volume. Results for the dynamic relationship indicate that stock returns are capable to predict trading volume in both bull and bear markets. Contrariwise, trading volume affects weakly the stock returns.
While using different Arch an Garch Models to analyze the mean relationship in Indian stock Market over the period spanning January 2005 to January 2010, Tripathy (Citation2010) found that bad news generate significant impact on the volatility of stock price.
Other recent studies have given more attention to the investor’s psychological state and their impact on the stock market liquidity. Optimism and pessimism appear theoretically to have significant impact on investor trading strategies. Moreover, they appear especially to have non-symmetric impacts. Indeed theoretical predictions suppose that trading volume are asymmetrically responsive to optimistic and pessimistic analysis and earnings forecasts (Beyer & Guttman, Citation2011; Hayes, Citation1998; Jackson, Citation2005). According to these predictions we suppose that both optimistic and pessimistic investors react differently based on their expectations. The more the investor is optimistic the more he increases his trading volume when he anticipates a price increase. He hopes that this rise will generate a new augmentation, which allows him to realize future gains. When prices fall he trades normally since he is less sensitive to negative results. Simultaneously, the more pessimistic investors anticipate that any price drop will be followed by new decreases and accordingly, to avoid high losses, they reduce their trading. However, since they are less sensitive to positive results they trade normally when they anticipate a future price increase.
Overall, major studies cited above examine the relationship between trading volume and stock market returns. The trading volume is previously used as a proxy for the stock market liquidity (Grossman & Miller, Citation1988), while the (historical) stock market returns are used as a measurement of the investor over and under confidence (Boynton et al., Citation2009; Ulussever et al., Citation2011). Especially, the positive reaction to the trading volume increase in the lagged stock market returns is understood as a positive effect of the overconfidence and a negative response is understood as results of an under -confidence impact. We note also, that earlier studies focusing on the linkages between stock returns and behavioral indicators used various econometric approaches. Among others, ARCH and GARCH approaches, Johansen cointegration techniques, VAR models are largely used. These techniques suppose linear linkages between independent and dependent variables and supervise the specific characteristics in the relations such as long and short run causality (cointegration approach), volatility (ARCH and GARCH), Error correction (VECM). However, financial series, such as stock price and trading volume, are characterized by their specific instability and their high sensitivity to increases and decreases in the underlying assets character. Particularly, the stock market liquidity appears to be highly sensitive to investor sentiment and respond asymmetrically to positive and negative changes in the investor sentiment state and judgments. This incites to develop a dynamic empirical approach examining this asymmetrical impact on the stock market liquidity.
Investor sentiment includes in addition to the overconfidence, various other components such as the optimism and the pessimism components, the spontaneous reaction. We retain for this study the over (under) confidence indicators and we propose a new specification to the optimism-pessimism sentiment based on the results of the AAII survey of the S&P500 investors sentiments.
3. Methodology and model structure of the asymmetric ARDL cointegration
3.1. Data description
The data used in this study to estimate our proxy are the S&P 500 weekly data from 4 July 1987 to 29 October 2015. Stock price and trading volume data are available in the S&P500 webpages, while investor sentiments data are available in American Association of Individual Investors webpages (AAII). The trading volume is usually used as a proxy for the stock market liquidity. It is considered as the natural logarithm of the volume of transaction. Among other, Grossman and Miller (Citation1988) measured the liquidity stock market by estimating its trading volume.
Besides, investor sentiment is calculated as the difference between bullish and bearish forecast of the S&P500 index following this formulation: Sent = Bullish − Bearis. This indicator allows supervising for the optimism and pessimism states of the investors. An increase in this indicator may be understood as an indicator of investor’s optimism perception/expectation of the market future evolution. While a diminution is attributed to measure the investor pessimistic expectation for the future reaction of the stock market. The lagged stock price is included in the model to supervise for the over and under-confidence of investor impact on the stock market liquidity. According to the empirical finding of Kcherem and Bouri (Citation2009), Boynton et al. (Citation2009), Ulussever et al. (Citation2011) and later Dhaoui et al. (Citation2013), a positive impact of lagged stock price on the trading volume (respectively, negative impact) is considered as an indicator of positive (negative) impact of investor’s overconfidence (under-confidence) on their trading behavior.
3.2. Estimate specification
Existing literature on the trading volume-stock price is dominated by linear models that assume in general symmetric relationships. Several researches focused also on the relationship asymmetry, whereas others on the nature of the equilibrium over the time such as the cointegration models that allow supervising for the long-term and short-term relationship. The asymmetric linkages are in general examined based on EGARCH models and regime-switching models. Although the importance of the results previously found based on the various models, supervising for the two effects together is not easy to ensure. In this paper we contribute to the empirical literature by performing a model allowing to supervise simultaneously for the short-term and long-term relation and for the possible asymmetry in the relationship. We will use the non-linear ARDL model to achieve this goal.
The Non-linear ARDL model recently developed by Shin, Yu, and Greenwood-Nimmo Citation2014 uses positive and negative partial sum decompositions allowing to detect the asymmetric effects in the long and the short-term. Compared to the classical cointegration models, NARDL models present some other advantages. Firstly, they perform better for determining cointegration relations in small samples (Romilly, Song, & Liu, Citation2001). Secondly, they can be applied irrespective of whether the regressors are stationary at level or at the first difference (i.e. I(0) or I(1)). They cannot be applied however if the regressors are I(2).
The general form of the asymmetric ARDL model can be as follows:(1)
(1)
where tv is the trading volume used as the dependent variable, sp is the stock price taken in natural logarithm used as a first independent variable, sent is a proxy for investor sentiment used as a second independent variable, and is a vector of long term parameters to be estimated. The investor In the Equation (1),
and
constitute, respectively, the partial sums of positive and negative changes in stock price. They are calculated as follows:
(2)
(2)
and(2)
(2)
At the same way, and
represent, respectively, the partial sums of positive and negative changes in investor sentiment. They are estimated as follows:
(4)
(4)
and(5)
(5)
Equation (1) shows the long-term relation between trading volume from one hand and the S&P500 stock price and the investor sentiment from the other hand. The long-term relation between the trading volume and the positive changes in stock price is α1, which is expected to be positive. Meanwhile, α2 capture the long-term relation between trading volume and negative changes in stock price. Since they are expected to move in the same direction with α2, α2 is expected to be positive. In the same way, α3 and α4 capture the long-term relation between trading volume and positive and negative changes in investor sentiment, respectively. Since trading volume is expected to increase following optimistic expectations and to decrease following pessimistic expectation of stock market evolution (i.e. moving in the same direction), both α3 and α4 are expected to be positive. It is also expected that overconfident investors and those who are more optimistic may react more aggressively and increase their trading volume compared to their competitor who are more pessimistic or under-confident. Therefore, it is expected that the stock price (and investor sentiment) will generate a higher long-term changes in the trading volume as compared to the trading volume impact of the stock price (and investor sentiment) reduction in the same magnitude. That is, therefore α1, > α2 (and respectively α3 > α4).
The Equation (1) can be integrated in an ARDL setting as follows:(6)
(6)
where all variables are as defined above, p, and s are lag orders and α1 = −β1/β0, α2 = −β2/β0, the aforementioned long-term impacts of respectively the lagged stock price increase and the stock price decreases on the trading volume (as a measure of the stock market liquidity), α3 = −β3/β0, α4 = −β4/β0, the aforementioned long-term impacts of respectively investor sentiment index increase (as a measure of the investor optimism) and the decrease in the investor sentiment index (as a measure of the pessimistic state of the investor). measures the short-term impacts of the increase in the stock price on the trading volume, while
captures the short-term impacts of stock price reduction on stock market liquidity (i.e. tv). Similarly,
measures the short term influences of optimistic state of the investor (as measure by the increase in the investor sentiment indicator) on the market liquidity while
captures the short-term influences of increase in the pessimism state of the investor (i.e. decrease in the investor sentiment indicator on trading volume.
We note here that the non-linear ARDL model is applied irrespective to whether the variables are I(0) or I(1). However, we cannot apply the Non-linear ARDL model in the presence of one or more I(2) variables. In fact, the presence of such variables affects significantly the estimates output and makes the computed F-statistics for testing cointegration invalid (Ibrahim, Citation2015). This requires starting firstly by testing for the integration order of each variable included in the estimates model using classical unit root test. Secondly (step 2), once the results confirm that all variable are integrated in an order less than two, consists to estimate equation 6 using the standard OLS method. We apply the general to specific procedure commonly applied previously in Katrakilidis and Trachanas (Citation2012) and Ibrahim (Citation2015) to define the final specification of our non-linear model. This technique consists to start by running the basic model considering the optimal lags and to delete, after each estimation, the insignificant lags till keeping only significant results for all independent variables. The third step consists of testing for the presence of cointegration based on the bound testing approach such as developed by Pesaran, Shin, and Smith (Citation2001) and extended recently by Shin, et al. (Citation2014). We test specifically for the null hypothesis that β0 = β1 = β2 = β3 = β4 = 0 using the Wald F-test. Once the existence of a cointegration relation is confirmed we examine in a next step the asymmetry in long and short-term relation between the stock market liquidity and each of the regressors (i.e. sp and sent). The last step consists to drive the asymmetric cumulative dynamic multiplier impacts of 1% increase and 1% decrease in each independent variable on the dependent variable. The asymmetric cumulative multiplier of 1% increase and 1% decrease in stock price can be calculated respectively, as follows:(7)
(7)
and(8)
(8)
The asymmetric cumulative multiplier of 1% increase and 1% decrease in the investor sentiment indicator is respectively, as follows:(9)
(9)
and(10)
(10)
As regarding the relations 7 to 10, we note that as n → ∞, ,
, and
, and at the same
(see, Ibrahim, Citation2015).
4. Results and discussion
Before investigating the dynamic linkages between the trading volume from one hand and the S&P500 index price and investor sentiment from the other hand, we have to test for the unit root in each series. In fact, the bounds testing procedure requires that no I(2) variable is included in the estimates equation. We used the classical unit root tests namely the augmented Dickey–Fuller (ADF), the Phillips–Perron (PP), and the Kwiatkwoski–Phillips–Schmidt–Shin (KPSS) unit root tests. Table summarizes the results for the different unit root tests. We show in this vein that all the selected variables are I(0) and I(1). There is no variable integrated at the order 2. Therefore, we can easily continue to estimate for the long and short-term with the Non-linear Autoregressive Distributed Lag (NARDL) Model.
Table 1. Unit root tests results
To estimate our Equation (1) we apply the general-to-specific procedure to arrive to the model final specification. This procedure was previously used in Ibrahim (Citation2015) and Atil, Lahiani, and Nguyen (Citation2014) among others. The maximum lag order considered is 4. The selection of the maximum lag order is based on AIC information criterion. Table presents the bounds F-statistics and Table reports the results of the dynamic non-linear estimates of the trading volume equation. The bounds F-statistics indicates that the trading volume, stock price and investor sentiment co-move in the long term. In fact the statistics 10.3728 exceeds the critical upper bound at the 5% significance level. Based on this result, we are able to assess the trading volume dynamics and its relation to positive and negative changes in stock price and investor sentiment.
Table 2. Bounds test for non-linear cointegration
Table 3. Dynamic non-linear estimation of the SP equation
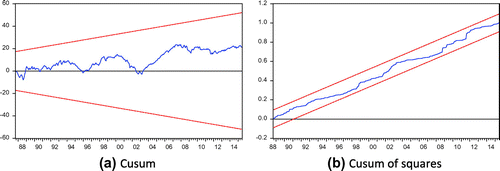
Before analyzing the long term and short term impacts of positive and negative changes in trading volume and investor sentiment on the stock price we first judge the adequacy of the dynamic specification based on various diagnostic statistics such as the normality, the LM serial correlation, the Heterisedasticity test, and the Reset test. The results for these tests are presented in Table . The estimates model appears to surpass all diagnostic tests suggesting the absence of autocorrelation at a 5% significance level and ARCH effect and parameter stability. The Cusum and Cusum of squares graphs (Figure ) confirm also the stability of the regression. The null hypothesis of error normality is however rejected and our model cannot surpass this test. Based on these results we can cautiously discuss our results since the dynamic of the stock market liquidity (tv), seems to be adequately specified.
Figure 1. Cusum and Cusum of squares at the 5% significance level.
The outcome of the analysis of null hypothesis of symmetry in long-term and the short-term is shown in Table . As regard the long-term relationship, the null hypothesis of symmetry in long-term against the alternative of asymmetry are tested using the Wald statistic such as: HLR,sp: α1 = α2 (i.e. ) and HLR,sent: α3 = α4 (i.e.
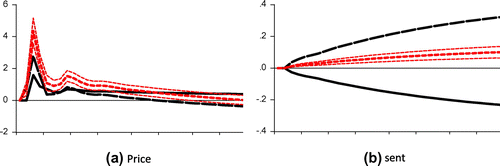
), respectively. The results (Table , column 2s and 3: long-term asymmetry) suggest the rejection of null hypothesis for both the stock price and the investor sentiment indicator. As for the asymmetry in short-term, we analyze the null hypothesis of symmetry against the alternative of asymmetry based on the dynamic multipliers graphs (Figure ). To test for the null hypothesis the procedure consists to use the Wald statistics with null: HSR.sp:
, and HSR.sent:
, respectively. The results (Table , columns 4 and 5: short-term asymmetry) suggest also the rejection of the null hypothesis of symmetry in the short-run.
Table 4. Asymmetry tests
Figure 2. Asymmetric cumulative dynamic multiplier impact of lagged returns and sentiment on trading volume.
Empirical results indicate an asymmetric long-term predictive power of positive and negative changes in stock price and sentiment index. As regards the stock price, the impact of both positive and negatives changes appears to be positive on the trading volume. We show especially that the long-term response of the trading volume to negative changes in stock price is obviously gradual than that of positive changes. In fact, the over-confident investors overestimate the likelihood of favorable price developments and assume that any reduction in prices following an increase is accentuated and reacts by increasing their purchasing demand resulting from a significant increase in transaction volumes. As for the under-confident investors the course decline is more likely that a favorable development, they react to any reduction by decreasing their offer (or their demand) in the hope of avoiding intensive losses, which is manifested by an increase in transaction volumes. Moreover, the pessimistic and optimistic investors increase their transaction volume. They first increase their transaction in the hope that stock prices are still improving. They buy now (increase their demand) and sell in future date (increase their offer) with the hope to realize a possible gain. While the pessimistic investor exhibit higher reservations and act aggressively by selling now before the price decreases again in the hope to avoid intensive losses. This reaction is explained by the fact they are highly sensitive to unexpected negative results.
The analysis of the dynamic effects between the involved variables can be further enriched by studying the dynamic multipliers. Figure plots the dynamic effects of positive and negative changes in stock prices and investor sentiments. We observe that trading volume respond rapidly and positively to both increases and decreases in stock prices. We show especially that the response to positive changes in stock prices is obviously gradual than to negative changes. The impact became highly smooth after about 4–5 months period corresponding to its equilibrium state. As regards the positive and negative changes in investor sentiment, we show a symmetric slow response of trading volume without achieving an equilibrium state over the whole analysis period.
The overall impression is that overconfident investors react aggressively and increase their trading expecting realizing great profit. In the same way, the under-confident investors overestimate the probability that bad results will occurs and react by increasing their trading volume expecting reducing their losses. As regards the optimistic and pessimistic investors, the reaction is quite slowly. In fact, the optimistic sentiment can take place after experiencing as long period with good news (positive results). The response in term of trading strategy changes can be slow speed.
5. Conclusion
The present paper investigates the dynamics relationship between trading volume from one hand and the stock price and the investor optimism-pessimism expectation from the other hand using monthly S&P stock market data. One of the contributions of our analysis to existing literature on trading volume—stock price relationship consists in using non-linear cointegration approach termed as Asymmetric Autoregressive Distributed Lag (NARDL). This approach allows examining the possible asymmetry in the short run as well as the long run. The study has employed daily data for the period from 17 July 1987 to 29 October 2015.
Our analysis has provided high accurate results. The presence of asymmetric long-term effect from the stock price and the investor sentiment towards the trading volume has been confirmed. In the short-term, the trading volume is significantly impacted by the lagged stock price only. The impact is highly rapid; a new equilibrium state is reached after about three to four months.
Overall our findings serve as confirmation that the stock market liquidity is nonlinear related to the fundamental financial variable such as the stock prices and to the investor sentiment, in particular the optimism-pessimism states. The response is highly sensitive to whether the changes in these variables are positive or negative. Especially, the speed of response and the time spent to reach new equilibrium state is highly short for the stock price. The optimism-pessimism expectation has no short-term significant impact. In the long-term, significant impact is confirmed. This helps, substantially, investors to adjust their investment strategies to these changes. Investors may make efficient decisions policy since they will be able to smoothen the negative impact of unexpected events or of bad expectation of the future reaction of the stock market.
Additional information
Funding
Notes on contributors
Abderrazak Dhaoui
Abderrazak Dhaoui is an assistant professor in finance at the Faculty of Economic Sciences and Management of Sousse (Tunisia). He is has carried out several research and articles focusing on the liquidity of the market, the sensitivity of stock prices to changes in oil price, to investor’s psychological traits, to political crises.
Sami Bacha
Sami Bacha is an assistant professor in accounting and finance since 1998. He teaches market finance and corporate finance in several universities in France and Tunisia. Sami is a member of a research group that focuses on finance and cognitive governance and their impact on manager’s and investor decisions. Sami has occupied several positions at the university (internship director, Master coordinator). He is a consultant to several companies and credit institutions.
Related Research Data
References
- Akerlof, G. A., & Shiller, J. S. (2009). Animal spirits: How human psychology drives the economy, and why it matters for global capitalism. Princeton, NJ: Princeton University Press.
- Atil, A., Lahiani, A., & Nguyen, D. K. (2014). Asymmetric and nonlinear pass-through of crude oil prices to gasoline and natural gas prices. Energy Policy, 65, 567–573.10.1016/j.enpol.2013.09.064
- Baker, M., & Stein, J. C. (2004). Market liquidity as a sentiment indicator. Journal of Financial Markets, 7, 271–299.10.1016/j.finmar.2003.11.005
- Barberis, N., Shleifer, A., & Vishny, R. (1998). A model of investor sentiment. Journal of Financial Economics, 49, 307–343.10.1016/S0304-405X(98)00027-0
- Beyer, A., & Guttman, I. (2011). The effect of trading volume on analysts’ forecast bias. The Accounting Review, 86, 451–481.10.2308/accr.00000030
- Boynton, W., Oppenheimer, H. R., & Reid, S. F. (2009). Japanese day-of-the-week return patterns: New results. Global Finance Journal, 20, 1–12.10.1016/j.gfj.2009.03.003
- Brailsford, T. J. (1996). The empirical relationship between trading volume, returns and volatility. Accounting & Finance, 36, 89–111.10.1111/acfi.1996.36.issue-1
- Brock, W., & LeBaron, B. D. (1996). A dynamic structural model for stock return volatility and trading volume. The Review of Economics and Statistics, 78, 94–110.10.2307/2109850
- Campbell, J. P., McCloy, R. A., Oppler, S. H., & Sager, C. E. (1993). A theory of performance. In C. W. Schmitt & W. C. A. Borman (Eds.), Personnel selection in organizations (pp. 35–70). San Francisco, CA: Jossey-Bass.
- Chen, J., Hong, H., & Stein, J. C. (2001). Forecasting crashes: Trading volume, past returns, and conditional skewness in stock prices. Journal of Financial Economics, 61, 345–381.10.1016/S0304-405X(01)00066-6
- Chen, S. S. (2012). Revisiting the empirical linkages between stock returns and trading volume. Journal of Banking and Finance, 36, 1781–1788.10.1016/j.jbankfin.2012.02.003
- Chordia, T., Roll, R., & Subrahmanyam, A. (2001). Market liquidity and trading activity. The Journal of Finance, 56, 501–530.10.1111/0022-1082.00335
- Chordia, T., & Swaminathan, B. (2000). Trading volume and cross-autocorrelations in stock returns. The Journal of Finance, 55, 913–935.10.1111/0022-1082.00231
- Crouch, R. L. (1970). The volume of transactions and price changes on the New York stock exchange. Financial Analysts Journal, 26, 104–109.10.2469/faj.v26.n4.104
- Daniel, K., Hirshleifer, D., & Subrahmanyam, A. (2001). Overconfidence, arbitrage, and equilibrium asset pricing. The Journal of Finance, 56, 921–965.10.1111/0022-1082.00350
- De Bondt, W., & Thaler, R. (1985). Does the stock market overreact? The Journal of Finance, 40, 793–805.10.1111/j.1540-6261.1985.tb05004.x
- Dhaoui, A. (2013). Animal spirits and trading volume in international financial markets between 2002 and 2011. Journal of Economic and Social Studies, 3, 163–185.10.14706/JECOSS11
- Dhaoui, A. (2015). What does matter in economy today: When human psychology drives financial markets. Arab Economic and Business Journal, 10, 39–47.10.1016/j.aebj.2014.12.002
- Dhaoui, A., Bourouis, S., & Boyacioglu, M. A. (2013). The impact of investor psychology on stock markets: Evidence from France. Journal of Academic Research in Economics, 5, 35–59.
- Dhaoui, A., & Khraief, N. (2014). Sensitivity of trading intensity to optimistic and pessimistic beliefs: Evidence from the French stock market. Arab Economic and Business Journal, 9, 115–132.10.1016/j.aebj.2014.05.008
- Epps, T. W. (1975). Security price changes and transaction volumes: Theory and evidence. The American Economic Review, 65, 586–597.
- Epps, T. W. (1977). Security price changes and transaction volumes: Some additional evidence. The Journal of Financial and Quantitative Analysis, 12, 141–146.10.2307/2330293
- Gallant, A. R., Rossi, P. E., & Tauchen, G. (1992). Stock prices and volume. Review of Financial Studies, 5, 199–242.10.1093/rfs/5.2.199
- Godfrey, M. D., Granger, C. W. J., & Morgenstern, O. (1964). The random-walk hypothesis of stock market behavior. Kyklos, 17, 1–30.10.1111/kykl.1964.17.issue-1
- Granger, C. W. J., & Morgenstern, O. (1963). Spectral analysis of New York stock market prices. Kyklos, 16, 1–27.10.1111/kykl.1963.16.issue-1
- Grossman, S. J., & Miller, M. H. (1988). Liquidity and market structure. The Journal of Finance, 43, 617–633.10.1111/j.1540-6261.1988.tb04594.x
- Haruvy, E., Stahl, D. E., & Wilson, P. W. (1999). Evidence for optimistic and pessimistic behavior in normal-form games. Economics Letters, 63, 255–259.10.1016/S0165-1765(99)00028-2
- Hayes, R. M. (1998). The impact of trading commission incentives on analysts’ stock coverage decisions and earnings forecasts. Journal of Accounting Research, 36, 299–320.10.2307/2491479
- Hiemstra, C., & Jones, D. J. (1994). Testing for linear and nonlinear Granger causality in the stock price volume relation. Journal of Finance, 49, 1639–1664.
- Ibrahim, M. H. (2015). Oil and food prices in Malaysia: A nonlinear ARDL analysis. Agricultural and Food Economics, 2, 14–21.
- Jackson, A. R. (2005). Trade generation, reputation, and sell-side analysts. The Journal of Finance, 60, 673–717.10.1111/j.1540-6261.2005.00743.x
- Kamara, A., & Koski, J. L. (2001). Volatility, autocorrelations, and trading activity after stock splits. Journal of Financial Markets, 4, 163–184.10.1016/S1386-4181(00)00018-5
- Karpoff, J. M. (1987). The relation between price changes and trading volume: A survey. The Journal of Financial and Quantitative Analysis, 22, 109–127.10.2307/2330874
- Katrakilidis, C., & Trachanas, E. (2012). What drives housing price dynamics in Greece: New evidence from asymmetric ARDL cointegration. Economic Modelling, 29, 1064–1069.10.1016/j.econmod.2012.03.029
- Kcherem, F., & Bouri, A. (2009). Fuzzy logic and investment strategy. Global Economy & Finance Journal, 2, 22–37.
- Keynes, J. M. (1936). The general theory of employment interest and money. London: McMillan.
- Lee, B. S., & Rui, O. M. (2002). The dynamic relationship between stock returns and trading volume: Domestic and cross-country evidence. Journal of Banking & Finance, 26, 51–78.10.1016/S0378-4266(00)00173-4
- Lee, Y. T., Fok, R. C. W., & Liu, Y. J. (2001). Explaining intraday pattern of trading volume from the order flow data. Journal of Business Finance and Accounting, 28, 199–230.10.1111/jbfa.2001.28.issue-1-2
- Mestel, R., Gurgul, H., & Majdosz, P. (2003). The empirical relationship between stock returns, return volatility and trading volume on the Austrian stock market (Research Paper). University of Graz, Institute of Banking and Finance, Graz.
- Otten, W. (1989). Optimism. Amsterdam: University of Amsterdam.
- Pathirawasam, C. (2011). The relationship between trading volume and stock returns. Journal of Competiveness, 3, 41–49.
- Pesaran, M. H., Shin, Y., & Smith, R. J. (2001). Bounds testing approaches to the analysis of level relationships. Journal of Applied Econometrics, 16, 289–326.10.1002/(ISSN)1099-1255
- Pisedtasalasai, A., & Gunasekarage, A. (2007). Causal and dynamic relationships among stock returns, return volatility and trading volume: Evidence from emerging markets in South-East Asia. Asia-Pacific Financial Markets, 14, 277–297.10.1007/s10690-008-9063-3
- Romilly, P., Song, H., & Liu, X. (2001). Car ownership and use in Britain: A comparison of the empirical results of alternative cointegration estimation methods and forecasts. Applied Economics, 33, 1803–1818.10.1080/00036840011021708
- Shin, Y., Yu, B., & Greenwood-Nimmo, M. (2014). Modelling asymmetric cointegration and dynamic multipliers in a nonlinear ARDL framework. Econometric Methods and Applications. doi:10.1007/978-1-4899-8008-3_9.281-314
- Tripathy, N. (2010). Expiration and Week effect: Empirical evidence from Indian derivative Market. International Review of Business Research Papers, 6, 209–219.
- Ulussever, T., Yumusak, I., & Kar, M. (2011). The day-of-the-week effect in the Saudi stock exchange: a non-linear garch analysis. Journal of Economic and Social Studies, 1, 9–23.10.14706/JECOSS11
- Weinstein, N. D. (1980). Unrealistic optimism about future life events. Journal of Personality and Social Psychology, 39, 806–820.10.1037/0022-3514.39.5.806