?Mathematical formulae have been encoded as MathML and are displayed in this HTML version using MathJax in order to improve their display. Uncheck the box to turn MathJax off. This feature requires Javascript. Click on a formula to zoom.
Abstract
Despite the large body of work that exists on the impact of exchange rate undervaluation on economic growth, only a mere literature focuses on the potential transmission mechanisms. There are authors who consider the size of the tradable sector as the operative channel through which undervaluation impacts economic growth. This is due to poor contracting environment and market failures that are prominent in the tradable sector as bad institutions “tax” tradables more than non-tradables. We look at this issue in this article for a set of emerging economies using annual data from 1970 to 2014. We find that the size of the tradable sector is indeed the operative channel through which undervaluation impacts growth. We have ruled out that bad institutions “tax” tradables more than non-tradables. Our results, robust to different undervaluation indexes, highlight instead the importance of total factor productivity surge induced by an undervaluation in increasing growth.
PUBLIC INTEREST STATEMENT
We analyse the transmission channels through which weaker exchange rates impact economic growth for a set of emerging economies. We first find a positive relationship between these two variables. Indeed, weaker currencies tend to boost economic growth. This is due to their impact on the tradable sector as they make exporting firms competitive. Following that price incentive, productivity in the tradable sector increases compared to the non-tradable. The final result is an increase in the country’s output produced as a whole and economic growth.
1. Introduction
There was a regained interest on the exchange rate undervaluation strategy pursued by most emerging economies, especially after the recent 2007 financial crisis, due to the increase in global imbalances. Although exchange rate should not matter for economic performance in a perfectly competitive environment, as changes in nominal exchange rate cannot have an impact on real prices (Mao & Yao, Citation2015), exchange rate distortion causing an undervaluation may lead to faster growth. The experience of most East Asian countries has shown that exchange rate level matters. Their astonishing growth has been attributed to a successful export-led strategy fuelled by artificially low exchange rates. Despite the early view from the “Washington consensus” that considers the exchange rate as set according to some internal and external balances and that any misalignment will be detrimental to the economy (Williamson, 1994), some empirical research has proven the existence of a positive correlation between exchange rate and undervaluation. Levy-Yeyati and Sturzenegger (Citation2007) have shown that “fear of appreciation” is more prevalent with countries intervening in order to postpone currencies appreciation. Despite the large body of literature that exists on the topic, few articles have analysed the transmission mechanism through which undervaluation impacts growth.
Levy-Yeyati and Sturzenegger (Citation2007) explain that an undervalued currency reduces labour cost, providing internal funds to financially constrained firms and fostering savings and investment. In a financially constrained economy, there will be a transfer from low income and low propensity to save workers to high-income capitalists. This should boost savings and lower the cost of capital. Thus, undervaluation will be expansionary due to the relaxation of borrowing constraints faced by firms. Rodrik (Citation2008) considers a different channel. He states that tradables, especially in developing countries, face weaknesses in contracting environment and are subject to market failures. An undervaluation moves factors from non-tradables to tradables, increasing the share of the latter into production and its profitability. Thus, the effects of exchange rate undervaluation on growth operate partially through the change in the relative size of the tradables. Another investigated channel looks at the impact of undervaluation on growth through an increase in factor productivity. According to this channel, a depreciated currency, which corresponds to an increase in the price of tradables relative to non-tradables, improves the profitability of the former. Therefore, production will shift to the tradable sector, as it is characterized by higher productivity, improving the economy productivity as a whole (Mbaye, Citation2012). Guangjun and Sylwester (Citation2010) test Rodrik’s (Citation2008) claim that weak institutions hurt the development of the tradable more than the non-tradable sector. This claim implies a positive correlation between institutional quality (IQ) and the relative size of the tradable sector. They analyse the correlation between four components of IQ and the size of tradable relative to the non-tradable sector for a sample of 131 countries from 1984 to 2006. They find instead a strong negative correlation between these two variables. This finding implies that weak institutions do not impose a higher “tax” on tradables relative to non-tradables, casting doubt on Rodrik’s (Citation2008) claim. McLeod and Mileva (Citation2011) analyse the impact of real exchange rate (RER) changes on total factor productivity (TFP) growth for a panel of 58 developing countries between 1975 and 2004. They find a strong support for a positive causal correlation between weak exchange rate and higher TFP growth. Their results support the tradable sector as the operative channel for TFP transmission mechanism. Using a large sample of developed and developing countries, Mbaye (Citation2012) estimates the impact of undervaluation on economic growth and tests for the TFP channel. He follows Rodrik (Citation2008) and estimates an undervaluation purchasing power parity (PPP) index that takes into account the Balassa–Samuelson (BS) effect. He finds that real undervaluation is associated with a growth surge and the impact is even stronger for developing countries. He examines the TFP channel in an attempt to explain the positive correlation between growth and undervaluation. He finds a strong support for this channel with undervaluation enhancing growth through a rise in productivity.
This article examines the potential transmission mechanism of undervaluation on economic growth for a sample of 14 emerging economies. We contribute to the literature by using an index of undervaluation that is robust to cross-sectional dependence while analysing the impact of undervaluation on economic growth. We investigate the most important channels of transmission recognized in the literature. We start by testing two claims. The first is that the size of the tradable sector is the operative channel through which undervaluation impacts growth. According to Rodrik (Citation2008), an undervaluation increases the profitability of the tradable sector and leads to its expansion relative to the non-tradables. The increase in the tradables explains part of the impact of undervaluation on growth. The second claim explains why an expansion of tradables fosters growth. Rodrik (Citation2008) states that weak institutions, especially in developing countries, “tax” tradables more, reducing the ability of private investors to appropriate the returns on their investment. An undervaluation is therefore a second best mechanism for alleviating institutional weakness. Thus, according to this claim, the relative size of the tradables to non-tradables will be positively correlated to a measure of IQ as the worse institution will impose a relatively higher “tax” on tradables. This implies a smaller size of tradables relative to the non-tradables for developing countries. We next follow Matsuyama (Citation1992) framework and test the existence of a TFP channel. According to this channel, an undervalued currency improves the profitability of the tradable sector. Following the price incentive, there is a shift of production from non-tradables to tradables. This size increase improves productivity through some form of “learning by doing”. We find that the tradable sector is indeed the operative channel through which undervaluation impacts economic growth. However, there is no proof of weak institutions imposing a “higher tax” on tradables relative to non-tradables as claimed by Rodrik (Citation2008). The relevant channel for these economies is the impact of undervaluation on economic growth through the increase of productivity. The claim about the size of the tradable sector does not hold as weak institutions do not impose a higher tax on tradables.
The remainder of the article is organized as follows: The next section presents the theoretical framework based on Rodrik’s (Citation2008) work and a modification of Matsuyama’s (Citation1992) framework. The data and methodology are presented in Section 3. Section 4 presents the empirical results, and Section 5 concludes.
2. Theoretical framework
2.1. Tradable sector, institutional quality and undervaluation
There is a mere literature that investigates the transmission mechanism through which an exchange rate undervaluation impacts economic growth. Among this, we have the work of Rodrik (Citation2008) that investigates the impact of undervaluation on economic growth. The starting point of Rodrik (Citation2008) is to define the RER as the relative price of tradable goods in terms of non-tradable goods and compute a PPP undervaluation index adjusted for the BS effect. This implies regressing the RER on real GDP per capita. The equilibrium exchange rate is given by the predicted values from this regression.
Following the strong positive correlation between undervaluation and economic growth, especially for developing countries, Rodrik (Citation2008) finds that the tradable sector is the operative channel which explains this relationship. He shows that an undervaluation increases the size of the tradable sector, especially the industrial sector. In order to explain this finding, he presents two theories that explain the mechanisms through which the increase in the size of tradables impacts growth. The first is linked to the contracting environment, especially in developing countries. According to Rodrik (Citation2008), the tradable sector suffers disproportionately relative to the non-tradable sector from weak institutions and the inability to completely specify contracts that characterize developing countries. Weak institutions “tax” tradables more relative to non-tradables due to contractual incompleteness, hold-up problems, lack of property rights and poor contract enforcement. This reduces the ability of private investors to appropriate the return on their investments. An increase in the price of tradables is then the second best mechanism to partially alleviate the relevant distortion and increase growth. The second is the theory of market failures that render structural transformation and diversification difficult. Here too, undervaluation can alleviate these distortions.
These pitfalls were also recognized by early development of new institutional economics, such as North (Citation1990) and Acemoglu, Johson, Robinson, and Thaicharoen (Citation2003). We can note the observation that across countries lower quality of institutions is associated with lower openness. We will focus testing that the tradable is the operative channel and that weak institutions impose higher “tax” to tradables relative to non-tradables. The next section looks at the TFP channel.
2.2. Open economy, real exchange rate and total factor productivity
The second transmission mechanism is a tentative of explaining how a shift of production towards tradables improves productivity. There are two important channels that may explain the increase in productivity. The first is the learning by doing effect which can be separated into the private and the external effects. The private learning by doing effect relates the increase in productivity on the accumulation of knowledge. Workers acquire skills as they learn new technology, thanks to R&D, increasing human capital. This accumulation of human capital is the foundation of endogenous growth models. Mbaye (Citation2012) argues that a shift of production towards tradables will increase productivity if this effect is more present on that sector. The external effect arises when the learning by doing effect can spill over to other firms or different sectors. The external effect can be explained by labour mobility across firms or sectors. The second channel, the “pure composition effect”, is explained by the higher productivity of the tradables relative to the non-tradables. Therefore, a reallocation of production from non-tradables to tradables will increase productivity in the whole economy.
We use an endogenous growth model to explain the transmission mechanism. The choice of this model stems from the fact that the accumulation of knowledge is the reason why output and standards of living are much higher today than centuries ago (Romer, Citation1996). In this model, investments on human capital and R&D are the fundamentals that explain long-run economic growth. Romer (Citation1996) highlights that they are relevant given the world’s growth experience.
We follow Matsuyama’s (Citation1992) and Rodriguez and Rodrik’s (Citation2001) open two-sector model of endogenous growth and McLeod and Mileva’s (Citation2011) extension. The model focuses on labour mobility between a non-tradable NT and a tradable T sector. The latter is subject to increase productivity due to some form of “learning by doing”. Employment shifts between the sectors, and there are decreasing returns to scale. Here the real exchange qi,t depends on the nominal exchange rate, ei,t, the exogenous price of tradables sets in international markets and the domestic price of non-tradable goods,
. So the RER is given by the following expression:
where . The RER can be affected by managing the nominal exchange rate or by using monetary policy to influence the domestic price on non-tradable goods
. As in Matsuyama (Citation1992), labour is the only mobile factor of production and labour endowment is normalized to 1. As shown by Matsuyama (Citation1992), the size of the population does not matter in the solution of the problem. The two sectors face identical diminishing returns technologies (0 < α < 1). Given that
is the share of labour in the tradable sector, the production functions for both sectors are given by:
The non-tradable productivity level given by B is constant, while the tradable sector is subject to increasing productivity with the level of output through learning by doing. However, this increase in productivity is not affected by changes in non-traded output. The learning by doing is external to the individual firm but internal to the sector as a whole. Thus the tradables’ productivity evolves according to:
where is the exogenous rate of learning by doing. Due to competition and mobility between sectors, their marginal products of labour are equal and given by:
where is the RER as defined by (1). The RER will affect the allocation of labour between tradables and non-tradables. A weaker RER which corresponds to a higher
will raise the marginal productivity of labour and real wages in the tradable. This will happen until the movement of labour into the tradable sector equalizes the marginal product of labour economy wide.
Substituting Equation (2) into (4) yields the growth rate of productivity in the tradables as a function of the share of labour employed in that sector and the learning by doing externality. This is provided by the following expression:
Equation (5) defines as a function of
. An increase in exchange rate will have the effect of allocating more labour into the tradable sector as:
This will raise productivity through Equation (6). For a constant level of , labour evolves according to:
The total output evaluated in domestic prices is given by:
Taking derivatives of Equation (8) with respect to time and using Equations (1), (2) and (5), we obtain the instantaneous rates of growth of output in terms of domestic prices:
where represents the tradable share of output in domestic prices. As learning by doing is the only source of productivity growth in the tradables in the long run, overall productivity will depend only on the share of labour
in that sector. This implies a steady-state overall TFP growth given by:
During the transition, changing the RER changes the labour share . Productivity growth will also depend on the rate at which labour share changes over time or how fast changes in the RER
move labour out of the non-traded sector with fixed productivity level B into the dynamic tradable sector. This is given by:
where . Equations (9) and (11) predict that a higher RER,
, meaning a larger depreciation, will lead to a faster growth in the tradable sector and a higher overall GDP. This is due to the surge in TFP and GDP growth as depreciation of RER leads to rapid reallocation of labour into the tradables, accelerating learning by doing. Let note that
can be replaced by an undervaluation index.
3. Econometric framework
The article uses several models to analyse the transmission channel through which exchange rate undervaluation impacts economic growth. We use various estimators besides the usual panel data fixed effects (FE). The index of exchange rate undervaluation, which comes from the work of Tipoy, Breitenbach, and Zerihun (Citation2017b), is computed using the cross-section autoregressive distributed lag (CS-ARDL) of Chudik, Mohaddes, Pesaran, and Raissi (Citation2016). This estimator is robust to cross-sectional dependence.Footnote1
Let us consider the following panel regression without additional explanatory variables:
where represents the observable variable; i and t are, respectively, the cross-sectional unit and the time period; and
is the error term. Assuming a one-way error component, then
, where
represents the individual unobserved effect and
the remainder of the error term. Due to the presence of
, Equation (12) will be dynamic and yi,t−1 will be correlated to
due to its correlation with
. Therefore, ordinary least squares estimator will be biased and inconsistent. Both fixed and random effects will also be biased (Baltagi, Citation2008). Arellano and Bond (Citation1991) propose a general method of moment (GMM) to estimate (12). According to this estimator, there are internal instruments for yi,t−1 provided by the different lags of this variable. Therefore, the matrix of instruments for a cross-sectional unit i is given by:
The matrix of instruments for all cross-sectional units can be written as. . Differencing Equation (12) to eliminate the individual effect
and multiplying by W, we get:
Using generalized least squares, we get the following preliminary one-step consistent estimator:
where G is a matrix of size (T − 2) × (T − 2) having 2 on the diagonal, −1 on the off-diagonal and 0 everywhere else.
An optimal estimator of ρ can also be obtained by replacing by
as in Hansen (Citation1982). In this expression,
is given by the differenced residuals from the one-step consistent estimator
. The two-step estimator is given by the following:
with a consistent estimator of given by:
Blundell and Bond (Citation1998) advocate a system GMM (SGMM) that adds the lagged differences of yi,t as additional instruments for the equations in levels, in addition to the lagged levels of yi,t as instruments for the equations in first differences. This estimator improves efficiency compared to the first-difference GMM as ρ → 1 and reduces the finite sample bias. In case of strictly exogenous covariates, these variables will be valid instruments in the differenced equation. They will be added in the matrix of instruments given by (13). Equation (14) will become:
The one- and two-step estimator can be given by the following:
There are two specification tests following a GMM. The first tests for the lack of second-order serial correlation for the disturbances of the first-differenced equation. The consistency of the GMM estimator depends on E[∆vi,t∆vi,t−2] = 0. The second is a test of overidentifying restrictions. This tests whether all instruments are uncorrelated with the residuals (Baltagi, Citation2008).
The second estimator used in this article is a variant of the two-stage least squares (TSLS). This estimator can be used to test whether the effect of a variable Xi,t on Yi,t can be explained by the impact of the former on a variable Si,t.Footnote2 This system can be illustrated using the following models:
where ft is the time fixed effect and represents the fitted values of regression (20). Under this specification, this variable will represent the induced effect of Xi,t on Si,t. Therefore, the estimate β of Equation (21) will capture whether the effect of Xi,t on Yi,t operates through the impact of Xi,t on Si,t.
4. Empirical evidence
This article uses annual data for 14 emerging economies from 1970 to 2014. These economies are Argentina, Brazil, China, Egypt, India, Indonesia, Malaysia, Mexico, Morocco, Pakistan, Philippines, South Africa, Thailand and Turkey. The choice of emerging economies stems from the fact that the impact of undervaluation on growth tends to be larger for these countries (see Rodrik (Citation2008) and Couharde and Sallenave (Citation2013)). In this article, emerging economies are countries that have passed criteria set by Standard and Poor (S&P) FTSE country classification in order to qualify as an emerging economy.Footnote3 Before testing the claim that the tradable sector is the operative channel, we provide in the results of the impact of our misalignment index on economic growth. Due to the endogeneity issue and possible reverse causality, we use the SGMM of Blundell and Bond (Citation1998).Footnote4 From our additional covariates, only human capital and government consumption are not statistically significant at conventional levels. Investment is correctly signed in the second and last specification. For a 1% increase in investment, growth rises by 0.14% or 0.15%. The estimate on population is positive. This is contrary to the Solow growth model which predicts a negative relationship between population size and economic growth. Focusing on our model of interest, the estimate on misalignment is positive and significant in all three models. This proves the existence of a positive correlation between undervaluation and economic growth. We can note as well that a non-linear, parabolic, relationship exists between our misalignment index and economic growth as the estimate on the quadratic term is significant in all three specifications. Thus, as undervaluation increases, its impact on growth increases, reaches a maximum and then decreases. The results support the view that there is something special about undervaluation. We next analyse the transmission mechanism through which undervaluation impacts economic growth.
Table 1. Undervaluation and growth
We start by testing Rodrik’s (Citation2008) claim about the tradable sector being the operative channel through which undervaluation impacts growth. We graph side by side our misalignment index and the industry VA, a proxy for the size of the tradable sector, for selected countries in of the appendix from 1970 to 2014. The misalignment index is from the work of Tipoy et al. (Citation2017b) and estimated using the parsimonious model of Alberola (Citation2003), and the industry VA is from the World Bank Development indicators. Looking at Argentina, the undervaluation index tracks somewhat the tradable sector movement. Up to the mid-1970s, the rise and fall of undervaluation are tracking perfectly the change of the tradable sector. After this period, despite the rise in undervaluation, the country witnessed a fall in tradables. Again, in the mid-1980s, the movement between the two variables is synchronized up to the late 2000s when the relation breaks down. For Brazil, there is no synchronization up to the early 1990s whereby the large increase in undervaluation is accompanied by a rise in tradable. From the 2000s, the undervaluation index has reached a plateau, while the tradable sector has experienced some moderate swings. Same tendency for Egypt and India where we can note a certain synchronization from the early 1990s up to the mid-2000s.
We test the relationship between undervaluation and the size of the tradable sector. Following Rodrik (Citation2008), we estimate the below regressions using TSLS:
where in model (22), Shi,t is the share of the tradable sector for country i at year t, Rgdpi,t is the real GDP, Undervali,t is our index of undervaluation, ft is the time fixed effect and is the idiosyncratic error term. In model (23), Growthi,t is the log difference of real GDP, Initiali,t is the one-year lagged real GDP and
is the fitted values from model (22). All the variables are in log form except Growthi,t which is in percentage. The variables are from the World Bank Development indicators except the misalignment index. A significant and positive estimate on Misali,t will indicate that undervaluation increases the size of the tradable sector.
By the same token, a significant and positive estimate on will indicate that the increase in the size of the tradable sector explained by undervaluation increases growth. In that sense, the tradable sector will be the operative channel. As the misalignment index combines overvaluation and undervaluation of exchange rate, we break down this index using a dummy variable Dt taking the value of 1 when currencies are undervalued and 0 otherwise. The undervaluation and overvaluation indexes are computed as:
presents the different results for the full sample and for a sub-sample starting from 1990.Footnote5 For the full sample in the first stage, undervaluation is not statistically significant in explaining the share of industry value added (VA). However, when using both and
, we can note that the former variable increases significantly the size of the tradable sector while the latter decreases it. Given these results, we estimate the second stage. The estimate on
is positive and significant. This proves that the effect of misalignment on growth operates through the size of the tradable sector. For the sub-sample starting from 1990, the results prove as well that the tradable sector is the operative channel given the significance and sign on the different estimates in the first and second stages. The next section examines the claim about weak institutions, especially in developing countries, as the explanation of the positive relationship between the size of the tradable sector and economic growth.
Table 2. Effect of undervaluation on tradables and growth
The next step is to test for Rodrik’s (Citation2008) claim about weak institutions imposing a higher “tax” on tradables relative to non-tradables. Following Guangjun and Sylwester (Citation2010), we estimate the model below:
where TNi,t is the size of tradables over the non-tradables in country i for year t; IQi,t is an index of IQ, proxied by the variable polity2 from the Center for Systemic Peace database; and Xi,t is a set of control variables such as the real GDP, the trade share proxied by the openness index, the terms of trade proxied by the ratio of export price over import price and real GDP squared to test for non-linearities. All the variables come from the World Bank Development indicators except the index of IQ. A significant and positive estimate on IQi,t will indicate that the worse IQ imposes a higher “tax” on tradables, rendering this sector smaller than the non-tradables. Thus, undervaluation becomes the second best strategy that leads to an investment increase in the tradable sector which spurs growth. As in Rodrik (Citation2008), we use the industry VA to GDP as a proxy for the size of modern tradables and the service VA to GDP as a proxy for non-tradables.Footnote6 presents the different results. The estimates on the quadratic terms are not statistically significant, ruling out non-linearities between relative size and real GDP. An increase in output has a positive impact on the relative size of tradables. Openness is significant but negative, contrary to our expectations, with very low magnitude. An improvement of the terms of trade increases significantly the relative size of the tradable sector. The four models present a consistent result while considering the estimate on IQ. The variable is negative but statistically insignificant.Footnote7 This proves that weak institutions do not impose a “higher tax” on the production of tradables relative to non-tradables in those emerging economies, casting doubt on Rodrik’s (Citation2008) claim. Guangjun and Sylwester (Citation2010) too find that bad institutions do not impose a higher “tax” on tradables over non-tradables.Footnote8 We therefore conclude that there is no supporting evidence on Rodrik’s (Citation2008) claim. Given these results, there is a need of explaining a different mechanism through which a rise in the tradable sector size increases growth. This is what we do in the next section by focusing on the TFP channel.
Table 3. Tradable size and institutions quality
In order to test for the TFP channel, we first model the link between our index of misalignment and TFP using a modified version of McLeod and Mileva (Citation2011). We provide several specifications using additional covariates. Then, we test if the component of TFP that is directly induced by undervaluation, using the first specification, is positively related to growth. We estimate the following models using TSLS:
where TFPGi,t indicates the growth rate of TFP, TFPi,t−1 is the one-year lagged TFP in log form, Misali,t is our misalignment index defined as above, is the fitted values from regression (27), Xi,t is the set of additional covariates and ft a time fixed effect. The TFP variable comes from the Penn World tables version 9.0. The additional covariates are the following: Investment proxied by the gross fixed capital formation as a percentage of GDP, human capital proxied by an index of human capital per person based on years of schooling (Barro & Lee, Citation2013) and returns to education (Psacharopoulos, Citation1994), government consumption as a percentage of GDP, trade openness proxied by the sum of imports and exports as a percentage of GDP and the inflation rate and the terms of trade proxied by the ratio of price level of exports over price level of imports. All the variables are from the World Bank Development indicators except TFP, human capital and terms of trade which are from the Penn World tables version 9.0. We first present the results of model (27) estimated using SGMM under . The initial TFP is negative and significant in all specifications except the last one. This implies that countries with higher TFP will have lower growth rates. Investment is positive and significant under the fourth specification implying an increase in TFP. Our variable of interest is significant in all specifications. This implies that a rise in undervaluation increases TFP growth rate significantly. The second stage uses the fitted values,
, from regression (27) (SGMM-1).
Table 4. Effect of undervaluation on TFP
We use again SGMM estimator in order to estimate model (28) to test the impact of TFP induced by undervaluation on economic growth. presents the results. The initial level of GDP is negative under specifications 1 and 3 but significant only in the first supporting the convergence hypothesis. A rise in savings tends to increase economic growth significantly. Investment as well is positively correlated to economic growth. Indeed, in all three specifications, the estimates are significant and positive. An improvement of the terms of trade impacts positively economic growth. Human capital is insignificant in all three specifications, while openness and government consumption have a positive impact on economic growth. Looking at our variable of interest, the impact of is significant and positive in all three specifications. A 1% rise in TFP induced by undervaluation increases significantly economic growth by 0.6–0.9%. This magnitude is large, shedding light on the impact of undervaluation on TFP and economic growth. Indeed, given these estimates, the TFP channel explains most of the positive correlations between undervaluation and growth. An undervaluation makes the tradables more profitable. This leads to a transfer of resources to the tradable sector. Due to some form of learning by doing, this increase in resources impacts positively economic growth (Mbaye, Citation2012). All three specifications have passed the diagnostic tests as the results indicate no serial correlation of second order and that the instruments used are exogenous as a group.
Table 5. Effect of TFP on growth
5. Robustness checks
We test the robustness of our results by analysing the impact of exchange rate undervaluation on economic growth and the transmission channels using the PPP-based index of undervaluation. We use a larger sample comprising 17 emerging economies: Argentina, Brazil, Chile, China, Colombia, Egypt, India, Indonesia, Malaysia, Mexico, Morocco, Pakistan, Peru, Philippines, South Africa, Thailand and Turkey. We use annual data ranging from 1960 to 2014. All the variables are from the Penn World table version 9.0 except the data on IQ which are from the variable polity2 from the Center for Systemic Peace database. We estimate the misalignment index following the three equations of Rodrik (Citation2008). First, the RERs are computed using nominal exchange rates (XRAT) and purchasing power parity conversion factors (PPP) as follows:
where i represents the different countries and t indexes five-year time periods.Footnote9 A value of lnRER greater than 1 will indicate that the exchange rate is more depreciated than indicated by the PPP. Second, we adjust the RER from the BS effect by estimating the following regression:
where lnRgdpch is the log of real GDP per capita in chained values. The results are presented below with the t-stats in parentheses.
We obtain a significant but positive estimate on lnRgdpch. This result implies that the BS does not hold for these emerging economies. These results support Tipoy et al.’s (Citation2017a) and Tipoy et al.’s (Citation2017b) findings. The next step is the computation of our misalignment index. This is done using the following expression:
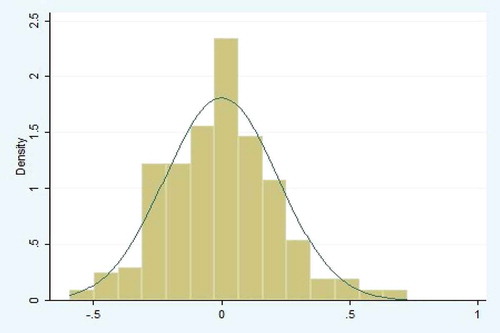
where represents the fitted values in log from regression (30). Using this expression, a currency will be undervalued (overvalued) if Misali,t is positive (negative). Defined this way, the misalignment index will be comparable between countries. of the appendix plots the misalignment index computed. This index is centred around a mean of 0.00 with a standard deviation of 0.220.
We add the misalignment index constructed to a growth regression. We use again the SGMM of Blundell and Bond (Citation1998). presents the results. Focusing on the index of undervaluation, its estimate is positive and significant in all specifications. According to these results, a rise in undervaluation spurs economic growth during a 5-year period. This is true even when controlling for other explanatory variables.Footnote10 These results support our findings that a rise in undervaluation tends to boost economic growth.
Table 6. Undervaluation and growth
We analyse the transmission channel by first testing if the tradable sector is the operative channel. We estimate Equations (22) and (23) using TSLS. presents the results. We can note that, although positive, the estimate on the undervaluation index is not statistically significant. However, on the second stage, the induced industry VA significantly increases economic growth. The next two columns are based on a sub-sample starting in 1980. This captures the fact that most of the export-led growth strategy started after this year (see Couharde and Sallenave (Citation2013)). The estimate on our variable of interest is significant and positive. This implies that a rise in undervaluation increases the size of the tradable sector. The second stage results show that the induced effect of undervaluation on the size of the tradable sector impacts positively economic growth. This supports our previous finding that the tradable sector is indeed the operative channel.
Table 7. Effect of undervaluation on tradables and growth
We next investigate the claim that bad institutions “tax” heavily the tradable sector relative to the non-tradable. We therefore estimate Equation (26). The results are provided in . As it can be seen, the proxy on IQ is insignificant. We then test for a sub-sample starting in 1990.Footnote11 Again, our IQ proxy is not significant. We cast doubt on Rodrik’s (Citation2008) claim about bad institutions imposing a higher “tax” on tradables. These results support our previous findings. We next investigate the TFP channel.
Table 8. Tradable size and institutional quality
We estimate a TSLS procedure to test the TFP argument. First, we estimate Equation (27) and then we use the induced TFP in a growth regression. presents the results of this first stage using SGMM. Indeed, a rise in undervaluation increases significantly TFP in all three specifications. For the second stage, we use the induced TFP from the first specification.
Table 9. Effect of undervaluation on TFP
We estimate the second-stage growth regression using SGMM. Additional covariates are used. From , we can note that our variable of interest is positive and significant in all three specifications. Indeed, a rise in induced TFP increases economic growth significantly. These results support the TFP channel and our previous findings.
Table 10. Effect of TFP on growth
6. Conclusion
A vast literature has investigated the impact of undervaluation of exchange rate on economic growth. Despite the findings that undervaluation tends to be positively correlated with economic growth, there is a mere literature that explains the mechanism. We analyse the channels through which an undervaluation of exchange rate can impact economic growth for a set of emerging countries using annual data from 1970 to 2014. The undervaluation index is constructed using the parsimonious model of Alberola (Citation2003). We start by testing two of Rodrik’s (Citation2008) claims. The first asserts that the tradable sector is the operative channel through which undervaluation spurs growth. The second shows that tradables are special as bad institutions “tax” them more relative to the non-tradables. This reduces the ability of private investors to appropriate the return on their investments. An increase in the price of tradables is the second best mechanism to partially alleviate the relevant distortion and increase growth. Lastly, we examine the existence of a TFP channel that explains this positive correlation.
After proving the positive impact of undervaluation of exchange rate on economic growth and the existence of non-linearities, we find that the tradable sector is the operative channel explaining this correlation. Indeed, an increase in the size of the tradable sector induced by exchange rates undervaluation tends to significantly increase economic growth. However, we cast doubt on the claim that bad institutions “tax” tradables more relative to non-tradables. The explanation we provide is the impact of undervaluation on TFP. We find that a TFP growth induced by undervaluation significantly increase economic growth. Our results are similar to those of McLeod and Mileva (Citation2011) and Mbaye (Citation2012) that validate the existence of a TFP channel. Our results are robust to different countries and undervaluation index.
The policy implication is straightforward. First, developing countries can pursue an undervaluation strategy to foster productivity and economic growth. An undervaluation of exchange rate will render the tradable sector more competitive and support an export-led growth strategy. However, there is a need to weigh the pros and cons of this type of strategy. How high the undervaluation needs to be to get the most return? Developing countries have large foreign currency denominated debts, and an undervaluation strategy will therefore increase the liabilities burden. Do the returns of undervalued currencies outweigh the costs? Answering these questions can help to adopt the best strategy. Besides, this strategy will contribute to the accumulation of foreign reserves and to global imbalances. Thus, this can lead to tensions between countries. There is a need to investigate further this mechanism by analysing other potential channels that may exist.
Additional information
Funding
Notes on contributors
Christian K. Tipoy
Dr Christian K. Tipoy is a lecturer at the University of KwaZulu-Natal. He holds a Ph.D. in economics from the University of Pretoria. He has several years of experience teaching macroeconomics and econometrics. His research focuses mainly on applied macroeconomics.
Marthinus C. Breitenbach
Marthinus (Martin) C. Breitenbach holds a Ph.D. in Economics from the University of Pretoria. He has been teaching Economics since 1990. He has authored and co-authored many publications. He has worked in Economic Development, Agricultural Economics and International Trade. His most recent collaborative work has been in exchange rate dynamics.
Mulatu F. Zerihun
Dr Zerihun is currently a Senior Lecturer at the Tshwane University of Technology (TUT). He holds a Doctor of Business Administration (DBA) from TUT and Ph.D. in economics from the University of Pretoria. His research endeavours have been focused on exploring developmental issues in Africa. He has authored/co-authored several research articles.
Notes
1. The details of the exchange rate computation can be found in Tipoy et al. (Citation2017b).
2. The TSLS strategy was also followed by Rodrik (Citation2008). Although this system does not correspond to a fully fledged TSLS, we have preferred keeping, as Rodrik (Citation2008), this acronym.
3. The following 21 countries have been identified as emerging economies: Brazil, Czech Republic, Hungary, Malaysia, Mexico, Poland, South Africa, Taiwan, Thailand, Turkey, Chile, China, Colombia, Egypt, India, Indonesia, Pakistan, Peru, Philippines, Russia and the United Arab Emirates. Due to data availability, we have restricted the study to a smaller set.
4. This article is a series of chapters from my PhD thesis. In previous articles, we have proven the existence of a positive relationship between misalignment of exchange rate and economic growth using panel smooth transition regression models. We therefore keep the estimation simple here.
5. The 1990 sub-sample is also used here as we have noted a certain synchronization from that year between the size of tradable and our misalignment index for most countries.
6. As in Rodrik (Citation2009), we recognize that modern tradables are mainly industrial goods although some tradable services are becoming important.
7. As institutional quality will have low variability over time, we have also run a random effect. The estimates on IQ were still negative and statistically insignificant. The results are available upon request.
8. As in Guangjun and Sylwester (Citation2010), we have replaced the current IQi,t variable with its 5-year lagged as institutional changes can have persistent influences. Here again we have found no significant relationship between IQ and relative size of tradables. The results are available upon request.
9. All variables used are five years averages unless otherwise specified.
10. Several specifications with various control variables were used. We found a significant and positive relationship between undervaluation and economic growth. The results are available upon request.
11. We test also a sub-sample starting in 1980. The estimates on IQ were not statistically significant.
References
- Acemoglu, D., Johson, S., Robinson, J., & Thaicharoen, Y. (2003). Institutional causes, macroeconomics symptoms: volatility, crises and growth. Journal of Monetary Economics, 50(1): 49– 123.
- Alberola, E. (2003). Misalignment, liabilities dollarization and exchange rate adjustment in Latin-America (Banco de Espana Research Paper No. WP-0309).
- Arellano, M., & Bond, S. (1991). Some tests of specification for panel data: Montecarlo evidence and an application to employment equations. The Review of Economic Studies, 58(2), 277–297. doi:10.2307/2297968
- Baltagi, B. (2008). Econometric analysis of panel data. New York, NY: John Wiley & Sons.
- Barro, R. J., & Lee, J. W. (2013). A new data set of educational attainment in the world, 1950–2010. Journal of Development Economics, 104, 184–198. doi:10.1016/j.jdeveco.2012.10.001
- Blundell, R., & Bond, S. (1998). Initial conditions and moment restrictions in dynamic panel data models. Journal of Econometrics, 87(1), 115–143. doi:10.1016/S0304-4076(98)00009-8
- Chudik, A., Mohaddes, K., Pesaran, M. H., & Raissi, M. (2016). Long-run effects in large heterogenous panel data models with cross-sectionally correlated errors. In Essays in Honor of Aman Ullah (pp. 85-135). Emerald Group Publishing Limited.
- Couharde, C., & Sallenave, A. (2013). How do currency misalignments threshold affect economic growth? Journal of Macroeconomics, 36, 106–120. doi:10.1016/j.jmacro.2012.11.002
- Guangjun, Q., & Sylwester, K. (2010). Undervaluation, institutions, and development (Discussion Paper No. 2010-04). Carbondale, IL: Southern Illinois University.
- Hansen, L. P. (1982). Large sample properties of generalized method of moments estimators. Econometrica: Journal of the Econometric Society, 50, 1029–1054. doi:10.2307/1912775
- Levy-Yeyati, E. L., & Sturzenegger, F. (2007). Fear of appreciation (World Bank Policy Research Working Paper Series, 4387.
- Mao, R., & Yao, Y. (2015). Fixed exchange rate regimes, real undervaluation and economic growth. Journal of International Commerce, Economics and Policy, 7(2): 1650008.
- Matsuyama, K. (1992). Agricultural productivity, comparative advantage and economic growth. Journal of Economic Theory, 58, 317–334. doi:10.1016/0022-0531(92)90057-O
- Mbaye, S. (2012). Real exchange rate undervaluation and growth: Is there a total factor productivity growth channel? (CERDI Working Paper E.2012.11).
- McLeod, D., & Mileva, E. (2011). Real exchange rates and productivity growth (Discussion Paper No. 2011-04). New York, NY: Department of Economics, Fordham University.
- North, D. (1990). Institutions, institutional change and economic performance. New York: Cambridge University Press.
- Psacharopoulos, G. (1994). Returns to investment in education: A global update. World Development, 22(9), 1325–1343. doi:10.1016/0305-750X(94)90007-8
- Rodriguez, F., & Rodrik, D. (2001). Trade policy and economic growth: A skeptic’s guide to the cross-national evidence. In NBER macroeconomics annual 2000 (Vol 15, pp 261–338). Cambridge, MA: MIT Press.
- Rodrik, D. (2008). The real exchange rate and economic growth. Brookings Papers on Economic Activity, 2008(2), 365–412. doi:10.1353/eca.0.0020
- Rodrik, D. (2009). Growth after the crisis (Working Paper No. 65). Commission on Growth and Development. Washington, DC: The World Bank.
- Romer, D. (1996). Advanced macroeconomics (4th ed.). New York: McGraw-Hill.
- Tipoy, C. K., Breitenbach, M. C., & Zerihun, M. F. (2017a). Equilibrium exchange rates and misalignments: The case of homogenous emerging countries. SPOUDAI-Journal of Economics and Business, 66(4), 3–25.
- Tipoy, C. K., Breitenbach, M. C., & Zerihun, M. F. (2017b). Exchange rate misalignment and economic growth: Evidence from nonlinear panel cointegration and granger causality tests. Studies in Nonlinear Dynamics & Econometrics. doi:10.1515/snde-2016-0117.
- Williamson, J. (1994). Estimating equilibrium exchange rates. Washington, DC: Peterson Institute for International Economics.
Appendix
Figure 1. Misalignment index and industry value added for selected countries.
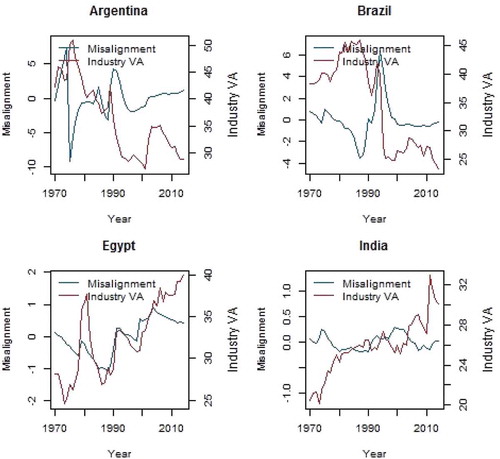
Figure 2. Distribution of undervaluation.