
 ?Mathematical formulae have been encoded as MathML and are displayed in this HTML version using MathJax in order to improve their display. Uncheck the box to turn MathJax off. This feature requires Javascript. Click on a formula to zoom.
Abstract
The contentious effect of foreign aid on real exchange rate in developing countries leading to Dutch disease necessitates further research since its impact can only be determined empirically. Using annual data gathered from the World Bank Development Index database with reference period of 1980 to 2016, we test the Dutch disease hypothesis by empirically examining the effect of foreign aid on real exchange rate in Ghana. Contrary to the findings of studies which establish non-existence of Dutch disease in Ghana, the empirical results of this study reveal otherwise, both in the short-run and long-run. To mitigate Dutch disease menace in Ghana, it is important that the country utilize its ideal productive capacity to cushion its aid-induced increased demand.
Public Interest Statement
Although foreign aid inflows to developing countries are intended to support the economic reforms and fiscal responsibility, concerns have been raised among policymakers and economists about the potential adverse effects these aid inflows may have, particularly, on the external competitiveness of the economy. The numerous debates over foreign aid are based on how it would affect important economic variables such as growth, investment, savings and real exchange rate. This study empirically examines the effect of foreign aid on real exchange rate in Ghana to test the Dutch disease hypothesis. The study concludes that there is existence of Dutch disease in Ghana.
Competing interest
The authors declare no competing interest.
1. Introduction
The ultimate argument that foreign aid contribute to economic growth in beneficiary countries has been the driver of aid flows for many years as formally established in the “two gap” model of Chenery and Strout (Citation1966). In the latter part of the twentieth century, the amount and scope of the aid transfers increased significantly such that aid from Organization for Economic Cooperation and Development (OECD) and Organization of Petroleum Exporting Countries (OPEC) was almost USD 60 billion at the end of the millennium official development assistance (World Bank, Citation2004). Lancaster (Citation2007, p. 101) defines foreign aid as “voluntary transfer of public resources from one country to another to better the human condition in the country receiving the aid.” foreign aid which is the transfer of funds from developed countries to developing countries is in the form of project aid, commodity aid (i.e. food aid), technical assistance and programmed aid (balance of payments support and budget support) (Cassen, Citation1994). In aid research, aid can be measured in two ways: (1) effective development assistance (EDA) and (2) official development assistance (ODA). Effective development assistance is a combination of aid in the form of direct grants and loans that are grants which are adjusted for inflation so as to reflect the real cost of providing the aid while official development assistance indicates aid in the form of direct grants and concessional loans whereby the component of the grant is beyond 25% (Daalgard & Henrik, Citation2001).
Promotion of economic development and well-being generally measured by economic growth and poverty reduction is the main aim of much of the aid inflows to developing countries like Ghana. With the help of the International Monetary Fund (IMF) and the World Bank since 1980, measures have been put in place to end the recession of the Ghanaian economy and to travel on the path of sustained economic growth and development. This has resulted in the remarkable assistance from donors in the form of grants, technical assistance and concessional loans (Loxley, Citation1998). In the latter part of 1980s and early part of 1990s, the Ghanaian economy benefitted largely from significant amount of aid as a result of reforms and structural adjustments through the Economic Recovery Program (ERP) of 1983 and the Structural Adjustment Program (SAP) of 1986 (Boakye, Citation2008). The total aid flows to Ghana increased three times from USD 150.7 million in 1985 to USD 450.8 million in 1995 (Boakye, 2008). Between 2000 and 2006, aid inflows rose to an annual average of more than 17% of GDP compared with 3% of GDP before the SAP. Table presents the Net ODA received by Ghana from 1990 to 2015. The Net ODA received increased from 1990 to 2012, reduced between 2013 and 2014 and increased again in 2015. The Net ODA received as a percentage of gross national income (GNI), gross capital formation and imports has been relatively low since 2007. Although the Net ODA received as percentage of government expense is relatively low, the figures presented show that it forms an important part of government expenditure.
Table 1. Net ODA Ghana received from 1990 to 2015
Although the huge aid inflows to Ghana and other developing countries are intended to support the economic reforms and fiscal responsibility, concerns have been raised among policymakers and economists about the potential adverse effects these huge aid inflows may have, particularly, on the external competitiveness of the economy. The numerous debates over aid are based on how it would affect important economic variables such as growth, investment, savings and real exchange rate (Berg, Hussain, Aiyar, Roache, & Mahone, Citation2005; Van Wijnbergen, Citation1984, Citation1985; Younger, Citation1992).
Based on the Dutch disease theory, increase in aid inflows leads to appreciation of real exchange rate as a result of increase demand for non-tradable goods and subsequently increase in prices of non-tradable goods as the money is spent domestically (Van Wijnbergen, Citation1984, Citation1985). The theory on Dutch disease is that aid inflow and spending lead to the insurgence of Dutch disease in an economy. Even at moderate levels, on non-traded commodities, it results in appreciation of the local currency in real terms, exports become less competitive on the global markets and consequently, import increase at the expense of export, hence, deteriorating the balance of trade. A decrease in export leads to reduction in aggregate demand as well as equilibrium income. In addition, real exchange rate appreciation causes import to become comparatively less costly, the country at this point stops local production, which leads to deindustrialization. The term “Dutch Disease” was derived from the adverse impact on Dutch manufacturing of the increase in income associated with the discovery of natural gas in the Netherlands in the 1960s, essentially through the appreciation of the Dutch real exchange rate (Van Wijnbergen, Citation1984, Citation1985)
However, the empirical results of the effect of aid on real exchange rate in sub-Saharan African countries have been inconclusive. Van Wijnbergen (Citation1985) argued that aid leads to appreciation of the exchange rate. This further leads to a decrease in the production of tradable goods and exports. White (Citation1992) also asserted that aid could cause appreciation of the real exchange rate, especially when the aid is expended on non-tradable goods. Edwards and van Wijnbergen (Citation1989) concluded that the effect of huge aid inflows is comparable to the increase in income from natural resources. This is due to the fact that they are both presented in cash foreign currencies and this put pressure on the real exchange rate. According to Berg et al. (Citation2005), if aid is spent on tradable goods (i.e. import of investment goods and those with limited offer), they may not cause overvaluation of the exchange rate. Adam and Bevan (Citation2004) revealed that the effects of Dutch disease is present in the short-run, beyond that the correlation between increased aid inflows, real exchange rate and welfare are not straightforward as simple models of aid suggest. Issa and Ouattara (Citation2008) find no evidence of the Dutch disease in the short-run or long-run. In a study of 65 developing countries with data over 40 years revealed the absence of aid and Dutch disease type of problems. In Ghana for example, Younger (Citation1992) revealed that huge aid inflows to Ghana have injured the economy rather than helping. Thus, the huge aid inflows have led to upsurge in macroeconomic management problems related to inflation, real exchange rate appreciation and tightened funds to the non-bank private sector. On the other hand, studies have found that instead of leading to real exchange rate appreciation, aid inflows have led to real exchange rate depreciation in Ghana (Arhenful, Citation2013; Sackey, Citation2001).
The contentious effect of aid on real exchange rate necessitates further research since the long-term impact of aid inflows on the real exchange rate can only be determined empirically. In addition, our study extends the data from 1980 to 2016 compared with other studies, which have used data just up to about 2012 for Ghana (Arhenful, Citation2013; Sackey, Citation2001; Younger, Citation1992). This helps us to find out what the current situation is as there has been various developments pertaining to aid. In this regard, the objective of this study is to test the aid and Dutch disease hypothesis by empirically examining the effect of aid on real exchange rate in Ghana.
It is important to estimate the effect of aid on real exchange rate since aid forms a major part of Ghana’s capital inflows and goes a long way to negatively or positively affect economic growth of the country. This study is also important for policy on aid flows into Ghana by providing plausible policy recommendations. Policy could be drawn from the findings of this study as to whether Ghana should continue to depend more on aid or otherwise. The findings of this study would add to existing literature on the relationship between aid and exchange rate in developing countries.
1.1. Trend of aid flows and exchange rate
Figure presents trend and pattern of exchange rate and aid. In recent times, aid flows into the Ghanaian economy have been in the form of all-purpose budget assistance, sector assistance (principally, education as well as health) and project support utilizing parallel systems. From the perspectives of Harrigan and Younger (Citation2000), before mid-1960s, aid was considered to be insignificant in Ghana. This is attributed to the fact that the government at that time doubted USA and Britain who were Ghana’s principal aid givers. This never helped the previously deprived status of affairs. Researchers such as Killick (1978), Brownbridge (Citation1994) and Quartey (Citation2005) posit that before the 1961 balance-of-payments crunch, small budgetary aid and foreign exchange were needed by the economy. This is because the country had congenital modicum debt, considerable foreign exchange reserves, as well as small public sector from their colonial masters. Although the economy had the interest to attract aid post-1961, censure of the two main western aid givers (USA and Britain) by Kwame Nkrumah (the then president of Ghana) rendered them less appealing origins of support. In due course, Nkrumah was able to secure aid from Eastern bloc, nonetheless, the association worsened in the early stage of the programme which had a severe impact on the disbursement (Killick, 1978).
Figure 1. Trend and Pattern of Exchange rate and Foreign Aid.
Source: Author’s own construction (2017)
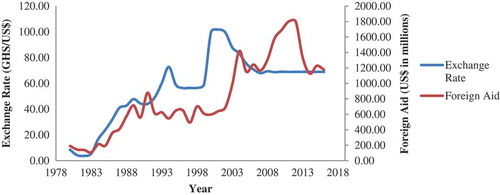
Before 1980s’ economic reforms, aid flow into the Ghanaian economy has been very volatile, small, and politicians used it to undertake their own businesses. In the late 1980s, aid flow in the economy increased appreciably. Ghana’s aid per capita rose above African average as well as other emerging economies in the globe (Quartey, Citation2005). Growth was increased by the aid flow; however, it is not clear if the rise in growth indicates causation. The increase in growth as a result of upsurge in aid flow happened in early stage of the Economic Reform Programme (Aryeetey & Cox, Citation1997). According to Younger (Citation1992), the conditions that accompanied the programme helped to prevent fungibility and aid-induced Dutch disease. Ghana experienced a new stage in its economic situation in the late 1980s and early 1990s. There was a high return on public investments, reintegration of infrastructure and functioning market compared with pre-ERP era (Harrigan & Younger, Citation2000). During the reform period, liberalization of the foreign exchange market was done which caused the succeeding aid flow to induce appreciation of the foreign exchange. This went a long way to boost export in the economy. Again, the government of Ghana imposed a restriction on private sector credit in its quest to counteract the monetary effects of the inflows (Younger, Citation1992). However, the target of the government was not achieved when the increase in aid flow resulted to the incident of Dutch disease. Aid inflows upsurged from US$ 578.96 million in 2001 to US$1,896.8 million in 2010. Nonetheless, during the late 2008 and early 2009, aid flow to Ghana decreased considerably due to the financial and global economic crisis. Aid flow increased from 2011 to 2014 and decreased again from 2015 to 2016.
Azid et al. (Citation2005) noted that exchange rate is the price of one currency in relation to another. The exchange rate (Ghana cedi against the US dollars) has been fluctuating over the years. Before the arrival of ERP, Ghana was running the fixed exchange rate policy with sporadic exchange rationing and devaluation. The flexible exchange rate policy was employed by the country in the beginning of 1986. This was done to quicken the modification of the exchange rate and to accomplish the objective of trade liberalization, allowing it partly to market forces (demand and supply) to regulate the cedi-dollar rates. This caused the awakening of the local currency, though the cedi suffered some level of instability. Over the years, the cedi, which has been changing on numerous occasions, has seen huge depreciation against principal foreign currencies (most especially the US dollar). This has led to inflation, worn income of the nation and weakened economic confidence. The fixed exchange rate regime of Ghana persisted between 1970 and 1985. The cedi was pegged to the American dollar and British pound. As soon as the floating exchange rate was implemented, the cedi depreciated by 95.6% in 1987, nonetheless, the depreciation rate of the cedi improved between 1988 and 1991. Depreciation which stood at 57.4% in 1993, declined to 2.3% in 1998, before attaining its highest value of 99.4% in 2000. Between 2001 and 2007, the rate of depreciation of the cedi slowed down, but the value of the cedi fell sharply between 2008 and 2009, partly due to the redenomination of the domestic currency (Institute of Statistical, Social and Economic Research (ISSER), Citation2014). Though the cedi is still depreciating against the major currency (American dollar), it has been stable from 2010 to 2016.
2. Literature review
2.1. The Dutch disease theory
Corden (Citation1984) and Magus and Sosa (Citation2010) note that the term Dutch disease was coined and used for the first time in 1977 by The Economist so as to demonstrate the problem the Dutch economy experienced in the 1960s. The discovery of a large natural gas field in the Dutch in the late 1950s was followed by exploitation and exportation in 1960s, which led to a substantial decline in the Dutch manufacturing sector. The reason was that production factors were shifted towards the gas industry, while the prices of non-tradable goods and services increased due to the Dutch diseaseFootnote1 effect. The term Dutch disease should not be confused with a more general term (natural resource curseFootnote2), which is defined as a paradoxical and puzzling phenomenon that countries with an abundance of oil and minerals or other natural resources tend to have slower economic growth and worse development outcomes than countries without (Sachs & Warner, Citation1995, Citation2001; Frankel, Citation2010). There are many different theoretically hypothesized and empirically tested reasons for the occurrence of resource curse which ranges from “the structuralist theses of the 1950s” to the current and relatively “more consensual institutional causes” (Torres, Afonso, & Soares, Citation2013). Specifically, the reasons include a decline in the competitiveness of other economic sectors (owing to appreciation of the real exchange rate as resource revenues come into an economy-the Dutch disease effect), volatility of revenues from the natural resource sector as a result of global commodity price swings, government mismanagement of resources and rent-seeking behaviours, civil war and poor institutions.
Hence, the Dutch disease is only one manifestation of the natural resource curse. Even though the Dutch disease is mostly associated with a natural resource abundance and dependence, it can potentially result from any large increase in foreign currency, including foreign aid, foreign direct investment, workers’ remittances or a significant increase in natural resource prices and sustainable debt (Corden, Citation1984; Sy and Tabarraei, Citation2010; Magus & Sosa, Citation2010). Ever since the term Dutch disease originated, there are ample theoriesFootnote3 which have been developed in an attempt to explain the relationship between a resource discovery or price boom or large inflow of foreign revenue and its effects on the economy.
2.2. The core Dutch disease model
The core model describing Dutch disease is credited to Corden and Neary (Citation1982) and Corden (Citation1984). They set out a basic model consisting of three sectors: two of the sectors produce goods that are traded at exogenously given world prices, whereas the third sector produces non‐traded good with flexible price that moves to equalize demand and supply on the domestic market. According to Corden and Neary (Citation1982), the two traded goods are “energy” and “manufactures”, whereas the non‐traded good is labelled services.Footnote4 There are some simplifying assumptions made in developing the basic model. It is assumed that all goods are used for final consumption only (not as an intermediate input into production), national output is equal to national expenditure at all times (ensuring overall trade balance), wages are perfectly flexible (so that full employment is ensured at all times), the models are purely real ones (ignoring any monetary considerations), where only relative prices are determined. Furthermore, the model considers different level of intersectoral factor mobility where labour is the mobile factor, whereas the sector-specific factors (capital) are not. Corden and Neary (Citation1982) distinguish between two types of effects of the resource boom which they consider as a crucial feature of the model. These effects are the resource movement effect and a spending effect.
2.2.1. The spending effect
Given that the booming sector brings in higher foreign exchange inflows and given that all the extra income will not be spent on imports, some part of the extra income is spent on the non-tradables providing that the income elasticity of demand for non-tradables is positive. Hence, the boom will create excess demand in the non-tradables and consequently increasing their prices relative to the prices of tradables leading to real exchange rate appreciation.
2.2.2. Resource movement effect
With a boom, the marginal productivity of labour rises in this sector so that at a constant wage, the demand for labour in this sector increases. This will push wages up and ultimately induce a movement of labour to the booming sector from the other two sectors. This effect has two parts. First, the movement of labour out of lagging sector into the booming sector reduces output in the former. This is termed as direct deindustrialization since it neither involves the market for non-tradable nor necessitates an appreciation of the real exchange rate. Second, there is a movement of labour out of the non-tradable sector into the booming sector at a constant real exchange rate. This creates excess demand for the non-tradable goods over and above that created by the spending effect resulting in further appreciation. It results in additional movement of labour, now, out of the lagging sector to non-tradable sector resulting in the indirect-deindustrialization. The bottom-line is that through these two effects the traditional export sector (manufacturing or agricultural) is crowded by the booming and non-tradable sectors. However, Corden (Citation1984) points out that “the Core model can be varied in numerous ways, so that none of the outcomes can be regarded as inevitable.”
2.3. Foreign aid and real exchange rate
2.3.1. Foreign aid and real exchange rate appreciation
The impact of aid flow on real exchange rate in empirical studies has been hobnobbed. Some studies have reported a negative influence and others a positive effect. White and Wignaraja (Citation1992) examined Dutch disease effect in Sri Lanka. The result of the study reveals that real exchange rate appreciation has a correlation with aid inflows. They assert that certain policies, for example substantial increase in public expenditure, may have been the result of real exchange rate depreciation and suggest that public expenditure must be allocated judiciously while measures are taken to remove barriers in the production of non-tradables.
Falck (Citation1997) examined the aid-stimulated appreciation of the real exchange rate in Tanzania using data from 1964 to 1993. The author used variables such as rate of change of nominal exchange rate, one period lagged real exchange rate, aid, terms of trade, international investment and growth of domestic credit access as a proxy for macroeconomic policy. In total, 12 distinctive indexes of real exchange rate were computed. Three-stage selection approach was applied to each of the index. The ordinary least squares estimation technique was subsequently used for estimation. The result reveals that real exchange rate is appreciated as a result of inflows of aid into the country.
Elbadawi (Citation1999) using a panel data comprising of 62 emerging economies of which 28 were Africans established that unsustainable inflows of aid in numerous non-African and African economies have brought about considerable partial overvaluation of the real exchange rate. Besides, African countries that depend much on aid mostly undergo real exchange rate overvaluation.
Opoku-Afari, Morrissey, and Lloyd (Citation2004) investigated real exchange rate response to capital inflows for Ghana using a dynamic analysis. The study employed annual data from 1966 to 2000. In their study, they breakdown capital inflows into official inflows, permanent inflows and non-permanent inflows and used the Vector Autoregressive (VAR) techniques to model the long-run equilibrium of real exchange rate in Ghana. They also employed a multivariate orthogonal decomposition method to estimate any misalignments. As predicted by the Dutch Disease theory, results indicate that capital inflows tend to appreciate the real exchange rate in the long-run.
Ouattara and Strobl (Citation2008) explored the relationship that exists among foreign aid inflows and real exchange rate from 1980 to 2000 in selected CFA economies through the application of panel estimation approach. The result shows that aid inflows leads to appreciation of the real exchange rate in those countries.
Sanusi (Citation2011) in estimating the long-run and short-run relationship between aid flows and exchange rate through the application of the exchange rate behavioural equilibrium approach revealed that aid had a positive and statistically significant influence not in the short-run but in the long-run. It is argued that it makes more sense if high inflow of aid is saved, which is then channelled to raise foreign reserves as Ghana has been experiencing. Nonetheless, in a situation where all aid is expended in the long-run, real exchange rate appreciation occurs as predicted by the theory. Hence, policy advice that can be given based on the finding is that Ghana government must try as much as possible to direct aid to boost the productive size of the economy so that the adverse impact of appreciation of the exchange rate on the growth of the economy can be nullified by supply response. Applying the ordinary least squares estimation technique, the study reveals that real exchange rate is positively impacted by the inflows of aid, even though the aid flows to Ghana are on the high side.
Uneze (Citation2011) re-explores the association that exists among real exchange rate and aid in selected WAEMU economies. The author employed the contemporary econometric models made for non-stationary dynamic panels, as well as a model that inflicts a flimsier homogeneity hypothesis on the slope parameters. His study reveals that inflow of aid resulted in real exchange rate appreciation across the years 1975 to 2005. Variables such as government consumption on non-tradable commodities, productivity of labour (a substitute for Balassa-Samuelson effect) and terms of trade development also had a negative impact on real exchange rate. This means that those variables led to exchange rate appreciation. To circumvent weakening of competitiveness through real exchange rate appreciation, the paper suggests that WAEMU economies should import capital commodities with the foreign exchange they gain from influx of aid, which will result to both expansion in export and speedier economic growth.
Cakrani and Koprencka (Citation2012) undertook a study to assess the potential effect of aid flow on real exchange rate during the period of 1993–2011 in Albania using co-integration technique. It was found that upsurge in the flow of aid is connected to the overvaluation of the exchange rate and the Dutch disease hypothesis.
In Tunisia as well as Morocco, Addison and Baliamoune-Lutz (Citation2017) undertook a study to test the Dutch disease hypothesis. The researchers employed secondary data from 1980 to 2009 and used the VAR estimation technique to analyse the data. Their result confirmed the Dutch disease hypothesis in Morocco, but aid had no impact on the real exchange rate in Tunisia. Their finding further proves that in assessing the real impact of aid and other inflows in an economy, the principal role of infrastructure, supply-side step-ups as well as the macroeconomic structure can never be overemphasized.
2.3.2. Foreign aid and real exchange rate depreciation
Nkusu (Citation2004) posits that less-income economies can prevent Dutch disease when they are able to make use of their productive capacity to meet the aid-induced raised demand. Studies such as Sackey (Citation2001), Nyoni (Citation1998) and Ogun (Citation1998) did not find any proof of “Dutch disease” in Ghana, Tanzania and Nigeria, respectively. Certainly, these researchers established a positive relationship between real exchange rate and inflows of aid.
Ogun (Citation1998) studied the correlation among real exchange rate and aid in Nigeria using data from 1960 to 1990 and employed co-integration technique and an error-correction model. The study concluded that inflows of aid into the economy results in real exchange rate depreciation. Thus, an indication of no Dutch disease.
Similar result was obtained by Nyoni (Citation1998) in Tanzania when he employed secondary data from 1967 to 1993 to assess the effect aid inflow has on real exchange rate. Using co-integration technique and an error-correction model, the study revealed that real exchange rate appreciates when aid increases. The paper further showed that within the reference years of the study, real exports appreciably increased. Contrary to the Dutch disease theory, his study reported from 1985 to 1993 (as depicted in a graph) that an increase in aid inflow resulted in a rise in exchange rate depreciation.
Sackey (Citation2001) using the error-correction approach to co-integration investigated the effect aid has on real exchange rate between 1962 and 1996 in Ghana. His study shows that aid inflows cause real exchange rate to depreciate in the economy instead of appreciating.
Kang, Prati, and Rebucci (Citation2007) noted that exports and economic growth are adversely impacted by aid as a result of aid causing overvaluation of the real exchange rate. This finding was obtained from half of the 38 economies sampled for the study. Conversely, exports and growth were boosted by aid inflows in the remaining half of the economies. This suggests that some countries suffer from the Dutch disease phenomenon, whereas others are resistant to it.
Li and Rowe (Citation2007) employ a reduced-form equilibrium of real exchange rate approach to explain the relationship between aid inflows and the real exchange rate in Tanzania. The result of the study reveals that trade movements, the government’s trade liberalization efforts and aid inflows affect the real exchange rate in the long-run. The study concludes that increases in aid inflows are associated with depreciation in the real exchange rate.
In Syria, Issa and Ouattara (Citation2008) tested the “Dutch disease” hypothesis by employing the autoregressive-distributed lag procedure to co-integration proposed by Pesaran, Shin, and Smith (Citation2001) and Pesaran et al. (Citation1996). The study used time series data with reference period from 1965 to 1997. The result of the paper went contrary to the “Dutch disease” hypothesis in both the short-run and the long-run. This means that aid inflows do not lead to real exchange rate appreciation but depreciation.
Selaya and Thiele (Citation2010) also examining Dutch disease over 40 years in 65 developing economies came to a conclusion that aid causes real exchange rate depreciation. This debunks the Dutch disease phenomenon. One would possibly anticipate that in less-developed island economies, particularly Pacific states which depend much on aid to be vulnerable to Dutch disease impacts.
Fielding (Citation2010) investigates aid and Dutch Disease in the South Pacific and in Other Small Island States. The findings of the study show that out of 10 Pacific states surveyed, three were found to be under the effect of aid-induced real exchange rate appreciation. The study concluded that the negative impacts of aid can be mitigated by effective governance or increase in openness of trade.
Arhenful (Citation2013) undertakes a research to examine whether the Dutch disease has caught up with the Ghanaian economy and its trade position harmfully affected. He employed the ordinary least squares estimation procedure for analysis. Annual time series data from 1970 to 2002 was used. The study shows that inflows to Ghana are quite high and real exchange rate in the economy is not adversely affected by the aid. This means that increase in aid inflow leads to real exchange rate depreciation.
3. Methodology
3.1. Theoretical foundation
The theory underpinning the current study was adopted from Sy and Tabarraei (Citation2010). It was developed based on two economies, one labelled as home country/economy and the other foreign country/economy. In each country, firms are engaged in the production of either tradable or non-tradable commodities.
Home country: Let us assume the home country is a developing economy where there is relatively low technical progress. In this economy, non-tradable commodities are produced from capital (oil revenues) and labour, whereas tradable commodities (i.e. in the agricultural sector) are produced by solely labour.
The production function in the non-tradable sector of the home country is Cobb-Douglas.
Where the measure of the non-tradable sector productivity is ,
is labour in the non-tradable sector and
is the capital expended in the production process,
is the output in the non-tradable sector. Therefore, the profit of the representative active firm in this sector is;
can be explained as the price of one unit of capital or the international oil price,
is the price of the non-tradable commodity,
is the government subsidy to the domestic firms and
is the wage rate. The first-order conditions are:
In the tradable sector, the production function is a linear function of the labour force:
The price of tradables is normalized to one. Thus, the profit is
The first-order condition is:
Wages are equal in the tradable sector and non-tradable sector; hence, the right hand side of Equations (3) and (5) are equal, therefore combining this result with Equation (7) yields:
Foreign country: Let us assume that the foreign country is an advanced country where tradable goods are produced with capital (imported oil) as well as labour. In that economy, lone labour is used to produce non-tradable services (goods). The tradable sector in the foreign country uses the imported resources (such as labour and oil) from the home country.
Technology of production is Cobb-Douglas. The profit can be written as:
With
The asterisk (*) signifies the value in the foreign country and is the nominal exchange rate. The first-order conditions are:
Under the assumption that the law of one price holds for the tradables, we have as we normalized the price of tradables in the home country. Equation (12), therefore, can be simplified to:
The non-tradable sector uses only labour as a production factor:
The first-order condition imposes . As in the home country, wages should be equal in the two sectors. Combining these conditions yields:
If we suppose that the price index is a geometric average of the prices of the tradables and non-tradables, then the real exchange rate can be written as where
By replacing Equations (8) and (16) in Equation (17), we get
is the price of oil, or the price of a unit of capital. However, since we normalized the price of tradables to 1, it is the terms of trade as well. Log-linearization of the above equation yields:
The equation expresses that when the terms of trade, i.e. the price of capital, changes positively, real exchange rate is also influenced positively (since . Moreover, the home economy will face real exchange rate appreciation if its productivity growth advantage in tradable commodities is bigger than its productivity growth advantage in the non-tradables (Sy & Tabarraei, Citation2010). This characterizes the Balassa–Samuelson effect. The terms of trade and the Balassa–Samuelson effect (using real GDP as a proxy for the Balassa-Samuelson effect), therefore, are the main driving forces of exchange rate movements in the long-run. No matter how simple a model for testing existence of Dutch disease is, it is successful if it is able to replicates studies such as Balassa (Citation1964), Samuelson (Citation1964), Dornbusch (Citation1980) and Edwards and Van Wijnbergen (Citation1989), which posit that real basics are the principal propelling forces of the real exchange rate in developing economies. In the empirics, the current study added capital flow variable (i.e. aid) to check if the theoretical conclusion holds.
3.2. Empirical model
The main purpose of this study was to examine the effect of aid on real exchange rate in Ghana. Other variables considered in the model are terms of trade, government consumption, gross domestic product (GDP), as well as money supply (M2). The model specification for the econometric analysis as used by Edwards (Citation1998) and Issa and Ouattara (Citation2008) is as follows;
Where, is the stochastic error term, and
subscript is time, ln is natural log operator.
represents real exchange rate,
represents foreign aid,
represents government expenditure/consumption,
represents per capita GDP,
represents terms of trade and
represents money supply.
3.3. Description of variables and data source
3.3.1. Data source
The secondary data used for this study were obtained from the World Bank Development Index (WDI) database with reference period of 1980–2016 (World Bank, Citation2017). This sample selection criterion is very crucial because the study takes 1980 as the initial period at which Ghana started experiencing a decline in the GDP growth (negative from 1981–1983) as a result of economic recession that occurred in 1981. Since then, it is worthy to note that the economy has recovered but suffered series of fluctuations which does not match the rate of development.
3.3.2. Description and measurement of variables
Real exchange rate was measured as the ratio of exchange rate to purchasing power parity conversion factors. It is the dependent variable for the estimation. It was sourced from the World Development Indicator (WDI) 2016.
Foreign aid was measured as the net ODA to Ghana from 1980 to 2016. It is hypothesised to have a negative impact on real exchange rate. This is due to the fact that aid can cause appreciation of real exchange rate by altering the constituent of non-tradable and tradable commodities demand in accordance with “Dutch disease” concept for aid (Opoku-Afari et al., Citation2004). According to Younger (Citation1992), increase in aid inflows results in macroeconomic management problems associated with high inflation and real exchange rate appreciation.
Economic Growth (GDP) was measured as per capita GDP (constant 2005 US$). The study hypothesized an adverse correlation among economic growth and real exchange rate appreciation. According to the hypothesis of Balassa–Samulson, as an economy begins to develop, productivity improves less in the non-tradable commodities sector than the tradable sector. This indicates that increase in the price of the latter is comparably smaller than that in the former, this leads to real exchange rate appreciation (Issa & Ouattara, Citation2008).
Government expenditure/consumption was measured as the total government expenditure in Ghana from 1980 to 2016. The impact of this variable is dependent on the constituent of consumption by government. If consumption comprises of less tradable commodity, real exchange rate will appreciate (Issa & Ouattara, Citation2008). Uneze (Citation2011) also states that government spending of non-tradable goods leads to real exchange rate appreciation, whereas less of non-tradable goods leads to real exchange rate depreciation. Zakaria and Ghauri (Citation2011) and Ravn, Schmitt-Grohe, and Uribe (Citation2012) state that government spending positively affects real exchange rate, which implies that government consumption leads to depreciation of the real exchange rate. Bouakez and Eyquem (Citation2012) also assert that increase in government consumption in the long-run leads to decrease interest rate, causing depreciation of real exchange rate. This study, therefore, hypothesizes government expenditure/consumption to either have a positive or negative effect on real exchange rate.
Terms of Trade was computed as the ratio of export unit value to import unit value (exports/imports). The impact of this variable on real exchange rate is dependent on two effects, income and substitution effect. Substitution effect will result in real exchange rate appreciation, whereas income effect will cause depreciation. This is because income effect leads to decline of terms of trade in an economy (Issa & Ouattara, Citation2008). This study hypothesizes terms of trade to have either a positive or negative effect on real exchange rate.
Money supply denotes the growth of money. It denotes expansionary monetary policy in an economy. General price level ( upsurges when money supply increases resulting in real exchange rate appreciation (Ali & Isse, Citation2005). This study hypothesizes money supply to have a negative effect on real exchange rate.
3.4. Estimation technique
The autoregressive distributed lag (ARDL) approach to co-integration was used for this study. There are several other approaches that can be used in place of ARDL when it comes to time series analysis. The notable ones are Engle–Granger and Johansen models. The difference between these models and ARDL approach is that the Engle–Granger and Johansen techniques are used when the variables are integrated of the same order. This is a serious limitation to the two approaches, which is not required when applying the ARDL approach. The ARDL approach allows the inclusion of other models with dissimilar variables that take a diverse optimal number of lags.
3.4.1. Stationarity and unit root test
Even though the ARDL approach to co-integration demands no pre-testing of the variables for the presence of unit root, the study undertook the test to make sure the variables are not integrated of order greater than one. The current study employed the Augmented Dickey Fuller (ADF) and Dickey Fuller-Generalized Least Squares (DF-GLS) unit root tests. The ADF and DF-GLS unit root tests use a regression of the first differences of the series against the series lagged once, and lagged difference terms. It may include a constant term
and trend term
as follows;
Where is a first-difference operator, m is the optimal lagged length,
is the time trend and
is the stationary random error. To settle on whether a variable is a trend stationary or difference stationary, the unit root test must be explored. A time series that contains no unit roots is stationary with a mean
equal to 0 and variance
equal to 1. If we reject our null hypothesis that the series possesses a unit root, then the series is trend stationary. If there is insufficient evidence not to reject the null hypothesis then the series is difference stationary.
The use of unit root tests on differenced stationary series controls the shape in which the data will be used in regression. You may find that the first differences of the series are stationary, thus the series is said to be integrated of order one and no further unit root testing is required. Once the stationary properties of all the variables using ADF and DF-GLS tests are determined, then OLS method of regression is used to estimate the long-run relationship of the variables. The test for a unit root has the hypothesis that,
. If the coefficient is statistically different from 0, the hypothesis that
contains a unit root is rejected. The equations below present the elaboration of the ADF and DF-GLS unit root tests.
Where
Where the null hypothesis is (the unit root), k denotes the number of lags and n is the number of observations.
3.4.2. ARDL bound test
The first step of ARDL estimation is to undertake the bound test (testing whether long-run relationship exists among the dependent variable and the independent variables). The estimated F-statistic obtained from the co-integration regression (bound test) is then compared with the critical values developed by Pesaran. If the estimated F-statistic is less than the lower bound value of the Pesaran table, the hypothesis of co-integration among variables is rejected. If it is greater than the lower bound value of the Pesaran table but less than the upper bound value, the test is inconclusive, in which case a different method must be deployed. It is only when the F-statistic obtained is greater than the upper bound value that the hypothesis of co-integration among the variables can be accepted. The ARDL is made up of two steps, first is to examine the existence of long-run co-integration as presented in Equation (20) and the short-run co-integration (unrestricted error correction model (UECM)) depicted in Equation (24).
Where delta () is the difference operator and represents short-run dynamics. The coefficients attached along with one period lagged variables measure long-run relationships. The null of no long-run co-integration (
is disputed in opposition to the alternative hypothesis, which states the presence of a long-term association (
. If the null proposition of zero co-integration is rejected, the existence of long-run co-integration association is proven.
The short-run error correction model is used to identify short-term dynamics and to confirm the robustness of the estimated parameter of long-term with reverence to Equation 16. It is specified as depicted in Equation 25.
3.4.3. Diagnostic test
The reliability of the goodness-of-fit model is determined by conducting the diagnostic and stability tests of the model. The test is carried out to estimate the robustness of the results from the ARDL model. The diagnostic test takes care of heteroscedasticity, serial correlation, normality, the functional form, cumulative sum (CUSUM) and cumulative sum of squares (CUSUMQ) that are linked to the model.
4. Results and discussions
4.1. Estimation technique test results
4.1.1. Stationarity and unit root test
Although the ARDL approach does not require any stationarity or unit root test, we used the ADF and DF-GLS unit root tests to find out if the variables are not integrated at order greater than one. The results revealed that in both tests all the variables were integrated at order either zero or one. In the DF-GLS test, government expenditure, per capita GDP and terms of trade were found to be stationary at level (I(0)), whereas net aid, money supply as well as real exchange rate were stationary after first difference (I(1)). The same result was obtained from the ADF test; notwithstanding, government expenditure/consumption became stationary after first difference (I(1)) (Table ).
4.1.2. Lag length selection
In undertaking ARDL estimation, all variables are lagged in the course of the simulation. This makes the estimated parameter to be stationary, consistent as well as reliable. This means that the magnitude and the direction of the parameters reflect the true effect of them on the dependent variable from which policy suggestions are rendered. One optimal lag length was chosen by the simulation out of the four maximum lag length selected by the Akaike information criterion (AIC). From economic literature, the highest number of lags has to be used or critical decisions have to be made using the number of observation and variables (Carrasco Gutierrez, Castro Souza & Teixeira de Carvalho Guillén, Citation2009). The AIC was selected for the analysis because it had the least value. The result of the lag selection criteria is presented in Table .
Table 2. Stationarity and Unit Root
Table 3. Lag order selection
4.1.3. Bounds co-integration test
The co-integration (bound) test was carried out to establish whether there is a long-run relationship between the dependent and the explanatory variables. The null hypothesis of no long-run relationship or no co-integration among the variables was tested using the Wald Bound Test (Pesaran et al., Citation2001). Bound test analysis was done with a maximum lag of 4, excluding a trend and intercept. The results are shown in Table . The test produced an estimated F-statistic of 10.981. This F-statistic is then compared with the lower and upper bound values of the Pesaran table of critical values. Per the criteria, if the F-statistic is less than the lower bound value, the null hypothesis of no co-integration among variables is accepted. If the F-statistic estimated is greater than the lower bound value but less than the upper bound value, the test is deemed inconclusive, in which case a different approach must be deployed. However, if the F-statistic estimated is greater than the upper bound value, the null hypothesis of no co-integration is rejected. In this study, the F-statistic of 10.981 is higher than the upper bound critical value of 5.664 at the 1% level of significance obtained from the Pesaran (2008) table. Therefore, the null hypothesis of no co-integration was rejected. Since, co-integration among the variables was established; the study proceeded to undertake the ARDL analysis.
Table 4. Bounds Co-integration Test
4.1.4. Diagnostic tests
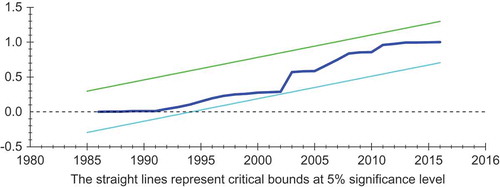
The bottom of Table presents the diagnostic test for serial correlation, functional form, normality and heteroscedasticity. These tests were carried out to ascertain the validity of the parameters estimated. Figures and also present the cummulative sum (CUSUM) and cummulative sum of squares (CUSUMQ) test which was carried out to ascertain the stability of the estimated parameters.
Table 5. The ARDL Model
Figure 2. CUSUM Test.
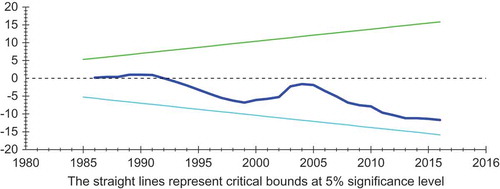
Figure 3. CUSUMSQ Test.
4.2. Serial correlation
The serial correlation assumption was tested through the application of the Lagrange Multiplier estimation. The null hypothesis states that there is no serial correlation, whereas the alternative hypothesis states otherwise. The decision rule is that if the probability value is not statistically significant at any significant levels (1%, 5% and 10%) do not reject the null hypothesis, otherwise reject. Since the empirical model produced non-significant probability value of 0.322, the study rejected the null hypothesis and concluded that there is no serial correlation among the variables as reported in Table .
4.3. Functional form
To find out whether there is the presence of omitted variable in the model, Ramsey RESET specification error test was executed. The decision rule is that if the probability value is not significant, do not reject the null hypothesis, otherwise reject. Since the empirical model produced non-significant probability value of 0.215, the null hypothesis was not rejected. This implies that there was no omitted variable in the model as presented in Table .
4.4. Heteroscedasticity
The Lagrange Multiplier test for heteroscedasticity was employed by the study to test for the presence of heteroscedasticity in the model. The empirical results indicate that there is no heteroscedasticity within the model since the model had probability value of 0.073, which is greater than 5% significance level. The results can be found in Table .
4.5. Normality
The normality assumption was also tested through the application of skewness and kurtosis. The normality assumption was not violated in the empirical model. This is due to the fact that the probability of value of 0.221 was not statistically significant at any significance level (i.e. neither 1% nor 5% nor 10%). The result is presented in Table .
4.6. Cumulative sum and cumulative sum of squares test
CUSUM of the recursive residuals and the CUSUMSQ of the recursive residual tests were employed by the study to assess the stability of the estimated parameters. Figures and depict plots of these tests, correspondingly. Figures and show that the CUSUM and CUSUMSQ test statistics could not go beyond the critical limits at the 5% significance level. As a result, the study concludes that the estimated models seemed to be stable.
4.7. Empirical results of the ARDL approach
4.7.1. Long-run estimation results
Table presents the results on the long-run estimation. Out of the variables estimated, aid flow and money supply were statistically significant. Aid was statistically significant at 5% (P < 0.05) significance level. It had a negative influence on real exchange rate. The result means that a percentage-point increase in aid flow in the economy leads to about 0.376 percentage-point decrease in the real exchange rate all things being equal. The result intuitively indicates that aid flow results in the appreciation of the local currency (Ghana Cedi). The result implies that aid flow causes real exchange rate appreciation as well as Dutch disease. This implies that aid causes the price of non-tradable goods to rise relative to tradable goods. Various studies done in Africa have revealed that aid cause appreciation of real exchange rate. The result of this study is in-line with the findings of Opoku-Afari et al. (Citation2004), Ouattara and Strobl (Citation2008), Uneze (Citation2011), and Addison and Baliamoune-Lutz (Citation2017) but contradicts the findings of Nyoni (Citation1998), Sackey (Citation2001), Issa and Ouattara (Citation2008) and Arhenful (Citation2013). According to Nkusu (Citation2004), low-income countries that can utilize their indolent productive capacity to cushion their aid-induced increased demand need not experience the Dutch disease. This means that if Ghana is able to utilize its ideal productive capacity to cushion the increase demand for aid, Dutch disease would no longer be experienced.
Table 6. Long-Run Estimates of the Real Exchange Rate
Money supply had a negative impact on real exchange rate. Money supply was statistically significant at 1% (P < 0.01) significance level. The result suggests that a percentage-point increase in money supply leads to about 3.0 percentage-point decrease in real exchange rate, ceteris paribus. This means that Ghana is engaging in expansionary monetary policy which results to the appreciation of the real exchange rate. The result is consistent with the findings of Ali and Isse (Citation2005), which state that there is an inverse long-run relationship between real exchange rate and money supply. Arhenful (Citation2013) revealed otherwise stating that money supply leads to depreciation of the cedi as a result of increased imports due to increased money supply.
4.7.2. Short-run estimation results
Table presents the results on the short-run estimation. In the short-run model, the error-correction term (ECM) which is the “speed of adjustment” was found to be -0.14 and statistically significant at 5% (P < 0.05). The parameter (−0.14) signifies that 14% of divergence from the equilibrium level of real exchange rate are adjusted annually. R-squared was found to be 0.56, which implies that about 56% of the variation in the real exchange rate is jointly explained by the independent variables.
Table 7. Short-Run (Error-Correction Model) Estimates of the Real Exchange Rate
From the results, foreign aid, terms of trade and economic growth were found to be statistically significant. Aid had a negative correlation with real exchange rate and was statistically significant at 10% (P < 0.10) significance level. Terms of trade had a positive correlation with real exchange rate and was statistically significant at 5% (P < 0.05) significance level. Economic growth had a positive correlation with real exchange rate and was statistically significant at 10% (P < 0.10) significance level.
The empirical result indicates that a percentage-point increase in aid will lead to about a 0.05 percentage-point decrease in the real exchange rate (thus, cause appreciation). This can be interpreted as an increase in aid results in Dutch disease. The empirical result corroborates with the findings of Balassa (Citation1973), Opoku-Afari et al. (Citation2004), Ouattara and Strobl (Citation2008), Uneze (Citation2011), and Addison and Baliamoune-Lutz (Citation2017), which note that increase in aid flow in an economy leads to real exchange rate appreciation. This implies that aid cause the price of non-tradable goods to rise relative to tradable goods. According to Nkusu (Citation2004), low-income countries that can utilize their indolent productive capacity to cushion their aid-induced increased demand need not experience the Dutch disease. This implies that Ghana is not using its indolent productive capacity to cushion its aid-induced demand.
The result shows that a percentage-point increase in terms of trade will lead to approximately 0.8 percentage-point increase in real exchange rate. This can be explained that increase in export over import in Ghana leads to depreciation of the local currency (Ghana Cedi). Intuitively, it implies that income effect supersedes substitution effect in the economy (Issa & Ouattara, Citation2008).
The result on economic growth implies that a percentage-point increase in GDP will result in 0.024 percentage-point increase in real exchange rate. The overall effect is that economic growth leads to depreciation of the local currency against foreign currency, hence, economic growth does not lead to Dutch disease. Studies have reported similar findings. Razin and Collins (Citation1997) revealed in their study on exchange rate misalignment and growth that rapid economic growth is related to moderate to high but not very high under-valuations of exchange rate. Uddin, Mohammad, and Quaosar (Citation2014) in their study on the relationship between exchange rate and economic growth in Bangladesh revealed a positive correlation between economic growth and exchange rate.
5. Conclusions and recommendations
The study examined the short-run and long-run relationship between aid inflows and real exchange rate in Ghana. This was to empirically test the Dutch disease hypothesis and find out if aid has led to Dutch disease in Ghana. The study used secondary data gathered from the World Bank Development Index (WDI) data with reference period of 1980 to 2016. The explanatory variables used for the analysis were aid, government consumption, money supply, economic growth and terms of trade. ARDL approach to co-integration was used for the analysis. In the first stage, the stationarity and unit root test was done to find out if the variables are not integrated at order greater than one. The results revealed that in both tests all the variables were integrated at order either zero or one. Next was the lag length selection. One optimal lag length was chosen by the simulation out of the four maximum lag length selected by the AIC. The co-integration (bound) test was also carried out to establish whether there is a long-run relationship between the dependent and the explanatory variables. The result revealed that co-integration existed among the variables, therefore, the study proceeded to undertake the ARDL analysis.
In the long-run, aid flow and money supply were statistically significant. Aid flow had a negative influence on real exchange rate. The result intuitively indicates that aid flow results in the appreciation of the local currency (Ghana Cedi). This implies that aid flow cause real exchange rate appreciation as well as Dutch disease. Money supply had a negative impact on real exchange rate. The result suggests that Ghana is engaging in expansionary monetary policy which results in the appreciation of the real exchange rate. In the short-run, aid, terms of trade and economic growth were found to be statistically significant. Aid had a negative correlation with real exchange rate, terms of trade had a positive correlation with real exchange rate and economic growth had a positive correlation with real exchange rate. The empirical result on aid implies that there is existence of Dutch disease in Ghana in the short-run. The results on terms of trade can be concluded that income effect supersedes substitution effect in the economy. The overall effect of economic growth on real exchange rate is that economic growth leads to depreciation of the local currency against foreign currency, hence, economic growth does not lead to Dutch disease. The study recommends that the government should put in place policies to ensure that Ghana utilize its ideal productive capacity to cushion their aid-induced increased demand in order not to experience the Dutch disease.
6. Limitation of the study
Data for certain variables which could have been used as control variables were not easily accessible. Therefore, those variables were not included in the analysis. Although the results may be affected in this case, the robust technique used in the study reduces this effect.
7. Recommendation for further studies
We suggest that new data set and different models could be used for further studies on this research area.
Additional information
Funding
Notes on contributors
Derick Taylor Adu
Derick Taylor Adu holds a Master of Philosophy degree in Agricultural Economics from University of Ghana, Legon. His research and teaching interests include Applied Econometrics, Macroeconomics, Microeconomics, Managerial Economics, Education Economics, Environmental Economics and Climate Change. He has published in international peer-reviewed journals including Cogent Economics and Finance, Cogent Food and Agriculture, SpringerPlus, Kasetsart Journal of Social Sciences, and International Journal of Education Economics and Development.
Elisha Kwaku Denkyirah
Elisha Kwaku Denkyirah holds a Master of Philosophy degree in Agribusiness from University of Ghana, Legon. His research and teaching interests encompasses Agribusiness Management, Development Studies, Education Economics, Agricultural Marketing and Trade, Project Management, Climate Change and Gender Studies. He has published in international peer-reviewed journals including Cogent Economics and Finance, Cogent Food and Agriculture, SpringerPlus, Kasetsart Journal of Social Sciences, International Journal of Education Economics and Development and International Journal of Food and Agricultural Economics.
Notes
1. Dutch disease is defined as “the effects of discoveries or price increases of natural resources that result in real exchange rate appreciation, factor reallocation, and de-industrialization” (Magus and Sosa Citation2010).
2. There are numerous studies and survey papers on the subject matter. For instance, see Torres et al. (Citation2013) and Frankel (Citation2010) for surveys.
3. Some of the theories are tailored to fit specific conditions such as the oil price increase, large foreign aid inflow. Refer to Mugad and Sosa (Citation2010) for comprehensive survey.
4. However, two of the sectors that produce the traded goods can be classified as resource/booming sector (which extracts oil or natural gas, or which mines gold or copper or diamonds) and the lagging sector which usually refers to manufacturing though can also refer to agriculture sector.
References
- Adam, C. S., & Bevan, D. B. (2004). ‘Aid public expenditure and Dutch disease’. Oxford: Centre for the Study of African Economies, Oxford University. CSAE/WPS/2003-02.
- Addison, T., & Baliamoune-Lutz, M. (2017). Aid, the real exchange rate and why policy matters: The cases of Morocco and Tunisia. Journal of Development Studies, 53(7), 1104 1121. doi:10.1080/00220388.2017.1303673
- Ali, A. M, & Isse, H. S. (2005). An empirical analysis of the effect of aid on growth. International Advances in Economic Research, 11(1), 1-11.
- Arhenful, P. (2013). The effect of foreign aid on real exchange rate in Ghana. Advances in Management and Applied Economics, 3(5), 151–169.
- Aryeetey, E., & Cox, A. (1997). Aid effectiveness in Ghana. In J. Carlson, G. Somolekae, & N. van de Walle (Eds.), Foreign aid in Africa: Learning from country experiences. Uppsala: Nordic Africa Institute.
- Azid, T, Jamil, M, Kousar, A, & Kemal, M. A. (2005). Impact of exchange rate volatility on growth and economic performance: A case study of Pakistan, 1973-2003 [with comments]. The Pakistan Development Review, 44(4), 749-775.
- Balassa, B. (1964). The purchasing power parity doctrine: A reappraisal. Journal of Political Economy, 72(6), 584-596.
- Balassa, B. (1973). Just how misleading are official exchange rate conversions: A comment. Economic Journal, 83, 1258–1267. doi:10.2307/2230853
- Berg, A., Hussain, M., Aiyar, S., Roache, S., & Mahone, A. (2005). The Macroeconomics of managing increased aid inflows: Experiences of low-income Countries and policy implications. Washington: IMF.
- Boakye, P. F. (2008). Foreign aid and economic growth in Ghana (1970-2005) (Doctoral dissertation).
- Bouakez, H., & Eyquem, A. (2012). Government spending, monetary policy, and the real exchange rate. Cahier de recherche/Working Paper 12-12.
- Brownbridge, M. (1994). ‘Private Investment and Structural Adjustment in Developing Countries’. PhD thesis, Manchester: IDPM, University of Manchester. doi: 10.3168/jds.S0022-0302(94)77044-2
- Cakrani, E., & Koprencka, L. (2012). Foreign aid flow and real exchange rate in Albania. Advanced Research in Scientific Areas, 3(7), 266–268.
- Carrasco Gutierrez, C. E, Castro Souza, R., & Teixeira de Carvalho Guillén, O. (2009). Selection of optimal lag length in cointegrated VAR models with weak form of common cyclical features. Brazilian Review of Econometrics, 29(1), 59-78.
- Cassen, R. (1994). Does aid work (2nd ed.). Oxford: Carendon Press.
- Chenery, H., & Strout, M. (1966). Foreign assistance and economic development. The American Economic Review, 66, 679–733.
- Corden, W. M. (1984). Booming sector and dutch disease economics: Survey and consolidation. Oxford Economic Papers, 36(3), 359–380. doi:10.1093/oxfordjournals.oep.a041643
- Corden, W. M., & Neary, J. P. (1982). Booming sector and de-industrialization in a small open economy. Economic Journal, 825–848. doi:10.2307/2232670
- Daalgard, C. J., & Henrik, H. (2001). On aid, growth and good policies. Journal of Development Studies, 37(6), 17–41. doi:10.1080/713601081
- Dornbusch, R. (1980). Open-Economy. Macroeconomics, New York: Basic Books.
- Edwards, S. (1998). Openness, productivity and growth: What do we really know?The Economic Journal, 108(447), 383-398.
- Edwards, S., & van Wijnbergen, S. (1989). Disequilibrium and structural adjustment. Handbook of Development Economics, 2, 1481-1533.
- Elbadawi, I. A. (1999). External aid: Help or hindrance to export orientation in Africa. Journal of African Economies, 8(4), 578–616. doi:10.1093/jae/8.4.578
- Falck, H. (1997). Aid and economic performance; The case of Tanzania, Lunds offset AB, Lunds. Carolinasalen.
- Fielding, D. (2010). Aid and Dutch disease in the South Pacific and in other small island states. The Journal of Development Studies, 46(5), 918-940.
- Frankel, J. A. (2010). The natural resource curse: A survey. HKS Working Paper No. RWP10-005. Cambridge, MA: Harvard University – Harvard Kennedy School (HKS); National Bureau of Economic Research (NBER)
- Harrigan, J., & Younger, S. (2000). Aid, debt and growth. In E. Aryeetey, J. Harrigan, & M. Nissanke (Eds.), Economic Reforms in Ghana: The Miracle and the Mirage (p. 374). Africa: James Currey Ltd. ISBN: 0865438447.
- Institute of Statistical, Social and Economic Research (ISSER). (2014). The state of the Ghanaian Economy in 2013. Legon: University of Ghana.
- Issa, H., & Ouattara, B. (2008). Foreign aid flows and real exchange rate: Evidence from Syria. Journal of Economic Development, 33, 133–146.
- Kang, J. S., Prati, A., & Rebucci, A. (2007). Aid, exports, and growth: A time series perspective on the Dutch disease hypothesis. Washington, DC: International Monetary Fund.
- Lancaster, C. (2007). Foreign aid: Diplomacy, development, domestic politics. Chicago: The University of Chicago Press.
- Li, Y., & Rowe, F. (2007). Aid inflows and the real effective exchange rate in Tanzania. World Bank Policy Research Working Paper Series No. 4456. Retreived from: https://ssrn.com/abstract=1077738
- Loxley, J. (1998). Interdependence, disequilibrium and growth: Reflections on the political economy of North-South relations at the turn of the century. Canada: International Political Economy Series, IDRC.
- Magus, N., & Sosa, S. (2010). When and why worry about real exchange rate appreciation? The missing link between dutch disease and growth. International Monetary Fund, IMF Working Paper; WP/10/271, Washington, DC.
- Nkusu, M., 2004, “Aid and the Dutch disease for low-income countries: Informed diagnoses for prudent prognoses,” IMF Working Paper 04/49. doi: 10.5089/9781451846874.001
- Nyoni, T. S. (1998). Foreign aid and economic performance in Tanzania. World Development, 26(7), 1235–1240. doi:10.1016/S0305-750X(98)00047-3
- Ogun, O. (1998). Real exchange rate movements and export growth: Nigeria, 1960-1990 (AYREC Research Paper 82). Nairobi: African Economic Research Consortium Research Paper.
- Opoku-Afari, Morrissey, M., & Lloyd, T. (2004), “Real exchange rate response to aid inflows: A dynamic analysis for Ghana,” Centre for the Study of African Economies Conference, April 2004, Oxford University, UK.
- Ouattara, B., & Strobl, E. (2008). Foreign aid inflows and the real exchange rate in the CFA Franc Zone. Économie Internationale, 116, 37–52.
- Pesaran, H., Shin, H., & Smith, R. J. (1996). Testing for the existence of a long-run relationship. (DAE working paper No. 9622). Department of Applied Economics, University of Cambridge, UK
- Pesaran, M. H., Shin, Y., & Smith, R. P. (2001). Pooled mean group estimation of dynamic heterogeneous panels. Journal of the American Statistical Association, 94, 621–634. doi:10.1080/01621459.1999.10474156
- Quartey, P. (2005). “Innovative ways of making aid effective in Ghana. Tied Aid versus Direct Budgetary Support,” Journal of International Development, 17, 1077–1092.
- Ravn, M. O., Schmitt-Grohe, S., & Uribe, M. (2012). Consumption, government spending, and the real exchange rate. Journal of Monetary Economics, 59, 215–234. doi:10.1016/j.jmoneco.2012.02.001
- Razin, O., & Collins, S. M. (1997). Real exchange rate misalignments and growth. NBER Working Paper No. 6174, Cambridge.
- Sachs, J. D., & Warner, A. M. (1995). Natural Resource Abundance and Economic Growth. National Bureau of Economic Research, NBER Working Papers 5398, Massachusetts Ave., Cambridge, MA.
- Sachs, J. D., & Warner, A. M. (2001). The curse of natural resources. European Economic Review, 45, 827–838. doi:10.1016/S0014-2921(01)00125-8
- Sackey, H. (2001) “External aid inflows and the real exchange rate in Ghana” AERC Research paper No. 110, African Economic Research Consortium, Nairobi.
- Samuelson, P. A. (1964). Theoretical notes on trade problems The Review of Economics and Statistics, 46(2): 145–154.
- Sanusi, A. R. (2011). Foreign aid inflows and the real exchange rate: Are there dutch disease effects in Ghana? The IUP Journal of Financial Economics, 9(4), 28–59.
- Selaya, P., & Thiele, R. (2010). Aid and sectoral growth: Evidence from panel data. Journal of Development Studies, 46, 1749–1766. doi:10.1080/00220388.2010.492856
- Sy, M., & Tabarraei, H. (2010) Capital inflows and exchange rate in LDCs: The Dutch disease problem revisited. PSE Working Papers n2009-26, Paris, France.
- Torres, N., Afonso, Ó., & Soares, I. (2013). A survey of literature 0n the resource curse: Critical analysis of the main explanations, empirical tests and resource proxies. CEF.UP Working Paper 2013–02.
- Uddin, K. M. K., Mohammad, M. R., & Quaosar, G. M. A. A. (2014). Causality between exchange rate and economic growth in Bangladesh. European Scientific Journal, 10(31), 11–26.
- Uneze, E. (2011). Foreign aid and exchange rate in the West Africa Economic and Monetary Union (WAEMU). Applied Economics and International Development, 11(2), 139–161.
- Van Wijnbergen, S. (1984). The ‘Dutch disease’: A disease after all? Economic Journal, 94(373), 41–55. doi:10.2307/2232214
- Van Wijnbergen, S. (1985), Aid, export promotion and the real exchange rate: An African Dilemma. Center for Economic Policy Research, Discussion Paper No. 88, London.
- White, H. (1992). The macroeconomic impact of development aid: A critical survey. Journal of Development Studies, 28(2), 163–240. doi:10.1080/00220389208422230
- White, H., & Wignaraja, G. (1992). Exchange Rates. Trade Liberalisation and Aid: the Sri Lankan Experience, World Development, 20, 1471–1480.
- World Bank (2004). World development indicators. Washington: D.C. World Bank.
- World Bank. (2017). World development Indicators. Washington, DC: Author.
- Younger, S. (1992). Aid and the dutch disease: Macroeconomic management when everybody loves you. World Development, 20, 1587–1597. doi:10.1016/0305-750X(92)90016-O
- Zakaria, M, & Ghauri, A. B. (2011). Trade openness and real exchange rate: Some evidence from Pakistan. Romanian Economic Journal, 14(39), 201-229.