
 ?Mathematical formulae have been encoded as MathML and are displayed in this HTML version using MathJax in order to improve their display. Uncheck the box to turn MathJax off. This feature requires Javascript. Click on a formula to zoom.
Abstract
We assessed the impact of stock market development on growth in Hong Kong for the period 1986Q2 to 2015Q4. By constructing a composite index of stock market development and controlling for the key determinants of growth, we found stock market development to promote growth both in the short and long run. We further constructed an alternative index of stock market development and found this conclusion to be robust. Our findings are broadly consistent with the growth experience of Hong Kong. Policies meant to promote stock market development may enhance growth in Hong Kong as well.
PUBLIC INTEREST STATEMENT
The stock market in Hong Kong has developed rapidly alongside the pace of economic growth during the past decades. Could it be that the stock market was the key driver of this economic expansion? In this paper, we attempted to answer this question by assessing the impact of stock market development on economic growth for the period 1986Q2–2015Q4. By constructing a composite index of stock market development and controlling for the key determinants of growth, we found stock market development to promote growth both in the short and long run. We constructed an alternative index of stock market development and found this conclusion to hold. Based on our findings, we believe that the policymakers in the country should continue to pursue policies that promote stock market development in order to sustain economic growth.
1. Introduction
In this paper, we assess the impact of stock market development on growth in Hong Kong. Stock markets have grown significantly during the past three decades. In response, various studies have explored the significance of stock markets in economic growth. The majority of the studies have established a positive association between stock market development and growth. In theory, stock markets may influence overall economic activities in myriad ways. From savings and investment channel, stock markets ensure efficient savings mobilization and facilitate prudent investment, which are crucial for growth (Greenwood & Smith, Citation1997). Stock markets ensure liquidity, allowing investors to trade financial assets in a less risky manner (Ho & Iyke, Citation2017). Market liquidity paves the way for companies to draw capital for operational purposes. This enhances long-term growth (Bencivenga, Smith, & Starr, Citation1996; Ho & Iyke, Citation2017; Levine, Citation1991). Stock markets are needed to facilitate the flow of world portfolios from safer low-return capital to riskier high-return capital. This has substantial welfare gains through the expected consumption growth channel (Obstfeld, Citation1994). Moreover, stock markets are effective in promoting the quality of corporate governance by addressing the principal-agent problem, thereby enhancing business activities (Jensen & Murphy, Citation1990).
In contrast, stock markets may adversely influence economic activities in a number of ways. Stock markets provide greater access to liquidity which may hamper the savings rate by enhancing the returns on investment (Demirgüc-Kunt & Levine, Citation1996). Stock markets reduce the uncertainty linked to investment, thereby making investment more enticing to risk-averse agents and reducing the demand for precautionary savings (Demirgüc-Kunt & Levine, Citation1996). Also, the incidence of excessive stock price volatility may contribute to an inefficient resource allocation and increases in the interest rate in response to higher uncertainty. This will compromise the quantity and productivity of the investment, thus inhibiting growth (Arestis, Demetriades, & Luintel, Citation2001; DeLong, Schleifer, Summers, & Waldmann, Citation1989). Additionally, highly liquid stock markets breed high rates of stock turnover. This stifles the need to affirm corporate control, hence compromising the quality of corporate governance (Jensen & Murphy, Citation1990).
The importance of stock markets in the economy appears therefore to be a divisive issue at best. The empirical literature has not yielded any conclusive evidence either. For instance, while studies such as Atje and Jovanovic (Citation1993), Levine and Zervos (Citation1996, Citation1998)), Beck and Levine (Citation2004), Rioja and Valev (Citation2004), and Akinlo and Akinlo (Citation2009) find stock market development to enhance growth, others such as Singh (Citation1997), Harris (Citation1997), Gilchrist, Yankov, and Zakrajšek (Citation2009), Næs, Skjeltorp, and Ødegaard (Citation2011), and Farmer (Citation2012) find stock market development to be irrelevant or sometimes hurt growth. The divisive nature of both the theoretical and empirical literature leaves the role of stock markets in the economy widely open for further probing. This paper explores the impact of stock market development on growth in Hong Kong. This country has pursued extensive reforms leading to rapid growth in its stock market for more than three decades. Today, the Hong Kong stock market is among the largest and most liquid markets around the world [World Federation of Exchanges (WFE), Citation2017]. During the expansion phase of the Hong Kong stock market, the country also experienced strong growth. These developments make Hong Kong a suitable candidate for the examination of the stock market-growth debate. Although existing studies have examined this topic, they are mostly based on panel and cross-country data. However, it is a known fact that by combining countries with different economic, socio-political, and institutional structures in a panel or cross-country setting, important country-specific information is lost. To be able to isolate important country-specific information in a panel data setting, the researcher must make appropriate assumptions and choose the right models (Hsiao, Citation2005). Also, cross-country data does not allow the researcher to explore economic relationships over time (Kramer, Citation1983). Taking all these into consideration, the previous studies may have not adequately produced important links between stock markets and the economy, particularly in Hong Kong.
Against this backdrop, we reassess the impact of stock market development on growth in Hong Kong during the period 1986Q2–2015Q4, by using time series approaches. Specifically, we utilize the autoregressive distributed lags (ARDL) approach which allows us to explore both the short- and the long-run impact of stock market development on growth. Since stock markets have different facets, we construct an index of stock market development based on the market capitalization ratio, total value traded ratio, and turnover ratio using the principal component analysis (PCA) method. We then controlled for structural changes and key determinants of growth and found stock market development to promote growth both in the short and long run. In order to ensure the robustness of our results, we further construct an alternative index of stock market development via the means-removed method. Using this alternative index of stock market development, we find our conclusion to hold. A common thread running through the results is that only the size of the impact of stock market development on growth depends on the choice of the stock market development index. Our results are broadly consistent with the growth experience of Hong Kong during the past three decades. The stock market in Hong Kong has developed rapidly alongside the pace of growth during the past decades. Our findings imply that policies meant to promote stock market development may also enhance economic growth in Hong Kong.
In the next section, we outline the development of the stock market in Hong Kong vis-à-vis the evolution of the country’s gross domestic product (GDP). In Section 3, we review the relevant literature. Then, in Section 4, we present the methodology and the data. Section 5 reports our main empirical results, and a sensitivity analysis of these results. Section 6 provides the conclusion.
2. The development of the Hong Kong stock market
The Hong Kong stock market has experienced over a 150 years of development. The trading activities of securities were recorded in 1866 after the establishment of first Companies Ordinance (see Schenk, Citation2001). As the share trading activities started to increase, the first stock exchange was formally established in 1981. It was known as the Association of Stockbrokers in Hong Kong. Later it was renamed the Hong Kong Stock Exchange in 1914 [Hong Kong Exchanges and Clearing Limited (HKEx), Citation2016a]. However, the share trading activities in the exchange was considered as insignificant during the early periods. It only started to flourish during 1970s owing to a number of factors including the reassurance from Mainland China about the political future of Hong Kong, the open-door policy adopted by Mainland China that enhanced Hong Kong as the financial gateway, and the increasing international capital flows into Asia, including Hong Kong (see Jao, Citation2003; Uddin & Wong, Citation1998). As a result, three more stock exchanges were set up during the period 1960 and 1970s (see Tsang, Citation2004).
Starting from the late 1980s, a series of major reforms and developments in the Hong Kong stock market were initiated by the government. For example, the four stock exchanges were unified as the Hong Kong Stock Exchange to reduce unhealthy competition among them (HKEx, Citation2016a). In addition, the Securities and Futures Commission was established in 1989 to serve as an independent statutory body regulating the securities and futures markets (Arner, Hsu, & Da Roza, Citation2010). Later in 1999, a second board called the Growth Enterprise Market was launched to provide a capital formation platform for start-up companies. In the same year, the stock and futures exchanges together with their clearing houses were merged under one single holding company, namely the Hong Kong Exchanges and Clearing Limited (HKEx) to reduce operation costs and increase international competitiveness. It was later demutualized and went public by way of introduction in 2000 (Hong Kong Exchanges and Clearing Limited, Citation2016a). Also, due to the increasing interactions of stock markets between Hong Kong and Mainland China, further reforms were carried out. For instance, in 2012, a joint venture of the HKEx, the Shanghai Stock Exchange and the Shenzhen Stock Exchange was formed to jointly develop the financial products and related services. In 2014, the Shanghai-Hong Kong Stock Connect was formally launched to provide a platform for mutual stock access between Shanghai and Hong Kong. More recently, the Shenzhen-Hong Kong Stock Connect was also launched in 2016 to further improve the stock trading activities between Hong Kong and Mainland China (Hong Kong Exchanges and Clearing Limited, Citation2016a, Citation2016b).
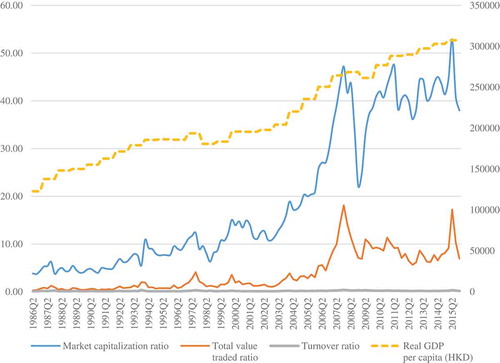
As a result of all these major reforms and developments, the stock market in Hong Kong has grown tremendously over the past few decades. For example, the absolute size of the stock market, measured by the market capitalization, increased significantly from HK$ 285,121 million in 1986Q2 to HK$ 24,565,117 million in 2015Q4 (HKEx, Citation2016c). In 2015, HKEx was ranked as the eighth largest stock market in the world, just behind the economic giants such as the United States, Europe, the United Kingdom, Mainland China and Japan (WFE, Citation2017). The growth of the stock market is even more phenomenal when we consider the size of stock market relative to its economy. As measured by market capitalization ratio, the international ranking improved from fourth-highest in 1989 to the highest in the world in 1999. It remained to have the highest ranking in the world during the period 1999 to 2015 [see World Development Indicators (WDI), Citation2017]. The impressive growth in market capitalization is mainly due to the increasing listing of Mainland enterprises in Hong Kong since 1990s, and the continuous expansion of Hong Kong companies into overseas markets (see Ho & Odhiambo, Citation2015; Lee & Poon, Citation2005). In addition to the size of the stock market, the liquidity of the stock market also improved during this period. As measured by the total value traded ratio, the ranking improved from the sixth highest in 1986 to the highest in the world in 2007. It remained the most liquid market during 2007 to 2015 (see WDI, Citation2017). When liquidity is measured by turnover ratio, however, the market’s liquidity dropped slightly from the ninth in 1986 to twelfth in 2015 (WDI, Citation2017). Based on the above indicators, one can argue that Hong Kong has an extremely large and liquid stock market in the world.
The phenomenal growth in the Hong Kong stock market is also associated with a high and sustainable economic growth in the country over the past few decades. Despite the negative impacts of the Asian Financial Crisis in 1997/1998, the outbreak of the epidemic virus in 2003, the global financial crisis in 2008, and the recent European sovereign debt crisis, the real GDP per capita has shown an increasing trend. It increased from HK$ 122,723 in 1986Q2 to HK$ 307,483 in 2015Q4, representing a 2.5 times increase during this period [International Financial Statistics (IFS), Citation2016]. Such economic improvement has uplifted Hong Kong to become a high-income economy according the standard of the World Bank (see WDI, Citation2017). Figure shows the various indicators of stock market development and the economic performance in Hong Kong during 1986Q2–2015Q4. Could it be that the Hong Kong stock market was the key driver of this economic expansion? In the rest of the paper, we attempt to answer this question.
Figure 1. Evolution of the stock market and economic performance in Hong Kong during 1986Q2 to 2015Q4.
Sources: IFS (Citation2016) and HKEx (Citation2016c)
3. Literature review
The nature of the relationship between stock market development and economic growth has been widely documented in the existing literature. Some of the studies show that there exists a positive relationship between stock market development and economic growth (see, for example, Akinlo and Akinlo, Citation2009; Adjasi & Biekpe, Citation2006; Arestis et al., Citation2001; Atje & Jovanovic, Citation1993; Beck & Levine, Citation2004; Choong, Baharumshah, Yusop, & Habibullah, Citation2010; Cooray, Citation2010; Levine & Zervos, Citation1996, Citation1998; Masoud & Hardaker, Citation2012; Minier, Citation2003; Ngare, Nyamongo, & Misati, Citation2014).
Atje and Jovanovic (Citation1993), by using cross-growth regression framework in 40 countries covering the period 1980–1988, find that stock market exerts a large and positive effect on both the level and growth rate of economic activities. Levine and Zervos (Citation1996) examine the association between stock market and economic growth in 41 countries, including Hong Kong, for the period 1976–1993. The results of their pooled cross-country, time-series regressions show that stock market development has a positive impact on the long-run economic growth. Later in another study, Levine and Zervos (Citation1998) employ cross-country regression for 47 countries, including Hong Kong. They find that stock market size and liquidity have a positive influence on the current and future rates of economic growth. Arestis et al. (Citation2001) find the positive influence of stock markets on economic growth to be stronger than the positive influence of banks. Minier (Citation2003), based on the dataset of Levine and Zervos (Citation1998), shows that stock market development is positively associated with economic growth in those countries with high levels of stock market capitalization such as Hong Kong. Rioja and Valev (Citation2004), also share a similar view with Minier (Citation2003) by showing that stock market development has a strong positive influence on economic growth in the more developed economies. Beck and Levine (Citation2004) find similar evidence of a positive impact of stock markets on economic growth in their panel data study. Adjasi and Biekpe (Citation2006) investigate the relationship of stock market development and economic growth in 14 African countries. They find that stock market development and economic growth are positively related. Akinlo and Akinlo (Citation2009), using the ARDL bounds testing approach, find that stock market development exerts a positive impact on economic growth in seven sub-Saharan countries. Cooray (Citation2010), using the stock market augmented model for a cross section of 35 developing countries, finds that size, liquidity and activities of stock market enhance economic growth. Recently studies such as Masoud and Hardaker (Citation2012), and Ngare et al. (Citation2014) also find that stock market development and economic growth are positively related.
On the contrary, there are some studies showing that stock market development does not enhance economic growth (see Harris, Citation1997; Levine & Zervos, Citation1998; Naceur & Ghazouani, Citation2007; Naceur, Ghazouani, & Omran, Citation2008; Singh, Citation1997). The findings from these studies suggest that in the early stage of stock market development, the underdeveloped financial systems may affect the quality of association between stock market development and economic growth. For example, Singh (Citation1997), while examining the role of stock markets on the economic growth in developing economies during the period 1980 and 1990s, argues that stock market development is unlikely to help in achieving faster long-term economic growth in most of the countries. In the same vein, Harris (Citation1997), while examining the empirical relationship between stock markets and economic growth in 49 countries covering the period 1980 to 1991, finds no clear evidence that stock market development is associated with per capita output growth in the whole sample and in the sub-samples. Although, in their study, Levine and Zervos (Citation1998) find that stock market liquidity is systematically associated with long-term growth, they also find no such link between stock market size or volatility and long-term growth. Similarly, Naceur and Ghazouani (Citation2007) assess the impact of stock market on economic growth for a sample of 11 MENA countries over a varying period 1979–2003. By using GMM techniques, they find that there is no significant relationship between stock market development and growth under less-developed financial systems. Later on, a related study conducted by Naceur et al. (Citation2008), using annual data from 11 MENA countries covering the period 1979–2005, find that stock market liberalization has no effect on economic growth. Highly developed stock markets breed highly sophisticated products that may not be suitable as investment vehicles in the long term. A loss in investor confidence in these highly sophisticated products may lead to stock market crashes due to sharp shrinkages in stock market liquidity and severe economic downturns such as the one that the global economy experienced between 2007 and 2009 (see Farmer, Citation2012; Gilchrist et al., Citation2009; Næs et al., Citation2011). Moreover, as stock markets continue to develop, they become more volatile. Stock market volatility is likely to hurt long-term growth than improve it (see Stock & Watson, Citation2012).
The divisive nature of the existing literature leaves the stock market-growth nexus open for further examination. This paper joins the previous studies by re-examining the stock market–growth relationship for Hong Kong. As seen from the evolution of the Hong Kong Stock market vis-à-vis the GDP, there is a potential positive link between the stock market and economic growth in this country. However, a formal empirical examination of this link has been conducted by previous studies using cross-sectional or panel data. Such data may not adequately reflect the country’s unique experience. As stated earlier, by combining countries with different economic, socio-political, and institutional structures in a panel or cross-country setting, important country-specific information is lost (Hsiao, Citation2005; Kramer, Citation1983). Hence, we move away from this tradition by using time series techniques to uniquely document the stock mark-growth link for Hong Kong, thereby providing further insights into the topic.
4. Methods and data
4.1. Empirical specification
To examine the role of stock market development in growth for Hong Kong, we fit a standard growth model of the form:
where is the logarithm of real GDP per capita at period
,
,
,
,
, and
are the logarithms of human capital, physical capital, stock market development, inflation, and government expenditure at period
, respectively;
is the dummy variable that captures the presence of structural breaks;
are the parameters of the model, and
is an iid error term.
The motivation for using these variables as controls is informed by the literature. First of all, the size of a country’s human capital stock is vital for its growth (see Barro, Citation1991; Lucas, Citation1988). Therefore, in a growth regression, human capital should be included. Following Psacharopoulos (Citation1994) and Barro (Citation2001), we include human capital in our model. Second, all growth models emphasize the role of physical capital in economic growth (see Barro, Citation1991; Mankiw, Romer, & Weil, Citation1992; Moral-Benito, Citation2012; León-González & Vinayagathasan, Citation2015; Iyke, Citation2017; for instance). The fast-growing countries, today boast substantial stock of physical capital. Besides, Grossman and Helpman (Citation1991a) find productivity growth to be an increasing function of physical capital stock. Most growth models have underscored the role of inflation in economic growth. For example, De Gregorio (Citation1992), Fischer (Citation1993), Sbordone and Kuttner (Citation1994), and Smyth (Citation1994), argue that inflation has a negative impact on economic growth. Higher inflationary environments are not conducive for general business activities and the performance of the economy. Finally, it is well known that countries whose governments pile up huge debts are unable to progress. The growth experiences of the heavily indebted poor countries come to mind. Therefore, most empirical studies have recommended the inclusion of this variable (see Aghion, Bacchetta, Ranciere, & Rogoff, Citation2009; Barro, Citation2003).
During the study period 1986Q2–2015Q4, international and domestic events such as the Asian financial crisis, the outbreak of the epidemic virus in Hong Kong, the global financial crisis, and the European sovereign debt crisis may generate exogenous shocks that distort the path of the underlying series in our model. Therefore, we consider the presence of structural breaks in the underlying series by including a dummy variable (DUM) in the model. It takes the value of zero before a structural change and one after.
A crucial requirement is to establish the integration properties of the variables in the model. If the variables are integrated of orders other than zero, estimating Eq. (1) results in some important information being lost. Specifically, if these variables are integrated of orders other than zero, they may have a common long-run relationship. This means that, if unaccounted for, the short-run dynamics of Eq. (1) are excluded. We sidestep this problem by examining the integration properties of the series and testing for potential cointegration among the variables.
To do this, we employ the autoregressive distributed lag (ARDL) bounds testing procedure developed by Pesaran, Shin, and Smith (Citation2001). This approach is known to offer desirable statistical benefits, when compared to its competitors. Amongst these benefits are: It is applicable regardless of whether the variables are integrated of orders zero, one, a mixture, or fractional; pretesting for the order of integration is not a requisite, plus it has better finite sample properties (see Pesaran et al., Citation2001).
Cointegration can be tested by reformulating Equation (1) into the following general equation:
where ,
,
, and
are, respectively, the white-noise error term, the short-run coefficients, the long-run coefficients, and the first difference operator. In addition, t and
denote, respectively, time period and the maximum number of lags in the model. Written in this form,
denotes the growth rate of real GDP per capita.
There exists cointegration among the variables in Equation (2), if at least one of the s is significantly different from zero. The joint restriction of the
s to be zero (i.e. the null hypothesis of no cointegration) generally follows a non-standard asymptotic F-distribution. Hence, Pesaran et al. (Citation2001) have derived two sets of critical values under this null hypothesis. The first set of critical values are constructed under the assumption that variables in the ARDL model are integrated of order zero, I(0). The second set of critical values are constructed under the assumption that variables in the model are integrated of order one, I(1). We do not reject the null hypothesis of no cointegration relationships when the calculated F-statistic falls below the lower-bound values. Similarly, we reject the null hypothesis of no co-integration when the calculated F-statistic is greater than the upper-bound values. However, the test is inconclusive, when the F-statistic falls between the lower and upper bounds.
Once there exists cointegrating relationship among the variables, we have to estimate the corresponding error correction model in the spirit of the Engle-Granger representation theorem. The equivalent error correction model for Eq. (2) will be of the following form:
where all the variables and parameters retain their definitions. is the one-period lag error correction term.
is the coefficient of the error correction term, which must be negative, statistically significant, and below unity in absolute terms.
4.2. Data
We use quarterly data covering the period 1986Q2–2015Q4. Our choice of this sample period is motivated by data availability. As specified in Eq. (1), we use the following variables: real GDP per capita (Y), human capital (HC), physical capital (PC), stock market development (SMD), inflation (INF), and government expenditure (GOV). These are, respectively, defined as gross secondary enrolment ratio, fixed capital formation as a percentage of GDP, stock market development calculated by using the PCA or means-removed method, quartersgly growth rate of consumer price index and government spending as a percentage of GDP. The data on these variables are taken from the Census and Statistics Department of Hong Kong (2016Citation), International Financial Statistics (IFS) (Citation2016), and Penn World Table version 8.1. All the variables are seasonally adjusted. To construct the index of stock market development using the PCA method (i.e. SMD_PCA), we extract three popular indicators of the stock market: market capitalization ratio (MCR), total value trade ratio (TVR), and turnover ratio (TOR).Footnote1 We then extract the eigenvectors of MCR, TVR and TOR, transpose and multiply the eigenvectors to the transpose of the raw data of MCR, TVR and TOR. The resulting stock market development index will be a matrix of the form 1×q, where q is the number of columns. As a final step, we transpose this matrix into the form q×1. To construct the index of stock market development using the means-removed method (i.e. SMD_MR), we average the means-removed values of MCR, TVR and TOR in two-steps. First, we compute the means-removed values of MCR, TVR, and TOR. For example, the means-removed values of MCR at time will be
, where
is the mean of
(i.e. MCR over the period 1986Q2–2015Q4), and
is the absolute value operator. Second, once the means-removed values of MCR, TVR, and TOR are obtained, we average them by rows to obtain the index of stock market development. Table shows the descriptive statistics of the variables used in the paper.
Table 1. Descriptive statistics of the variables
5. Results
5.1. Tests for order of integration of the variables
We begin the empirical analysis by testing for the stationary properties of the variables. This is necessary because the ARDL approach requires the variables to be integrated of at most order one. To do this, we employed the Perron and Zivot-Andrews tests developed by Perron (Citation1997), and Zivot and Andrews (Citation1992), respectively. The results are reported in Table . The results show that none of the variables are integrated of orders greater than one at the conventional levels of significance.
Table 2. Tests for unit roots of the variables
5.2. Test for cointegration
We examine the cointegrating relationships among the variables using the ARDL bounds testing approach. An optimal lag of 3 is selected using the Akaike information criterion (AIC). Using the optimal lag of 3, we perform the cointegration test and report the results in Table . The calculated F-statistic is approximately 4.205. This is greater than the upper bound critical value of 3.79 at 5% significance level. Hence, the variables in Eq. (2) are cointegrated, meaning that there exists an error correction model of the form in Eq. (3).
Table 3. Results of cointegration test
5.3. Short- and long-run estimates
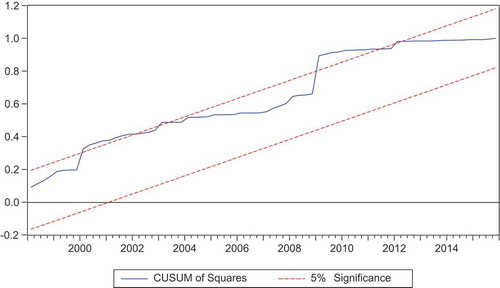
Since the variables are cointegrated, we estimate Eqs. (2) and (3), the long- and short-run models, respectively. Using the AIC, the preferred model is ARDL(1, 0, 1, 0, 0, 1). The short- and long-run estimates for this ARDL model are reported in Tables and , respectively. For these results to be reliable, they should pass all the diagnostic tests. Table reports the diagnostic tests, namely: Serial correlation, normality, heteroskedasticity, and the specification of the correct functional form. The tests show that the short- and long-run estimates are reliable. Although the cumulative sum of recursive residuals (CUSUM) and the cumulative sum of squares of recursive residuals (CUSUMSQ) plots show evidence of parameter instability, they return to well within the critical bounds later on (see Figures and ). Besides, since the specifications account for this instability, the CUSUM and CUSUMSQ tests are irrelevant. Thus, using the short- and long-run estimates for forecasting purposes could be useful.
Table 4. Short-run estimates for ARDL(1, 0, 1, 0, 0, 1)
Table 5. Long-run estimates for ARDL (1, 0, 1, 0, 0, 1)
Table 6. Diagnostic tests for ARDL (1, 0, 1, 0, 0, 1)
Figure 2. Plot of cumulative sum of recursive residuals (CUSUM).
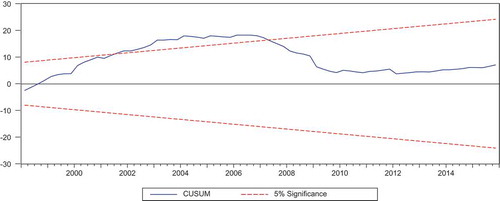
Figure 3. Plot of cumulative sum of squares of recursive residuals (CUSUMSQ).
Before looking at the long-run estimates, let us first consider the short-run estimates. The error correction term is negative and statistically significant. It shows that 12.6% of the fluctuations in growth below or above equilibrium are corrected each quarter. This is considerably slow since booms and busts are expected to persist. Positive growth in the stock market and government expenditure appear to promote growth in the short run. Growth in inflation appears to exert a positive but insignificant impact on economic growth in the short run. The basic determinants of growth, namely human capital and physical capital affect growth differently. The former affects growth positively, while the latter affects growth negatively. However, their effects are insignificant in the short run.
We now turn to the long-run estimates. These are reported in Table . The human capital has a positive impact on growth, and this is statically significant at 10%. A percentage increase in human capital leads to nearly 0.46% increase in growth, other factors remaining the same. The positive impact of human capital estimated here is consistent with previous studies (see, for instance, Barro, Citation1991; Bodman & Le, Citation2013; Grossman & Helpman, Citation1991b; Ho, Citation2018; Teixeira & Queirós, Citation2016). Next, the coefficient of the stock market development index is positive and statistically significant at 1% in the long run. The estimated coefficient implies that a percentage increase in stock market development leads to nearly 0.27% increase in growth, other things remaining unchanged. Some of the previous studies have found stock market development to be associated with growth as well. These studies include Atje and Jovanovic (Citation1993), Levine and Zervos (Citation1996, Citation1998)), Arestis et al. (Citation2001), Minier (Citation2003), Beck and Levine (Citation2004), Adjasi and Biekpe (Citation2006), Akinlo and Akinlo (Citation2009), Choong et al. (Citation2010), Cooray (Citation2010), Masoud and Hardaker (Citation2012), and Ngare et al. (Citation2014). Finally, the coefficient of government expenditure is positive and significant at 5% in the long run. A percentage increase in government expenditure leads to approximately 0.60% increase in growth in the long run, given that other factors remain the same. Other studies have documented similar evidence (see, among others, Bergh & Karlsson, Citation2010; Easterly & Rebelo, Citation1993; Fölster & Henrekson, Citation2006; Hansson & Henrekson, Citation1994).
5.4. Sensitivity analysis
One may question whether the results reported above are sensitive to the proxy for stock market development. This may be the case because various proxies for stock market development have idiosyncratic limitations. Therefore, it is important to see what happens to our results if we use a different proxy for stock market development. Here, we use a composite index of stock market development based on the method of means-removed as discussed in the data section. The stationary properties of this variable have been explained in Section 4.1. Similar to the earlier results, we test for cointegrating relationship among the variables in our model choosing an optimal lag of 3 based on AIC. The results of the cointegration test are reported in Table . The calculated F-statistic is approximately 4.917. This value is greater than the upper bound critical value of 4.68 at 1% significance level. This implies that the variables in Eq. (1) are cointegrated.
Table 7. Results of cointegration test for the alternative measure of stock market development
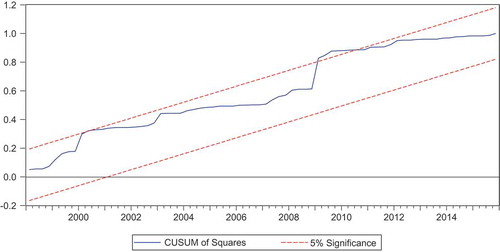
We then estimate the short- and long-run models accordingly, restricting the initial lag length to 3. The AIC selected ARDL(1, 0, 2, 0, 3, 1) as the most preferred model. The corresponding short- and long-run estimates for this ARDL model are reported in Tables and , respectively. The diagnostic tests in Table show that the short- and long-run estimates are reliable, though the CUSUMSQ plot shows evidence of parameter instability between 2009 and 2010 (see Figures and ). As mentioned earlier, the CUSUMSQ test is not relevant because we have modelled the structural breaks. Hence, the short- and long-run estimates may be suitable for forecasting purposes.
Table 8. Short-run estimates for ARDL (1, 0, 2, 0, 3, 1)
Table 9. Long-run estimates for ARDL (1, 0, 2, 0, 3, 1)
Table 10. Diagnostic tests for ARDL (1, 0, 2, 0, 3, 1)
Figure 4. Plot of cumulative sum of recursive residuals (CUSUM).
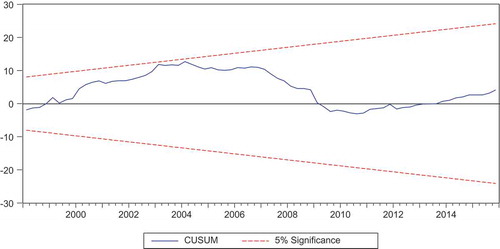
Figure 5. Plot of cumulative sum of squares of recursive residuals (CUSUMSQ).
In the case of the short-run estimates, the error correction term is negative and statistically significant at 1%. The estimate shows that approximately 7.5% of the fluctuations in growth are corrected each quarter. When compared with the previous estimate, the adjustment to equilibrium is relatively slower in this case. Stock market development appears to have a positive impact on growth in the short run, which is consistent with the above results. Inflation rate has a negative but statistically insignificant impact on growth. In contrast, one and two-period lags of inflation have positive impacts on growth. Government expenditure affects growth positively in the short run. Moreover, human capital and physical capital have positive impact on growth in the short run—although only one-period lag of physical capital appears to be statistically significant.
The long-run estimates are reported in Table . As with the main results, human capital is statically significant at 1%. Controlling for other factors, a percentage increase in human capital leads to approximately 1.40% increase in growth. The coefficient of the alternative stock market development index is positive and statistically significant at 1% in the long run. A percentage increase in stock market development leads to nearly 0.18% increase in growth, other things remaining the same. Notice that when compared with the previous result, the impact has reduced by approximately 0.09%. Perhaps, this shows that the proxy for stock market development may only affect the size of the impact but not the sign. The coefficients of inflation rate and government expenditure are negative and positive, respectively. They are also statistically significant at 1% and 5%, respectively. Although the sign of the coefficient of inflation is positive in the main results, it is statistically insignificant. The estimates generally show that the proxy for stock market development does not influence the sign of the coefficients in the model except for inflation.
6. Conclusion
We set out to assess the impact of stock market development on growth in Hong Kong. This country has pursued extensive reforms leading to rapid growth in its stock market for more than three decades. Today, the Hong Kong stock market is among the largest and most liquid markets around the world. During the expansion phase of the Hong Kong stock market, the country has also seen a strong growth. However, a formal assessment of the link between the country’s stock market and its growth has been limited to cross-sectional and panel data studies. Each country has a unique experience. Hence, combining countries in cross-sectional or panel settings may mask the true stock market–growth nexus for individual countries. Furthermore, the general studies regarding the stock market–growth nexus have yielded mixed findings, leaving the relationship open for further examination. This paper revisited the relationship for Hong Kong using time series techniques, thereby reporting the country’s unique experience. Since the stock market has different facets, we constructed an index of stock market development using the PCA method. We constructed this index by extracting the three popular stock market indicators, namely: market capitalization ratio, total value of trade ratio, and turnover ratio. To perform a sensitivity analysis of our results, we constructed an alternative index of stock market development which drew on the three stock market indicators using the method of mean WDs-removed. We sidestepped issues of omitted variable bias and structural changes. Using the ARDL approach and a dataset covering the period 1986Q2–2015Q4, we found stock market development to exert a positive impact on growth both in the short and long run. Our results suggested that the proxy for stock market development did not influence the sign of the impact of stock market development on growth. Albeit, there was a hint that it may influence the size of the impact. We also found that human capital and government expenditure exerted a positive impact on growth. In contrast, inflation rate exerted a negative impact on growth. These findings are consistent with the existing literature. Based on our findings, we believe that the policymakers in the country should continue to pursue policies that promote stock market development in order to sustain growth. The rapid expansion of the Hong Kong stock market may be tied to the financial liberalization of Mainland China since the early 1990s. During the financial liberalization process of the early 1990s, the Hong Kong Stock Exchange performed a unique role of listing red chips, H-shares, and initial public offerings of Chinese state-owned banks (see Ho & Odhiambo, Citation2015), which was essential for its drastic expansion. Therefore, to further enlarge the scale and depth of Hong Kong stock market, it may be a good initiative for the stock markets in Hong Kong and the ones in Mainland China to continue to integrate. This is a direction that both economies have already taken. In November 2014, the Shanghai-Hong Kong Stock Connect was launched to establish a cross-broader connectivity in stock trading. In addition, the Shenzhen-Hong Kong Stock Connect was also launched by the end of 2016 (HKEx, Citation2016b). Owing to these path-breaking initiatives, we expect the Hong Kong stock market to experience another wave of growth, and a positive spill-over effect to the economy’s growth.
Additional information
Funding
Notes on contributors
Sin-Yu Ho
Sin-Yu Ho is a senior lecturer at the Department of Economics of the University of South Africa where she focuses on topics relating to development finance, stock markets, emerging markets and developing countries.
Notes
1. See also Karimo and Ogbonna (Citation2017).
References
- Adjasi, C. K. D., & Biekpe, N. B. (2006). Stock market development and economic growth: The case of selected African countries. African Development Review, 18(1), 144–161. doi:10.1111/j.1467-8268.2006.00136.x
- Aghion, P., Bacchetta, P., Ranciere, R., & Rogoff, K. (2009). Exchange rate volatility and productivity growth: The role of financial development. Journal of Monetary Economics, 56(4), 494–513. doi:10.1016/j.jmoneco.2009.03.015
- Akinlo, A. E., & Akinlo, O. O. (2009). Stock market development and economic growth: Evidence from seven sub-Sahara African countries. Journal of Economics and Business, 61(2), 162–171. doi:10.1016/j.jeconbus.2008.05.001
- Arestis, P., Demetriades, P. O., & Luintel, K. B. (2001). Financial development and economic growth: The role of stock markets. Journal of Money. Credit and Banking, 33(1), 16–41. doi:10.2307/2673870
- Arner, D. W., Hsu, B. F. C., & Da Roza, A. M. (2010). Financial regulation in Hong Kong: Time for a change. Asian Journal of Comparative Law, 5(1), Article 8.
- Atje, R., & Jovanovic, B. (1993). Stock market and development. European Economic Review, 37, 623–640. doi:10.1016/0014-2921(93)90053-D
- Barro, R. J. (1991). Economic growth in a cross section of countries. The Quarterly Journal of Economics, 106(2), 407–443. doi:10.2307/2937943
- Barro, R. J. (2001). Human capital and growth. The American Economic Review, 91(2), 12–17. doi:10.1257/aer.91.2.12
- Barro, R. J. (2003). Determinants of economic growth in a panel of countries. Annals of Economics and Finance, 4, 231–274.
- Beck, T., & Levine, R. (2004). Stock markets, banks, and growth: Panel evidence. Journal of Banking & Finance, 28(3), 423–442. doi:10.1016/S0378-4266(02)00408-9
- Bencivenga, V. R., Smith, B. D., & Starr, R. M. (1996). Equity Markets. Transactions Costs, and Capital Accumulation: an Illustration. World Bank Economic Review, 10(May), 241–265.
- Bergh, A., & Karlsson, M. (2010). Government size and growth: Accounting for economic freedom and globalization. Public Choice, 142, 195–213. doi:10.1007/s11127-009-9484-1
- Bodman, P., & Le, T. (2013). Assessing the roles that absorptive capacity and economic distance play in the foreign direct investment-productivity growth nexus. Applied Economics, 45(8), 1027–1039. doi:10.1080/00036846.2011.613789
- Census and Statistics Department of Hong Kong. [Online] Retrieved June 4, 2016, from http://www.censtatd.gov.hk/hong_kong_statistics/statistical_tables/index.jsp?tableID=030
- Choong, C. K., Baharumshah, A. Z., Yusop, Z., & Habibullah, M. S. (2010). Private capital flows, stock market and economic growth in developed and developing countries: A comparative analysis. Japan and the World Economy, 22(2), 107–117. doi:10.1016/j.japwor.2009.07.001
- Cooray, A. (2010). Do stock markets lead to economic growth? Journal of Policy Modeling, 32(4), 448–460. doi:10.1016/j.jpolmod.2010.05.001
- De Gregorio, J. (1992). Economic growth in Latin America. Journal of Development Economics, 39(1), 59–84. doi:10.1016/0304-3878(92)90057-G
- DeLong, J. B., Schleifer, A., Summers, L. H., & Waldmann, R. J. (1989). The size and incidence of the losses from noise trading. Journal of Finance, 44(September), 681–696. doi:10.1111/j.1540-6261.1989.tb04385.x
- Demirgüc-Kunt, A., & Levine, R. (1996). Stock markets. Corporate Finance, and Economic Growth: an Overview. World Bank Economic Review, 10(May), 223–239.
- Easterly, W., & Rebelo, S. (1993). Fiscal policy and economic growth. Journal of Monetary Economics, 32, 417–458. doi:10.1016/0304-3932(93)90025-B
- Farmer, R. E. (2012). The stock market crash of 2008 caused the great recession: Theory and evidence. Journal of Economic Dynamics and Control, 36(5), 693–707. doi:10.1016/j.jedc.2012.02.003
- Fischer, S. (1993). The role of macroeconomic factors in growth. Journal of Monetary Economics, 32, 485–512. doi:10.1016/0304-3932(93)90027-D
- Fölster, S., & Henrekson, M. (2006). Growth effects of government expenditure and taxation in rich countries, A reply. European Economic Review, 50, 219–221. doi:10.1016/j.euroecorev.2005.02.007
- Gilchrist, S., Yankov, V., & Zakrajšek, E. (2009). Credit market shocks and economic fluctuations: Evidence from corporate bond and stock markets. Journal of Monetary Economics, 56(4), 471–493. doi:10.1016/j.jmoneco.2009.03.017
- Greenwood, J., & Smith, B. (1997, January). Financial markets in development and the development of financial markets. Journal of Economic Dynamics and Control, 21, 145–182. doi:10.1016/0165-1889(95)00928-0
- Grossman, G., & Helpman, E. (1991a). Innovation and growth in the global economy. Cambridge,: Mass: MIT Press.
- Grossman, G., & Helpman, E. (1991b). Quality ladders in the theory of growth. The Review of Economic Studies, 58(1), 43–61. doi:10.2307/2298044
- Hansson, P., & Henrekson, M. (1994). A new framework for testing the effect of government spending on growth and productivity. Public Choice, 81, 381–401. doi:10.1007/BF01053239
- Harris, R. (1997). Stock market and development: A re-assessment. European Economic Review, 41, 139–146. doi:10.1016/S0014-2921(96)00021-9
- Ho, S. Y. (2018). Analysing the sources of growth in an emerging market economy: The Thailand experience. International Journal of Sustainable Economy. doi:10.1504/IJSE.2018.10015305
- Ho, S. Y., & Iyke, B. N. (2017). Determinants of stock market development: A review of the literature. Studies in Economics and Finance, 34(1), 143–164. doi:10.1108/SEF-05-2016-0111
- Ho, S. Y., & Odhiambo, N. M. (2015). Stock market performance in Hong Kong: An exploratory review. Asian‐Pacific Economic Literature, 29(1), 47–61. doi:10.1111/apel.12098
- Hong Kong Exchanges and Clearing Limited. (2016a). Hong Kong exchange fact book. Retrieved June 22, 2017, from http://www.hkex.com.hk/eng/stat/statrpt/factbook/factbook.htm
- Hong Kong Exchanges and Clearing Limited. (2016b). HKEX strategic plan 2016–2018. Retrieved November 22, 2016 http://www.hkexgroup.com/About-HKEX/Company-Information/-/media/DFB65584DD2E4F72996BCB39C8348286.ashx
- Hong Kong Exchanges and Clearing Limited. (2016c). Securities statistics archive. Retrieved June 22, 2017, from http://www.hkex.com.hk/eng/stat/smstat/statarch/statarchive.htm
- Hsiao, C. (2005). Why panel data? Singapore Economic Review, 50(2), 1–12. doi:10.1142/S0217590805001937
- International Financial Statistics. (2016). International monetary fund. Washington, D.C. Retrieved May 30, 2016, from http://www.easydata.co.za/data/dimensionnode/IFS-TREE_3
- Iyke, B. N. (2017). The real effect of currency misalignment on productivity growth: Evidence from middle-income economies. Empirical Economics, 1–23.
- Jao, Y. C. (2003).Financial reform in Hong Kong. In M. J. B. Hall (Ed.), The international handbook on financial reform. Edward Elgar Publishing, Cheltenham (Chapter 6).
- Jensen, M. C., & Murphy, K. J. (1990, April). Performance pay and top management incentives. Journal of Political Economy, 225–264. doi:10.1086/261677
- Karimo, T. M., & Ogbonna, O. E. (2017). Financial deepening and economic growth nexus in Nigeria: Supply-leading or demand-following? Economies, 5(1), 4. doi:10.3390/economies5010004
- Kramer, G. H. (1983). The ecological fallacy revisited: Aggregate versus individual-level findings on economics and elections and sociotropic voting. American Political Science Review, 77, 92–111. doi:10.2307/1956013
- Lee, J., & Poon, J. (2005). Alternative measures of the size of the stock market. Securities and Futures Commission Research Paper No. 27.
- León-González, R., & Vinayagathasan, T. (2015). Robust determinants of growth in Asian developing economies: A Bayesian panel data model averaging approach. Journal of Asian Economics, 36(C), 34–46. doi:10.1016/j.asieco.2014.12.001
- Levine, R. (1991). Stock markets, growth, and tax policy. Journal of Finance, 46, 1445–1465. doi:10.1111/j.1540-6261.1991.tb04625.x
- Levine, R., & Zervos, S. (1996). Stock market development and long run growth. World Bank Economic Review, 10, 2. doi:10.1093/wber/10.2.323
- Levine, R., & Zervos, S. (1998). Stock markets, banks and economic growth. American Economic Review, 98(June), 537–558.
- Lucas, R. E. (1988). On the mechanics of economic development. Journal of Monetary Economics, 22(1), 3–42. doi:10.1016/0304-3932(88)90168-7
- Mankiw, G. N., Romer, D., & Weil, D. N. (1992). A contribution to the empirics of economic growth. Quarterly Journal of Economics, 107(2), 407–437. doi:10.2307/2118477
- Masoud, N., & Hardaker, G. (2012). The impact of financial development on economic growth: Empirical analysis of emerging market countries. Studies in Economics and Finance, 29(3), 148–173. doi:10.1108/10867371211246830
- Minier, J. (2003). Are small stock markets different? Journal of Monetary Economics, 50, 1593–1602. doi:10.1016/j.jmoneco.2003.08.006
- Moral-Benito, E. (2012). Determinants of economic growth: A Bayesian panel data approach. Review of Economics and Statistics, 94(2), 566–579. doi:10.1162/REST_a_00154
- Naceur, S. B., & Ghazouani, S. (2007). Stock markets, banks, and economic growth: Empirical evidence from the MENA region. Research in International Business and Finance, 21(2), 297–315. doi:10.1016/j.ribaf.2006.05.002
- Naceur, S. B., Ghazouani, S., & Omran, M. (2008). Does stock market liberalization spur financial and economic development in the MENA region? Journal of Comparative Economics, 36(4), 673–693. doi:10.1016/j.jce.2007.12.002
- Næs, R., Skjeltorp, J. A., & Ødegaard, B. A. (2011). Stock market liquidity and the business cycle. The Journal of Finance, 66(1), 139–176. doi:10.1111/j.1540-6261.2010.01628.x
- Ngare, E., Nyamongo, E. M., & Misati, R. N. (2014). Stock market development and economic growth in Africa. Journal of Economics and Business, 74, 24–39. doi:10.1016/j.jeconbus.2014.03.002
- Obstfeld, M. (1994). Risk-taking, global diversification, and growth. American Economic Review, 84, 1310–1329.
- Penn World Table, version 8.1. (2016). [Online] Retrieved July 14, 2016, fromwww.ggdc.net/pwt
- Perron, P. (1997). Further evidence on breaking trend functions in macroeconomic variables. Journal of Econometrics, 80(2), 355–385. doi:10.1016/S0304-4076(97)00049-3
- Pesaran, M. H., Shin, Y. C., & Smith, R. (2001). Bound testing approaches to the analysis of level relationships. Journal of Applied Econometrics, 16, 289–326. doi:10.1002/jae.616
- Psacharopoulos, G. (1994). Returns to investment in education: A global update. World Development, 22(9), 1325–1343. doi:10.1016/0305-750X(94)90007-8
- Rioja, F., & Valev, N. (2004). Does one size fit all? A reexamination of the finance and growth relationship. Journal of Development Economics, 74(2), 429–447. doi:10.1016/j.jdeveco.2003.06.006
- Sbordone, A. M., & Kuttner, K. N. (1994). Does inflation reduce productivity? Economic Perspectives, 18, 2–14.
- Schenk, C. R. (2001). Hong Kong as an international financial centre: Emergence and development 1945–1965. London: Routledge.
- Singh, A. (1997). Financial liberalization, Stock markets and economic development. The Economic Journal, 107, 771–782. doi:10.1111/j.1468-0297.1997.tb00042.x
- Smyth, D. J. (1994). Inflation and Growth, Journal of Macroeconomics, 16(2), 261–270. doi:10.1016/0164-0704(94)90070-1
- Stock, J. H., & Watson, M. W. (2012). Disentangling the channels of the 2007–2009 recession (No. w18094). National Bureau of Economic Research.
- Teixeira, A. A., & Queirós, A. S. (2016). Economic growth, human capital and structural change: A dynamic panel data analysis. Research Policy. doi:10.1016/j.respol.2016.04.006
- Tsang, S. (2004). A modern history of Hong Kong. London: I.B. Tauris & Co Ltd.
- Uddin, H., & Wong, A. (1998). The stock market I: The new issue market. In S. M. Simon, R. H. S. Ho, & A. W. Kie (Eds.), The Hong Kong financial system: A new age (pp. 222–243). Oxford: Oxford University Press.
- World Development Indicators. (2017). World bank. Washington, D.C.
- World Federation of Exchanges. (2017) Retrieved June 22, 2017, from http://www.world-exchanges.org.
- Zivot, E., & Andrews, D. W. K. (1992). Further evidence on the great crash, the oil-price shock, and the unit-root hypothesis. Journal of Business & Economic Statistics, 20(1), 25–44. doi:10.1198/073500102753410372