
 ?Mathematical formulae have been encoded as MathML and are displayed in this HTML version using MathJax in order to improve their display. Uncheck the box to turn MathJax off. This feature requires Javascript. Click on a formula to zoom.
Abstract
The interrelationship between risks and bank efficiency has received much attention in banking literature for years, especially after the Asian financial crisis in 1997 and the global financial crisis (GFC) in 2008. This study collected and analyzed the data of 247 banks of 12 developed and developing economies in East Asia and Pacific area over the 2003–2012 period to find the empirical evidence for that relationships. Using a stochastic frontier approach (SFA) to estimate bank cost efficiency, we found that there are significant relationships among risks, cost efficiency and environmental factors, but they are in different levels when comparing between developed and developing economies, or between the periods of pre- and post-2008 financial crisis.
PUBLIC INTEREST STATEMENT
Are people usually taking risks for an expected outcome? This topic is quite popular for all the fields of the society and attracting researchers, especially research on finance and banking. Banking industry as an intermediation has found that there are significant relationships between risks they take and their financial performance. Those relations may vary from different kinds of banks, such as private or state-owned ones; different groups of economies, at developing or developed level; and also vary from time to time, especially after some special event like financial global or regional crisis. Motivated by those variations, this study tried to examine the effects of three kinds of bank risks, including credit, liquidity and operational risk, on bank performance, measured by cost efficiency in East Asia and Pacific banking industry. The study found different significant risk-efficiency relationships by economies, developing and developed countries in the mentioned region.
1. Introduction
The financial system plays an important role in modern economies, and the intermediary function of the banking industry has a core role in influencing economic growth (Klein, Citation1971; Opie & Schumpeter, Citation1934). For this reason, the efficiency of banks has long been a conventional focus at both the theoretical and empirical levels. In this context, efficiency refers to the ability of banks to generate revenue from a given number of assets and make a profit from a given source of income (EuropeanCentralBank, Citation2010). In terms of the industrial level, the effectiveness of a banking system is demonstrated by its ability to provide services and maintain the stability of the system (Ngo, Citation2012). It is essential to understand and manage the efficiency of financial intermediation, especially within banks, as improvements in efficiency can lead to increase in profitability and the number of funds intermediated, as well as suitable prices and better service for customers. This is beneficial for both the banking industry and economic development (Berger, Hunter, & Timme, Citation1993b).Footnote1
There are evidences for the relationships between efficiency and risks of banking industry around the world. For example, a study of Berger and DeYoung (Citation1997) found the negative effect of risk in cost efficiency at the banking industry level, narrowed down to the failure banks only. From another view, Fiordelisi et al. in their study in 2011 tried to have a deeper sight into this relationship by diversifying the measurements of credit risks. In general, they also found that higher risk bank led to lower efficiency, which is confirmed as “bad management hypothesis”. Provided a broader finding on the effects of several risk measure on bank performance, Sun and Chang in their study in 2011 found both negative and positive relationships among different kind of risks and bank inefficient scores.
Reviewing literature showed that much research has been conducted using the data of the banking industry throughout the world, particularly in the USA, Europe, and emerging Asian countries; however, few studies have compared the relationship between bank efficiency and risk in developing and developed countries. In addition, a study on the effects of macroeconomic factors and the effects of the economy and financial market shocks on banks’ activities is needed. The Basel Accords provide guidance for bank risk management, and the capital requirement ratio is proved to have an effect on a bank’s operation; therefore, this study added a regulation factor, capital requirement ratio in detail, as representing environmental factors. Consequently, this paper will add to the banking literature the study on the relationship between banks’ cost efficiency and risks and environmental factors, by comparing developing and developed economies in a specific geographic area.
There are still some limitations of previous studies that prevented us from having a big picture of risk and cost management around the world. First, the mentioned authors’ findings are only limited in separated groups of countries: developing or developed, there is still a lack of study that should be worked in the same data set to compare the effects between groups. In addition, according to the author’s knowledge, there are few studies related to this field conducted in East Asia and Pacific area as a specific area having representatives on both developed and developing markets. Second, because of the available data, the effects of some environmental factors as macroeconomics indicators have not been examined to the acceptable limit. Third, because of the observed period of previous studies mostly before 2009, there is no enough time to examine the effects of global financial crisis (GFC) and needs an updated research for the period of at least 5 years after 2008.
Despite the challenging external environment, the World Bank says this area, which includes all levels of economic development (underdeveloped, developing and developed), has enjoyed remarkable economic growth in the last four decades. The 1997–1998 East Asian financial crisis, which mainly affected Indonesia, Korea, Malaysia, the Philippines, and Thailand, revealed substantial vulnerabilities in the financial sector, namely, excessive borrowing, weak regulatory and supervisory frameworks, concentrated bank ownership and family control of banks. Economies in the region have made significant progress in running current account surpluses and building up large exchange reserves, as an insurance policy against crises (WorldBank, Citation2007). Several countries are experiencing rapid changes in economic development, population growth and urbanization, social transformation and technological development (WorldBank, Citation2014). The East Asia and Pacific region have been emerged as the largest recipient of the developing world capital flows. Therefore, the region’s financial markets and banking sectors play a core role in the world financial market (APFED, Citation2005).
This study aimed to examine the relationship between risks and environmental factors and bank cost efficiency, by comparing developing and developed economies in a specific geographic area. Asia and Pacific regions with 12 chosen economies are quite representative for two different levels of economics development. In specific, the sample is divided into two different groups that represent developed economies, such as Australia, Hong Kong, Japan, Korea, New Zealand and Singapore, and developing ones, such as China, Indonesia, Malaysia, the Philippines, Thailand and Vietnam. Stochastic frontier approach (SFA) was employed to estimate efficiency and to investigate the effects of credit, operational and liquidity risks and environmental factors on bank efficiency both before and after the 2008 GFC. We use the single-step estimation procedure in the analysis: measuring banks’ cost efficiency and examining the relationship between cost efficiency and risk.
Testing the relationships among three kinds of risks and bank’s cost efficiency which is estimated using SFA, we found the significant effects. Those effects examined and showed difference from groups of economies divided by the level of development. We also found that the mentioned relationships vary basing on data time divided by GFC event.
The rest of this paper proceeds with four remaining sections. Section 2 reviews literature on bank’s cost efficiency, risks and the relationships between them. Section 3 describes data and methods. Section 4 explains main results, other results and discussions on them. The last section is conclusion which summarizes the key main points and findings of the paper.
2. Literature review
2.1. Evidence on bank efficiency in East Asia and pacific region
Measuring the efficiency of a firm or a financial institution has a long history. The three most popular approaches are ratio analysis, scale and scope efficiencies, and X-efficiency. The first two methods have limitations regarding measuring and comparing bank efficiency and were recently replaced by the third approach. Two outstanding features of the X-efficiency approach are data envelopment analysis (DEA) and SFA. DEA has been applied in many studies measuring bank efficiency, but it has the disadvantage of attributing measurement errors and other noise to the efficiency scores, which can cause the inefficiency estimated to be overstated (Wezel, Citation2010). SFA overcomes this limitation and decomposes the residual of the frontier into the inefficiency and the noise using explicit assumptions about the inefficiency component’s distribution (Irsova & Havranek, Citation2011). Empirical studies on bank efficiency have been conducted using data from the banking industry around the world in both developed and developing countries. For example, studies have been conducted in Europe by Dietsch and Lozano-Vivas (Citation2000), Maudos, Pastor, Pérez & Quesada (Citation2002) and Resti (Citation1997). Other research has been conducted in Japan (Hensel, Citation2006), Australia (Shamsuddin & Xiang, Citation2010), across countries (Berger & Humphrey, Citation1997; Pasiouras, Tanna, & Zopounidis, Citation2009), and in emerging markets such as India and East Asia (Dang-Thanh, Citation2010; Gardener, Molyneux, & Nguyen-Linh, Citation2011; Kalluru & Bhat, Citation2009; Sufian, Majid, & Zulkhibri, Citation2007; Vu & Turnell, Citation2010). Most of these studies have applied two approaches to measuring bank efficiency: DEA and SFA. SFA has been dominant in recent applications because of its advantage over DEA in terms of assuming statistical noise (Sun & Chang, Citation2011).
Research on banks’ efficiency has attracted both theoretical and empirical interest, and many empirical studies have tried to identify the determinants of bank efficiency and to measure their efficiencies, in both developed and developing countries around the world. In terms of the theoretical aspect, although traditional theories of financial intermediation have been built on the models of resource allocation based on perfect and complete markets, contemporary banking theory has shown that the unresolved issues remain, through an excellent survey on the current state of banking literature by Bhattacharya and Thakor (Bhattacharya & Thakor, Citation1993; Santomero, Citation1997).
2.2. Risks and bank efficiency
Scholars and analysts have recently grouped banking risk into various categories. Santomero (Citation1997) divided risk into six types, based on the services provided by banks: systematic or market risk (interest rate risk), credit risk, counterparty risk, liquidity risk, operational risk and legal risks. Some of these groups overlap; for example, credit risk and counterparty risk are quite alike. In their book The essentials of risk management, Crouhy, Galai, and Mark (Citation2006) classified risks into eight different groups: credit risk, market risk, liquidity risk, operational risk, legal risks, strategic risk, business risk and reputation risk. This classification is quite comprehensive, although not specifically related to only banks (Crouhy et al., Citation2006). There is an agreement between two mentioned categories related to some main kinds of risks, including credit risk, market risk and operational risk. These main risks are also grouped and classified under the first “pillar” in the Basel Accords, issued by the Basel Committee on Bank SupervisionFootnote2; all other risks are defined and grouped under the second “pillar” of the Accords (Dam, Citation2010). As mentioned earlier, Cornett and Saunders (Citation2003), Financial institutions management: A risk management approach, list 10 types of risk: interest risk, market risk, credit risk, off-balance-sheet risk, technology risk, operational risk, foreign exchange risk, country or sovereign risk, liquidity risk and insolvency risk. The following paragraphs include in-depth definitions of each type of risk.
In the banking system, “credit risk” is directly related to the traditional functions of a bank and is “the risk that promised cash flow from loans and securities held by financial institutions may not be paid in full”(Cornett & Saunders, Citation2003). Throughout history, banks have managed this risk as a main part of their business. However, since the Bank for International Settlements (BIS) Accord first set out a formalized universal approach to credit banks, it has become one of the greatest concerns of scholars, analysts and empirical managers. Based on the first BIS Accord, banks were required by their regulators to set aside a flat-fixed percentage of their risk-weighted assets as regulatory capital against default (Crouhy, Galai, & Mark, Citation2000). More formally, “credit risk arises whenever a lender is exposed to loss from a borrower, counterparty, or an obligor who fails to honour their debt obligation as they have agreed or contracted” (Dam, Citation2010). In the operation of the banking industry, credit failures are not rare, and they have direct, critical effects on various aspects of a bank, such as the bank’s liquidity, cash flows, profitability and eventually, reputation, which is why credit risk management has become a hot topic of debate. As well as research on credit risk management in developed countries, such as Europe and the USA (Fiordelisi, Marques-Ibanez, & Molyneux, Citation2011; Pastor, Citation2002), this topic also has been researched by using cross-countries data (Ali and Daly, Citation2010; Berger & DeYoung, Citation1997; Bonfim, Citation2009) and in emerging-market economies (Dam, Citation2010; Godlewski, Citation2005).
Another type of risk that has recently concerned banks is operational risk. Although this kind of risk may represent a significant share of a bank’s total risk, it has only recently been added to the risk catalogue of the Basel Accord. One definition of operational risk is: “the risks that existing technology, auditing, monitoring, and other support systems may malfunction or break down” (Cornett & Saunders, Citation2003). However, operational risk is still not a well-defined concept and is not easy to measure. In the context of intermediation activities, it refers to a wide range of possible failures in the operation of the organization that are not directly related to market or credit risk. Operational risks are associated with inadequate systems, management failure, faulty controls and human errors (Crouhy et al., Citation2000).
Liquidity risk is a major risk that banks face, as debt maturity transformation is one of their key business areas. Cornett and Saunders define it as: “the risk that a sudden surge in liability withdrawals may require a financial institution to liquidate assets in a very short period of time at less than fair market prices” (Cornett & Saunders, Citation2003). This risk happens when a bank “will not be able to meet its current and future cash flow and collateral needs, both expected and unexpected, without materially affecting its daily operations or overall financial condition” (Lopez, Citation2008). In their 2013 guidance on liquidity risk management, the Basel Committee noted that a liquidity shortfall at a single institution can have system-wide repercussions and financial market developments in the past decade have increased the complexity of liquidity risk and its management (BIS, Citation2013).
The interrelationship between risk and bank efficiency has received much attention in recent years, particularly after the 1997 Asian Financial Crisis and the 2008 GFC. One of the earliest studies that focused on the effects of risk on efficiency was in 1997, by Berger and DeYoung. They employed Granger-causality techniques to test four hypotheses—the “bad management” hypothesis, the “bad luck” hypothesis, the “skimping” hypothesis and the “moral hazard” hypothesis—to show the relationship between credit risk and efficiency. Their results suggested that loan quality has both negative and positive effects on efficiency; particularly, there is a negative relationship between cost efficiency and risk in failed banks (Berger & DeYoung, Citation1997). Although Berger and DeYoung’s study was an intensive analysis of risk effects, its procedure, based on the Granger-causality test, did not cover the causes of credit risk at the individual bank level, but came to a broader result at the industry level (Pastor, Citation1999, Citation2002). To overcome the limitations of the previous studies in terms of credit risk measurement, a 2011 study by Fiordelisi et al. used diverse measures of credit risk, including non-performing loans, 1-year-ahead expected default frequency, and 5-year-ahead expected default frequency, to examine its effects on efficiency through three separate models. In addition, this study not only focused on cost and profit efficiency but also estimated revenue efficiency and conducted robustness checks with the other measures. In general, their results showed “lower bank efficiency with respect to costs and revenues Granger-causes higher bank risk, thus confirming the ‘bad management hypothesis’” (Fiordelisi et al., Citation2011).
The literature review part gives a big picture of what has been done and has not been mentioned so far in doing research on bank efficiency and risks. As in most of the research topics, research in this mentioned field has been conducted with the data across countries, such as USA, Europe and several developed Asian countries. However, research on comparing the relationship between efficiency and risks of banks in developing and developed economies is still limited.
In addition, it is proved that macroeconomic factors, policies or regulations, and also the economy and financial market shocks, have had significant impacts on banks’ activities and performance. That is why this study examined the effects of those mentioned external factors on the relationship of banks’ performance and risks and added to the literature the significant findings from that examination.
3. Data and methods
3.1. Data sources
An unbalanced panel data of banks covering the 2003–2012 period were analyzed. The financial data, such as financial statements and other financial ratios, were mostly taken from Bankscope, a comprehensive world banking information source provided by Bureau van Dijk. The data sets of the banking sectors of the 12 East Asia and Pacific economies in the study were employed, a total of 247 banks. An average of 20 banks in each economy was intended, but in the cases of New Zealand and Singapore there were less than 10 banks. To avoid a domination of any country out of 12, we start collecting bank’s financial statement data with a maximum of 50 largest banks by total assets in each country.Footnote3 As our paper focuses on commercial banks, we start by dropping central banks, investment banks, securities houses, multilateral government banks, non-banking credit institutions and specialized government financial institutions. That scope built an unbalanced panel data consisting of 2,378-year-bank observations for the 10 years from 2003 to 2012. The detail distribution of observations across economies is shown in Table .
Table 1. Unbalanced panel data descriptions
3.2. Measurement of cost efficiency
The first aim of this study was to measure the efficiency of East Asia and Pacific banking industries. In-line with Berger and Mester (Citation1997), we measure cost efficiency by how close a bank’s actual cost is to what a best practice bank’s cost would be for producing identical output under the same conditions. As discussed earlier, cost efficiency can be achieved using one of two common approaches: the parametric SFA and the nonparametric DEA. While DEA is built under the assumptions that there is no random error, SFA “specifies a functional form for the cost, profit, or production relationship among inputs, outputs, and environmental factors, and allows for random error” (Berger & Humphrey, Citation1997). Indeed, SFA approach modifies the traditional assumption of a deterministic production frontier which got its advantage (Sun & Chang, Citation2011).Footnote4 Using SFA to measure efficiency scores, it, therefore, helps us to control for measurement error and other random effects and has, therefore, been widely applied to banking and other industries (Aigner, Lovell, & Schmidt, Citation1977; Berger & Mester, Citation1997; Kumbhakar & Lovell, Citation2000). Following Battese and Coelli (Citation1997) and Bonin, Hasan, and Wachtel (Citation2005), we conduct the stochastic frontier estimation using a translog specification of cost function to obtain efficiency scores across countries, based on the assumption that efficiency differences among banking industries are determined by country-specific characteristics.Footnote5 The cost model can be written in its general form as follows:
where is total costs of bank i at time t and
is the cost frontier. In this model, bank efficiency is measured in relation to a global best practice frontier. In Equation (1),
represents the logarithm of the output of bank i at time t,
is a vector of the logarithms of the input prices of bank i at time t,
captures cost inefficiency and is independent and identically distributed with a truncated normal distribution. Hence, the total costs a bank faces are never lower than the costs of the frontier (see Berger, Hancock, & Humphrey, Citation1993a for a graphical representation of the frontier and its dynamics),
captures measurement error, and random effects are distributed as a standard normal variable. Both
and
are represented in Equation (2) as time and bank specific. It is also crucial to note that Equation (3) models inefficiency and its explanatory variables, where z is the vector of n variables that drive the inefficiency of bank i at time t. The deltas represent the coefficients. Equations (1) and (3) are solved in one step using maximum likelihood estimation in which detailed descriptions of SFA are provided in the Appendix.
The cost (in)efficiency scores of individual banks, , estimated from the SFA would take a value between one and infinity. However, to make our results comparable, we follow the methodology used by Pasiouras et al. (Citation2009) to generate the index of cost efficiency as follows:
. Thus, our dependent variable,
, denotes efficiency score ranges between 0 and 1 with values closer to 1 indicating a higher level of bank efficiency. To examine the effects of risks on (in)efficiency while controlling for other bank- and country-specific characteristics,
in Equation (3) is specified in terms of
in the Equation (4).
All of the variable measurements of this estimation, including total interest expenses, total non-interest expenses, total assets, total fixed assets, total short-term deposits, total long-term deposits, total loans, other earning assets and liquid assets, were available from the financial statements of sample banks, on the Bankscope database. Table shows the definitions of all variables used in estimating cost efficiency.
Table 2. Variable definitions for estimating cost efficiency
The descriptive statistics of all variables are provided in Table . Some of the main indicators shown in Table indicate the “big picture” of the East Asia and Pacific banking sector. It is clear that there is a large gap between the banks of developed and developing economies; the mean of developed banks’ total assets is almost double the size of the mean for developing banks.
Table 3. Sample descriptive statistics of variables used in estimating cost efficiency (2003–2012)
3.3. Basic model
The following equation is used to estimate the relationships among three kinds of risks and efficiency:
where COSTEFFi,c,t is the cost-efficiency scores of bank i in country c in time t. The variable Bank Risks serve as a proxy for types of bank risk, including credit risk, liquidity risk and operational risk. In-line with Sun and Chang (Citation2011), we measure credit risk by capturing the ratio of loan loss reserves over gross loans (LLRGL), which is used to capture output quality and how the manager invests in highly risky assets. Similarly, a set of two variables is used for accounting operational risk: the ratio of equity and total assets (ETA) and return on asset volatility (ROAV). In particular, the role of ETA is to capture financial distress and the probability of bankruptcy; ROAV is an accounting-based volatility indicator calculated by a logged 3-year standard deviation of ROA. The equity to asset ratio measures the equity position of a bank as a fraction of total assets. The ratio of cash and due from banks to total assets (CDTA) is used to measure liquidity risk (Altunbas, Liu, Molyneux, & Seth, Citation2000). The year and country effects are also considered and measured with year and country dummy variables.
We also employ six control variables, with two at bank level and four at banking industry and country levels. At the bank level (Bank Controls), log of TOTALASSET and TOTALDEPOSIT plays the role of bank size indicators, used to control banking scale (Bauer, Berger, Ferrier, & Humphrey, Citation1998; Berger, Hasan, & Zhou, Citation2009; Westman, Citation2011). Bank Regulation Control represents for key bank regulations stressed by the Basel Committee. Following Laeven and Levine (Citation2009) and Barth, Caprio, and Levine (Citation2013), we control bank regulatory by capital ratio requirement (REGULATION) on bank activities. Furthermore, Macro Controls are the vector of macroeconomic controls including economic growth (GDP) and inflation (CPI). To compare the different effects of bank risk on efficiency before and after GFC, we also employ a dummy variable (YCRISIS) that takes a value of one for the years 2008–2012 and zero otherwise. Moreover, following Sun and Chang (Citation2011), two instrument variables for testing endogenous problem are used: Total Equity (EQUITY) and the ratio of liquid assets to total liabilities (LIQUIRATIO). Table lists all the variable definitions of the testing process.
Table 4. Variable definitions for testing the relationships between bank cost efficiency and risks
Table shows the statistics summaries of all of the variables. The statistics measurements of risks between groups of economies show that the means of the ratios of developing economies were much higher than the other group. Although a firm conclusion cannot be drawn from that data, it seems that the developing banking systems, with a mean ratio of ETA of around 10%, were operating more safely than the developed systems (7%). However, the ROAV in developing banking systems was double that of developed banking systems, indicating a highly volatile operating situation. The macroeconomic indicators show that the CPI and IR of developing economies were at higher volumes than are normal for emerging markets.
Table 5. Statistics of variables used in testing the relationships between risks and cost efficiency
4. Results and discussion
4.1. Main results
4.1.1. Efficiency scores
Table reports cost efficiency of East Asia and Pacific developed and developing economies over 2003–2012 period. The overall average of efficiency scores indicates that the observed banks could have produced their outputs using 62% of their actual inputs. Although the mean of the cost-efficiency scores is at the medium level, there is a large gap in cost management between the banks in the East Asia and Pacific banking system, in which the cost-efficiency scores range widely, from a very low 0.2% up to 98%.
Table 6. Summary of cost-efficiency estimations of separated economies of East Asia & Pacific area over 2003–2012 period
The mean efficiency scores of the two groups of economies, in developing countries (i.e. China, Indonesia, Malaysia, Philippines, Thailand and Vietnam) and developed countries (i.e. Australia, New Zealand, Hong Kong, Singapore, Japan and Korea), showed a surprising result. The mean for developing countries was much higher (70%) than that of the developed countries (51%). However, this was mainly because Japan, which had around 50% of the developed group’s bank-year observations, had the worst level of cost efficiency, with mean scores of only 28% during the period 2003–2012. In fact, most of developed countries that were observed had mean efficiency scores that were equal to or higher than the overall score. Australia and New Zealand scored 82% and 86%, respectively, in-line with previous studies of developed countries (e.g. the USA, Germany, France, Italy and Spain), which also found average efficiency scores of around 80% (Berger & DeYoung, Citation1997; Pastor, Citation2002).
In the developing countries group, the two countries with the lowest efficiency (the Philippines and Thailand) scored around the average level, at about 60%. The efficiency scores of other countries in this group ranged from 72% (Malaysia) to 86% (Vietnam), leading to a group average of 70%. In a previous study on 12 transition economies in Central and Eastern Europe during the period 1993–2000, Yildirim and Philippatos measured bank cost efficiencies using both SFA and DEA. Their SFA results had an average score that was higher than the mean for our research, at around 77%. This score means about one-quarter of bank resources are wasted during the provision of banking services in transition economies, on average (Yildirim & Philippatos, Citation2007). The results of our analysis are comparable with those of a previous study in Asian emerging countries by Sun and Chang (Citation2011), which were typically in the vicinity of 70%.
Table also provides a picture of cost management of each economy in terms of their cost-efficiency score. Most of sampled banking systems had a wide range of bank efficiency scores; for example, New Zealand and Vietnam. Varied ranges in cost efficiency from the minimum scores to the maximum scores of those mentioned countries are only around 10% and 20%, respectively. In the other economies in the East Asia and Pacific area, minimum efficiency scores were less than 40%, even less than 10% in the cases of Japan, Singapore, Thailand and Malaysia. However, this cannot be used to draw any conclusions about the stability of their banking systems; further examination would be required for that. According to a study of European transition economies by Yildirim and Philippatos, Poland and Spain were the most efficient countries during the period 1993–2000, at 85% and 82%, respectively, while the Russian Federation and the three Baltic States were the least efficient, at around 70%.
Table reports effects of financial crisis 2008 on cost efficiencies of separated groups of economies in East Asia and Pacific area. The means of the efficiency scores in groups of years are generally similar, at around 62%. However, the periods before and after the 2008 GFC show different trends. From 2003 to 2007, the means of the efficiency scores increased steadily from 59% to 66.5%; the scores declined after 2008, to less than 60% in 2012. It could be predicted that the GFC event would have an effect on efficiency scores and that the effects would be more marked for developed economies than for the developing group. Table 4.5 shows that the means for developed economies rose from 54% to 73.4% during the period 2003–2007; conversely, the average cost-efficiency scores of developing countries’ banking systems was quite stable, with average scores across years of 70% for both the period before and after the GFC.
Table 7. Means of cost-efficiency estimations of economies of East Asia & Pacific area across years
Figures and introduce the cost-efficiency scores of separated countries across years, divided into the two groups of developing level. These results enable a comparison of the trend in average cost-efficiency scores across countries from 2003 to 2012. The detailed data for these figures are shown in Table . Figure shows that while Australia and Singapore had consistent trends, upwards and downwards, respectively, the cost efficiency of the other countries fluctuated widely during the period 2003–2012.
Figure 1. Cost efficiency for developed East Asia and Pacific economies over the 2003–2012 period.
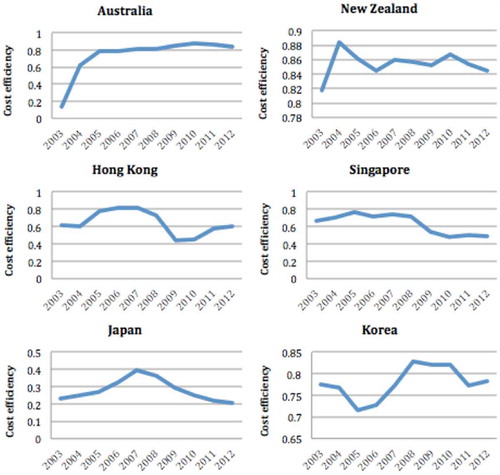
Figure 2. Cost efficiency for developed East Asia and Pacific economies over the 2003–2012 period.
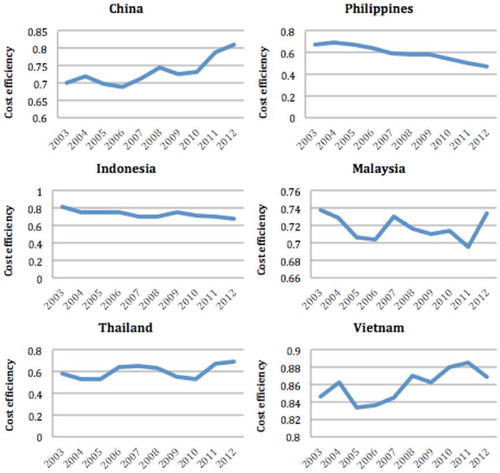
Figure indicates two different trends among the developing countries. While the average cost-efficiency scores in Indonesia and the Philippines consistently declined, the scores of other countries in this group were very volatile over years, particularly in Malaysia.
A 2011 study on cost efficiency in Asian emerging countries by Sun and Chang showed some trends that were similar to our results, but in a different period: 1998–2008. Their study included five of the countries in our sample: China, Korea, Malaysia, Philippines and Thailand. Their results confirmed our results, with China presenting consistently higher cost efficiency and Thailand and the Philippines being in the lowest group of cost management.
4.1.2. Bank cost efficiency, risks, and environmental factors
Table reports our baseline results. As a problem can arise, related to multicollinearity, if all the risk measures were put into the same model, the process of testing the relationships went through four main models: models 1–3 examined the separate effects of credit risk, operational risk and liquidity risk, and model 4 examined the combined effects of three kinds of risk on cost efficiency, estimated from the last stage of this paper, over the period 2003–2012.
Table 8. Estimation results for the effects of risks on cost efficiency of economies in East Asia and Pacific area over 2003–2012 period
Table reports estimations of the parameters from Equation (4) using cost-efficiency scores (COSTEFF) as a dependent variable. Model 1 examines credit risks measured by the ratio of LLRGL as a determinant of cost efficiency. It was found that this ratio had a significant negative effect on cost efficiency at the 5%t level, which means that a bank with a higher loan loss reverses ratio will have reduced cost efficiency. A higher ratio of loan loss reverses over gross loan would mean that a bank has a larger possibility of non-performing loans (Sun & Chang, Citation2011). The results of this study are in-line with the conclusions of most studies on credit risk effect, such as a study of eight Asian emerging countries by Sun and Chang (Citation2011) and studies of developed economies, such as the ones of the European banking system by Pastor (Citation2002) and Fiordelisi et al. (Citation2011); or of the American market, by Berger and DeYoung (Citation1997). This is a reasonable explanation for the depressing effect on cost efficiency of higher credit risk measures. The implication is that the higher loan loss reverses ratio leads to a higher cost of dealing with these non-performing loans and leads to a lower management level (Berger & DeYoung, Citation1997).
Model 2 in Table illustrates the effects of operational risk measures on bank cost efficiency. In this case, operational risk is measured by ETA ratio and ROAV. The results show that both the ETA ratio and ROAV have significant negative effects on the cost-efficiency scores. The first effect from the ETA ratio, with a negative significance at the 1%, level indicates reduced benefits for banks in this higher ratio. The implication is that a riskier bank operation tends to have a higher efficiency. This also explains why bank managers choose a higher debt ratio to reach a more efficient level of operating.
Previous studies have had inconsistent results regarding capital ratio. While Sun and Chang (Citation2011) found a similar trend to that shown in this study in the relationship between ETA ratio and cost efficiency, other studies conducted in United Arab Emirates, Poland, Turkey and Europe have come to the opposite conclusions; Havrylchyk (Citation2006) and Isik and Hassan (Citation2002), examining the Polish and Turkish banking systems respectively, found a positive relationship between two variables. In addition, both Rao (Citation2005) and Fiordelisi et al. (Citation2011) defined ETA as a capitalization risk and confirmed that well-capitalized banks have higher quality management. Their results support the Basel recommendations on bank capital adequacy as a standard of controlling operational risk and raise the issue of moral hazard in banking operations. These conflicting conclusions indicate that the ideas of safe operating, moral hazard and cost management are still controversial issues for researchers in the banking field.
With regard to the effect of ROAV, the negative relationship, at the 5% level, means that a bank with higher ROAV has an increased uncertainty in its operations and tends to be less efficient than other banks. This result is in-line with the findings of Berger & Mester (Citation1997) and Sun and Chang (Citation2011), which confirmed that poor bankers might be unfavorable as regards both cost and risk management.
Model 3 in Table shows the relationship between liquidity risk factor and bank cost efficiency. The result indicates that a bank with a lower ratio of cash and due from banks to total assets (i.e. higher liquidity risk) has a higher level of cost efficiency. It confirms the conclusion of risk taking related to ETA ratio in the previous model; that is, the safer banks in terms of liquidity risk tend to be lower in cost efficiency. It is common knowledge that the cost of liquidity is one of the highest costs in an operating bank, because banks have to pay without earning to maintain a high amount of cash and cash equivalent. A study in United Arab Emirates by Rao (Citation2005) found conflicting evidence on this relationship and concluded that a higher liquidity ratio tended to increase banks’ cost efficiency during the observed time. This raises the same issue regarding risky and efficient operations in the banking system, such as ETA ratio analysis, and requires further study.
Model 4 in Table examines the combined effects of all risk variables on cost efficiency simultaneously and provides exactly the same trends as the separate models. Thus, it can be concluded that all kinds of risks have negative effects on banks’ cost efficiency. That means a high level of risk factors in all mentioned fields, including credit, operation and liquidity, leads to a low level of cost management.
This study found that the control variables also had significant effects on cost efficiency. Interestingly, all of the control variables had the same effects on cost efficiency across all the models, indicating that multicollinearity was not a concern in this study. Another interesting finding shown in Table is that most of control variables have significant effects at the 1% or 5% level, except for GDP. The reason that GDP has no effect on bank efficiency is that it is unlike the other control variables (e.g. the banks’ assets and deposits, inflation, interest, banking system regulation, etc.), which all relate to the banking system operation at both bank and country level.
At the bank level, TOTALASSET and TOTALDEPOSIT had opposite relationships with bank cost efficiencies: TOTALASSET has a positive effect on cost efficiency; TOTALDEPOSIT has a significant negative effect at the 1% level. This could imply that banks that are bigger in terms of total assets are more efficient in cost management. However, banks that are bigger in terms of total deposits tend to have lower cost efficiency because they deal with a high liquidity ratio and face a high pressure of paying interest expenses. This is additional evidence for the effect of liquidity risk on cost efficiency, as previously mentioned.
At the country level, most of the control variables (except for GDP) have a positive relationship with bank efficiency in terms of cost management. It is difficult to explain this situation when high inflation (represented by CPI) and high IR are reputed to be bad indicators of the economy, especially of the banking sectors. In addition, the ratio of capital requirement (represented by REGULATION) is one of the factors that limit the operation and income of banks. The most reasonable explanation is the intermediary role of banks in the economy. Banks run their business on trading money and the above macroeconomic factors provide materials for their business. This implies that higher ratios of inflation, interest and capital requirements help the banks to get more jobs, earn more income with the same expenses, and then push the cost efficiency upwards. This study’s analysis of the environmental variables contributes to the literature on the banking system, with the confirmation of more determinants of bank performance.
Table provides the results of testing the relationships between three kinds of risks and bank cost efficiency across the 12 studied economies in the East Asia and Pacific area. The analysis shows large differences in the relationships. With regard to the effect of credit risk, while there are the negative coefficients in most of economies, Thai banking industry shows a totally different result with positive and significant coefficient on LLRGL (at the 5% level), indicating that a higher credit risk in Thai banks could lead to higher efficiency. Notably, we find the similar trend for Indonesian banks in which the relationship between cost efficiency and operational risk measured by ETA coefficient is positive and statistically significant. For liquidity risk, we find two representatives for this opposite direction which have positive significance at the 5% level, they are New Zealand and Hong Kong. The implication in most of cases that have negative relationship is a bank with high deposit intending to be lower efficient in terms of cost management. This means that these relationships were affected by the context of each economy and, therefore, require further examination to allow comparisons between the countries.
Table 9. Estimation results for the effects of risks on cost efficiency across economies in East Asia and Pacific area
4.2. Further analysis for different groups of economies and different periods
The results in Table provide further detail about the differences in cost management and risk relations between the two groups of economies in terms of their development level. The results of the four models in the previous section were analyzed, but only the combined models (4a and 4b) are discussed here. For the four measurements of risk (LLRGL, ETA, ROAV and CDTA), the same negative effects were found in both groups of economies. These effects were consistent with the analysis of the full sample in the previous section, which conformed that there were strong relationships between credit risk and operation risk, measured by ETA, whether in a developing or developed banking system. This implies that controlling these risks has a role in managing cost efficiency at all levels of economic development. However, while ROAV and CDTA were still significant factors in developing economies, at the 1% level, they seemed to have no effect on cost efficiency in developed countries.
Table 10. Estimation results for the effects of risks on cost efficiency divided by developing and developed economies in East Asia and Pacific area
We now examine the impact of the 2008 GFC on the relation between cost efficiency and risks of separated group of economies in East Asia and Pacific area. Table provides the results of the examination of the full sample, for both developed and developing economies, divided into two periods: pre-crisis and post-crisis. With regard to the full sample, only the effects of LLRGL and ROAV changed from significant in the pre-crisis period to insignificant in the post-crisis period. This could imply that the way banks dealt with the GFC affected their level of cost and risk management and changed these relationships. Further research would be required to confirm this theory. This also applies when dividing the full sample into the two groups of economies. In particular, developed groups seemed to be much more affected by the GFC than the developing group. While LLRGL and CDTA both lost their relationship of significance when changing from before to after the financial crisis, ROAV had a significant effect on cost efficiency for the whole 2008–2012 period. ROAV was also the only risk factor with a changed relationship in both the developed group and developing group.
Table 11. Estimation results for the effects of risks on cost efficiency of economies in East Asia and Pacific area for the pre- and post-global financial crisis 2008
4.3. Robustness test: testing for endogeneity
To alleviate the potential dynamic endogeneity inherent in the bank risks–efficiency relationship, we carry out the Durbin–Wu–Hausman test (Davidson & MacKinnon, Citation1993) as our robustness check. According to Sun and Chang (Citation2011), since both risk-taking behavior and efficiency are simultaneously determined in a banking system in which efficient goal is a component, changes in risk behavior should not be systematically related to changes in bank efficiency. If bank risk variables are endogenously determined, the regression model may be mis-specified. In other words, bank risks should be unrelated to financial performance in terms of cost efficiency in the presence of endogeneity sourced from simultaneity and unobserved heterogeneity (Sun & Chang, Citation2011). The Durbin–Wu–Hausman test is performed to justify the use of the two-stage least squares method (2SLS). First, a “suspicious” endogenous variable (e.g. LLRGL, ETA, ROAV, CDTA) is regressed against all the exogenous variables and instrumental variables and the residuals (i.e., LLRGL_res) are saved. The two selected instrumental variables are total equity (EQUITY) and ratio of liquid assets to total liabilities (LIQUIDRATIO).Footnote6 For example, the equation for examining the endogeneity of LLRGL is specified as follows:
Second, the residuals of the endogenous variable (LLRGL_res) obtained from first stage are added as an additional independent variable in the following equation:
If the coefficient of LLRGL_res is statistically significant, the regression result obtained from Equation (4) will be inconsistent and biased. Therefore, 2SLS is justified and should be applied to SFA. As shown in Table , the DWH test results show that coefficients of residuals of bank risk variables are not statistically significant, suggesting that all risk type variables are exogenous and thus endogeneity is unlikely to be a problem.
Table 12. Results of testing for endogeneity
5. Conclusion
This study adds to the banking literature a research on risks and environmental factors in the relationships with bank cost efficiency through the view of comparisons between developing and developed economies in a specific geographic area. We collected an unbalanced panel data of 247 banks in 12 developed and developing economies in East Asia and Pacific region, including Australia, Hong Kong, Japan, Korea, New Zealand, Singapore; and China, Indonesia, Malaysia, Philippines, Thailand, Vietnam, during the period of 2003–2012. We employed SFA to estimate efficiency and to examine the effects of credit, operational, liquidity risk and environmental factors on bank efficiency over the period both pre- and post-global financial crisis in 2008.
First, we found that the overall average of efficiency scores indicate that the observed banks could have produced their outputs using 62% of their actually spent inputs. It is not a high score in comparison with previous studies on the area having the same level of development. We also have a surprising result when comparing scores between groups of economies when efficiency scores’ mean of developing countries is much higher than developed countries’ one, even 20% higher. In detail, mean of developing countries is around 70% in comparison with only 51% of the other group.
Second, we found the significant negative effects of three kinds of risk, including credit risk, operation risk and liquidity risk, on banks efficiency. However, there are different levels of the significant effects among developed and developing economies. The finding also confirms that the environmental factors have significant effect on banking system when most of control variables have significant effects at 1% or 5% level, but GDP. We also found that there are the different effects of risks on bank cost efficiency between developing and developed economies, and between period pre- and post-GFC.
With regard to the environmental factors studied, there was evidence that most of the control variables relating to the economic environment, such as inflation, market interest rate and capital requirement, have positive significant effects on banks’ cost efficiency. The analysis of the environmental variables that was conducted in this study contributes to the literature, with the confirmation of more determinants of bank performance. It also indicates that policy makers need to ensure that their countries’ economies are in a mature and stable situation, to boost the level of efficiency of the commercial banks. This is crucial, because the banking industry serves as the main channel for monetary policy transmission in the developing countries.
There were some limitations in this study that give rise to further research opportunities in this field. First, this study applied only SFA to estimate efficiency scores. An alternative approach could employ DEA to estimate efficiency or apply both SFA and DEA to the same data set to achieve a compared result and a deeper finding in measuring cost efficiency. Second, when measuring banks efficiency functions, there are three points of view that can affect the efficiency scores: cost efficiency (selected for this study), profit efficiency and production efficiency. Future study applying all three functions in estimating efficiency scores for the same data set would achieve deeper findings and stronger recommendations for both bankers and regulators. Although 12 observed economies in the East Asia and Pacific area is a large enough sample to have representatives in all levels of economic development, a future study with the same methodology could expand its sample to regions throughout the world, thus providing a “big picture” in the field of efficiency and risk, as well as an overview of the world’s banking systems, especially for the 5 years since the 2008 GFC
Additional information
Funding
Notes on contributors
Thu Phan
Dr Thu Phan has been working as a lecturer in Finance and Banking at Da Lat University since 2000. She had completed her doctoral degree under the supervision of Professor Kevin Daly, School of Business, Western Sydney University.
Kevin Daly
Professor Kevin Daly’s research passion revolves around applied finance and open economy macroeconomics, researching the effects of financial volatility on real economic activity. His current research interests focus on banking in China and Vietnam, foreign direct investment in China and Vietnam and financial volatility of stock markets in South East Asia.
Anh-Tuan Doan
Dr Anh-Tuan Doan, also a lecturer of Da Lat University, specialized in corporate governance, financial economics, bank efficiency and financial institutions management.
Notes
1. Corresponding author: Phan Thi Minh Thu, Faculty of Economics and Business Administration, Dalat University, 1 Phu Dong Thien Vuong, Dalat, Lamdong, Vietnam. Email: [email protected].
2. These are explained further in the next section.
3. The highest number of selected banks was in Japan, with 50 banks.
4. SFA—sometimes also referred to as the econometric frontier approach—employs a composed error model in which inefficiencies are assumed to follow an asymmetric distribution, usually the half-normal, while random errors follow a symmetric distribution, usually the standard normal (Berger & Humphrey, Citation1997).
5. We follow recent cross-country studies (e.g. Doan, Lin, & Doong, Citation2018; Lin, Doan, & Doong, Citation2016) that account for differences arising from country-specific aspects of regulatory conditions, financial freedom, credit information and other macroeconomic conditions by including the indicators of these environmental factors in a more comprehensive definition of a common frontier.
6. The instrumental variables are inspired by Sun and Chang (Citation2011).
References
- Aigner, D., Lovell, C., & Schmidt, P. (1977). Formulation and estimation of stochastic frontier production function models. Journal of Econometrics, 6, 21–37. doi:10.1016/0304-4076(77)90052-5
- Ali, A., & Daly, K. (2010). Macroeconomic determinants of credit risk: Recent evidence from a cross country study. International Review of Financial Analysis, 19, 165–171. doi:10.1016/j.irfa.2010.03.001
- Allen, F., & Santomero, A. M. (1997). The theory of financial intermediation. Journal of Banking & Finance, 21, 1461–1485. doi:10.1016/S0378-4266(97)00032-0
- Altunbas, Y., Liu, M. H., Molyneux, P., & Seth, R. (2000). Efficiency and risk in Japanese banking. Journal of Banking & Finance, 24, 1605–1628. doi:10.1016/S0378-4266(99)00095-3
- APFED 2005. Asia-Pacific Forum for Environment and Development Final report.
- Barth, J. R., Caprio, G., & Levine, R. (2013). Bank regulation and supervision in 180 countries from 1999 to 2011. Journal of Financial Economic Policy, 5, 111–219. doi:10.1108/17576381311329661
- Battese, G. E., & Coelli, T. J. (1997). Special issue: Papers presented at the New England conference on efficiency and productivity - guest editors’ introduction. Journal of Productivity Analysis, 8, 323–324. doi:10.1023/A:1007795120235
- Bauer, P. W., Berger, A. N., Ferrier, G. D., & Humphrey, D. B. (1998). Consistency conditions for regulatory analysis of financial institutions: A comparison of frontier efficiency methods. Journal of Economics and Business, 50, 85–114. doi:10.1016/S0148-6195(97)00072-6
- Berger, A. N., & DeYoung, R. (1997). Problem loans and cost efficiency in commercial banks. Journal of Banking & Finance, 21, 849–870. doi:10.1016/S0378-4266(97)00003-4
- Berger, A. N., Hancock, D., & Humphrey, D. B. (1993a). Bank efficiency derived from the profit function. Journal of Banking & Finance, 17, 317–347. doi:10.1016/0378-4266(93)90035-C
- Berger, A. N., Hasan, I., & Zhou, M. M. (2009). Bank ownership and efficiency in China: What will happen in the world’s largest nation? Journal of Banking & Finance, 33, 113–130. doi:10.1016/j.jbankfin.2007.05.016
- Berger, A. N., & Humphrey, D. B. (1997). Efficiency of financial institutions: International survey and directions for future research. European Journal of Operational Research, 98, 175–212. doi:10.1016/S0377-2217(96)00342-6
- Berger, A. N., Hunter, W. C., & Timme, S. G. (1993b). The efficiency of financial institutions: A review and preview of research past, present and future. Journal of Banking & Finance, 17, 221–249. doi:10.1016/0378-4266(93)90030-H
- Berger, A. N., & Mester, L. J. (1997). Inside the black box: What explains differences in the efficiencies of financial institutions? Journal of Banking & Finance, 21, 895–947. doi:10.1016/S0378-4266(97)00010-1
- Bhattacharya, S., & Thakor, A. V. (1993). Contemporary banking theory. Journal of Financial Intermediation, 3, 2–50. doi:10.1006/jfin.1993.1001
- BIS. (2013). A brief history of the Basel committee. Bank for International Settlements. Retrieved from http://www.bis.org/bcbs/history.pdf
- Bonfim, D. (2009). Credit risk drivers: Evaluating the contribution of firm level information and of macroeconomic dynamics. Journal of Banking & Finance, 33, 281–299. doi:10.1016/j.jbankfin.2008.08.006
- Bonin, J. P., Hasan, I., & Wachtel, P. (2005). Bank performance, efficiency and ownership in transition countries. Journal of Banking & Finance, 29, 31–53. doi:10.1016/j.jbankfin.2004.06.015
- Cornett, M. M., & Saunders, A. (2003). Financial institutions management: A risk management approach. McGraw-Hill/Irwin.
- Crouhy, M., Galai, D., & Mark, R. (2000). Risk management. McGraw Hill.
- Crouhy, M., Galai, D., & Mark, R. (2006). The essentials of risk management (Vol. 1). New York: McGraw-Hill.
- Dam, D. L. 2010. Evaluation of Credit Risk Management Policies and Practices in a Vietnamese Joint-Stock Commercial Bank’s Transaction Office.
- Dang-Thanh, N. 2010. Effectiveness of the Global Banking System in 2010–A Data Envelopment Analysis Approach.
- Davidson, R., & MacKinnon, J. G. 1993. Estimation and inference in econometrics. OUP Catalogue.
- Dietsch, M., & Lozano-Vivas, A. (2000). How the environment determines banking efficiency: A comparison between French and Spanish industries. Journal of Banking & Finance, 24(6), 985-1004.
- Doan, A.-T., Lin, K.-L., & Doong, S.-C. (2018). What drives bank efficiency? The interaction of bank income diversification and ownership. International Review of Economics & Finance, 55, 203–219. doi:10.1016/j.iref.2017.07.019
- EuropeanCentralBank 2010. Beyond RoE - How to measure bank performance.
- Fiordelisi, F., Marques-Ibanez, D., & Molyneux, P. (2011). Efficiency and risk in European banking. Journal of Banking & Finance, 35, 1315–1326. doi:10.1016/j.jbankfin.2010.10.005
- Gardener, E., Molyneux, P., & Nguyen-Linh, H. (2011). Determinants of efficiency in South East Asian banking. The Service Industries Journal, 31, 2693–2719. doi:10.1080/02642069.2010.512659
- Godlewski, C. J. (2005). Bank capital and credit risk taking in emerging market economies. Journal Bank Regulations, 6, 128–145. doi:10.1057/palgrave.jbr.2340187
- Havrylchyk, O. (2006). Efficiency of the polish banking industry: Foreign versus domestic banks. Journal of Banking & Finance, 30, 1975–1996. doi:10.1016/j.jbankfin.2005.07.009
- Hensel, N. D. (2006). Cost-efficiencies, profitability, and strategic behavior: Evidence from Japanese commercial banks. International Journal of Managerial Finance, 2, 49. doi:10.1108/17439130610646162
- International Monetary Fund. (2012). World economic outlook (WEO): Coping with high debt and sluggish growth. Washington, D.C.: Author.
- Irsova, Z., & Havranek, T. (2011). Bank efficiency in transitional countries: sensitivity to stochastic frontier design. Transition Studies Review, 18, 230–270. doi:10.1007/s11300-011-0197-z
- Isik, I., & Hassan, M. K. (2002). Technical, scale and allocative efficiencies of Turkish banking industry. Journal of Banking & Finance, 26, 719–766. doi:10.1016/S0378-4266(01)00167-4
- Jiang, C. X., Yao, S. J., & Feng, G. F. (2013). Bank ownership, privatization, and performance: Evidence from a transition country. Journal of Banking & Finance, 37, 3364–3372. doi:10.1016/j.jbankfin.2013.05.009
- Kalluru, S. R., & Bhat, S. K. (2009). Determinants of cost efficiency of commercial banks in India. IUP Journal of Bank Management, 8, 32–50.
- Klein, M. A. (1971). A theory of the banking firm. Journal of Money, Credit and Banking, 3, 205–218. doi:10.2307/1991279
- Kumbhakar, S., & Lovell, C. K. (2000). Stochastic production frontier. Cambridge University Press.
- Laeven, L., & Levine, R. (2009). Bank governance, regulation and risk taking. Journal of Financial Economics, 93, 259–275. doi:10.1016/j.jfineco.2008.09.003
- Lin, K. L., Doan, A. T., & Doong, S. C. (2016). Changes in ownership structure and bank efficiency in Asian developing countries: The role of financial freedom. International Review of Economics & Finance, 43, 19–34. doi:10.1016/j.iref.2015.10.029
- Lopez, J. A. (2008). What is liquidity risk? FRBSF Economic Letter (Oct 24).
- Maudos, J. N., Pastor, J. M., PÈrez, F., & Quesada, J. (2002). Cost and profit efficiency in European banks. Journal of International Financial Markets, Institutions and Money, 12(1), 33–58.
- Ngo, D. T. (2012). Measuring the performance of the banking system case of Vietnam (1990-2010). Journal of Applied Finance & Banking, 2, 289–312.
- Opie, R., & Schumpeter, J. A. (1934). The theory of economic development: An inquiry into profits, capital, credit, interest, and the business cycle. Cambridge, MA: Harvard University Press.
- Pasiouras, F., Tanna, S., & Zopounidis, C. (2009). The impact of banking regulations on banks’ cost and profit efficiency: Cross-country evidence. International Review of Financial Analysis, 18, 294–302. doi:10.1016/j.irfa.2009.07.003
- Pastor, J. M. (1999). Efficiency and risk management in Spanish banking: A method to decompose risk. Applied Financial Economics, 9, 371–384. doi:10.1080/096031099332267
- Pastor, J. M. (2002). Credit risk and efficiency in the European banking system: A three-stage analysis. Applied Financial Economics, 12, 895–911. doi:10.1080/09603100110065873
- Rao, A. (2005). Cost frontier efficiency and risk-return analysis in an emerging market. International Review of Financial Analysis, 14, 283–303. doi:10.1016/j.irfa.2004.10.006
- Resti, A. (1997). Evaluating the cost-efficiency of the Italian banking system: What can be learned from the joint application of parametric and non-parametric techniques. Journal of Banking & Finance, 21(2), 221-250.
- Santomero, A. M. (1997). Commercial bank risk management: An analysis of the process. Journal of Financial Services Research, 12(2), 83–115.
- Shamsuddin, A., & Xiang, D. 2010. Does bank efficiency matter? Market value relevance of bank efficiency in Australia. SSRN eLibrary. doi:10.2139/ssrn.1460378
- Sufian, F., Majid, M. Z. A., & Zulkhibri, M. (2007). X-efficiency and share prices in the Singaporean banking sector: A DEA window analysis approach. Investment Management and Financial Institutions, 4, 73–90.
- Sun, L., & Chang, T. P. (2011). A comprehensive analysis of the effects of risk measures on bank efficiency: Evidence from emerging Asian countries. Journal of Banking & Finance, 35, 1727–1735. doi:10.1016/j.jbankfin.2010.11.017
- van den Broeck, J., Koop, G., Osiewalski, J., & Steel, M. F.(1994). Stochastic frontier models: A Bayesian perspective. Journal of Econometrics, 61(2), 273–303. doi:10.1016/0304-4076(94)90087-6
- Vu, H. T., & Turnell, S. (2010). Cost efficiency of the banking sector in Vietnam: A Bayesian stochastic frontier approach with regularity constraints. Asian Economic Journal, 24, 115–139. doi:10.1111/j.1467-8381.2010.02035.x
- Westman, H. (2011). The impact of management and board ownership on profitability in banks with different strategies. Journal of Banking & Finance, 35, 3300–3318. doi:10.1016/j.jbankfin.2011.05.013
- Wezel, T. 2010. Bank efficiency amid foreign entry: Evidence from the central American region. IMF Working Paper No. 10/95. doi:10.5089/9781451982725.001
- WorldBank 2007. 10 years after the Asian crisis.
- WorldBank. 2014. East Asia pacific overview [Online]. Retrieved July 15, 2014, from http://www.worldbank.org/en/region/eap/overview
- Yildirim, H. S., & Philippatos, G. C. (2007). Efficiency of banks: Recent evidence from the transition economies of Europe, 1993–2000. European Journal of Finance, 13, 123–143. doi:10.1080/13518470600763687
Appendix
Let us estimate efficiency levels by specifying the common translog functional form, which results in the following empirical cost frontier:
where TOTALCOST is the bank’s total costs in a given year; Yr are outputs; Pi are input prices; and and
are the parameters to be estimated. The translog cost function is estimated using
as a composite error term. Using the same procedure employed by Jiang, Yao, and Feng (Citation2013), we also normalize total costs and output variables by total assets to control for scale biases and heteroskedasticity.
We use the intermediation approach to classify the outputs and input prices of the banking industry. Regarding the intermediation approach, banks are considered financial intermediaries that take deposits from savers and make loans to economic agents who require capital (Allen & Santomero, Citation1997). Following Bonin et al. (Citation2005) and Berger et al. (Citation2009), we choose the following four outputs: total loans (TOTALLOAN), other earning assets (OEASSET), total deposits (TOTALDEPOSIT) and liquid assets (LIQUIDASSET). Furthermore, widely consistent with previous studies on bank efficiency, we use the following two input prices: the price of funds (PFUND), measured by the ratio of interest expenses to total deposits, and the price of capital (PCAPITAL), defined by the ratio of non-interest expenses to total fixed assets. The total costs of banks are calculated by the summation of total of interest expenses and non-interest expenses. We also follow Jiang et al. (Citation2013) to impose linear homogeneity restrictions by normalizing by using the price of funds.