
 ?Mathematical formulae have been encoded as MathML and are displayed in this HTML version using MathJax in order to improve their display. Uncheck the box to turn MathJax off. This feature requires Javascript. Click on a formula to zoom.
Abstract
Finnish regions increased their exports in special industries from 1999 to 2013. This internationalization of industries in regions is measured by the adjusted Balassa’s revealed comparative advantage index. It has been shown that innovation potential has not increased, even though R&D drives specialization and leads to an increase in exports and an improvement in trade balance. The growth of other intangible capital, such as organizational capital (management and marketing capital) and information and communication technology (ICT), has concentrated in the greater Helsinki area, but products and services are also targeted to domestic markets and depend on imports rather than promoting exports. The physical capital investment among the physical intensive firms has substituted imports rather than affecting exports. In a small open economy such as Finland’s, all these trends, together with foreign firms not being more export-oriented than domestic firms, call for a new industrial policy to promote R&D on a wide scale and continue regional specialization, thereby maintaining competitiveness and export growth.
Public Interest Statement
Finland is knowledge intensive economy. Research and Development (R&D) is major driver of specialization of industries and exports. The growth of other intangible capital like organizational capital (management and marketing capital) and information and communication technology (ICT) has concentrated in greater Helsinki area, but products and services are also targeted to domestic markets and depend on imports. However, public incentives to support R&D should not be targeted only to the few very R&D intensive firms, as the R&D innovations have been productive on wider scale in all industries within the 20 regions considered. In a small open economy like Finland all these trends together with foreign firms not being more export oriented than domestic firms call for new industrial policy to promote R&D at wide scale and to continue regional specialization and thereby to maintain competitiveness and export growth.
1. Introduction
The Finnish economy is small and highly open, with exports accounting for over 40% of GDP. The type of innovative activity has come to differ considerably among geographic areas as regions have specialized. The knowledge may also spill over from surrounding regions, and there are interactions between private- and public-sector Research and Development (R&D). Large firms should have a greater necessity to export, as the domestic market is small and limits growth.
This study analyzes whether the knowledge investment, as measured by a broad range of intangible capital (IC) investments, has increased and how this and other factors have affected regional exports with specialization. In EU policy, such a research question is often referred to as smart specialization, which aims to boost growth in Europe by enabling each region to identify and develop its own competitive advantages (EU, Citation2017; McCann & Ortega-Argilés, Citation2015). Smart specialization objects are not necessarily supported by Feenstra et al. (Citation1999) and Feenstra and Rose (Citation2000) suggesting that trade openness has led to higher export variety in products. However, Feenstra and Kee (Citation2007) show that the higher export variety of large countries such as China may reduce the export variety of smaller countries such as Mexico in their exports to the U.S. Small open economies or regions within countries may hence have to specialize in certain exports. Regional specialization may also increase national product variety in a small country such as Finland, where exports are otherwise concentrated in only a few industries.
Broad IC includes R&D, organizational capital (OC) and ICT, which are aggregated from firm level to Finnish Nuts III regions. Henderson, Kuncoro, and Turner (Citation1995) and Duranton and Puga (Citation2001) compared new and mature industries, showing that mature industries may benefit more from the localization externalities that were generated in more specialized cities or regions. Much of the R&D is concentrated in large and mature industries, and so smart specialization is desired. OC (management and marketing capital) and ICT-intensive firms provide their products and services in domestic and foreign markets and may instead benefit from large industry diversity available in urban areas; see Jane Jacobs (Citation1969) and Glaeser, Kallal, Scheinkman, and Schleifer (Citation1992). These Jacobs’ externalities have also led to the diversity of exports. Henderson et al. (Citation1995) also find that new (high-tech) industries entered diversified cities where Jacobs’ externalities were available.
We focus on three regions: Ostrobothnia (Pohjanmaa), Etelä-Pohjanmaa (a neighbor to Ostrobothnia) and Uusimaa. Ostrobothnia on the west coast of Finland is an example of a region with exports that rely on manufacturing, with few large MNEs responsible for a very large share of the exports. Without the five largest exporters, Ostrobothnia would be less international in exports that the neighboring region Etelä-Pohjanmaa, with its long tradition of small business and food manufacturing. Uusimaa comprises the greater Helsinki area, which is the only metropolitan region in Finland. Most market services, with the majority of ICT services, are located there. All regions thus have a potentially different composition of industries active in exports. The study is of high policy relevance. Funding from Business Finland (former National Technology Agency, Tekes) has been radically cut, so public R&D has decreased in recent years since 2009. Finnish public funding for research, development and innovation was 0.87% of GDP in 2016, down from 1.05 to 1.1% in 2006–2010. At the same time, there have been no substantial cuts in subsidies to corporations aiming to support (other) regional development. In Piekkola (Citation2018), R&D decreased by 3.9% per year in 2008–2013 in Finland, while growth was zero on average in other EU27 countries.
Knowledge may also accumulate through foreign direct investment, measured here by foreign ownership. Using OECD Trade and Competitiveness Statistics, Nadim (Citation2017) shows that in Finland as a whole, foreign value added was approximately 35% of all value added in exports in 2009. The share is approximately the same in Sweden and Denmark (see Table ). Exports by foreign MNEs also create an additional gross operating surplus through services and income flows (divided, between gross operating surplus and labor compensation; see Figure A.1). The total effect of this on domestic value added of exports is 13% in Finland and 20% in Sweden.
Figure A.2 in Nadim (Citation2017) shows exports and value-added by type of firm in Nordic countries in 2013, where value added includes indirect export flows via MNEs. An important difference when comparing Finland and Sweden is that Swedish gross exports are dominated by foreign-owned MNEs. Sweden has clearly been the focus of foreign activity, as these MNEs produce 45% of all gross exports. The respective share in Finland is 25%.
Exports are necessary to improve external trade balance and also relate to productivity growth. Growth accounting is useful for analyzing how exports relate not only to improved productivity but also directly to the knowledge capital. Structural reforms are also important and the different growth components of the regional GDP are also further divided into common growth of physical and IC and the creative destruction (CD) component driven by changes in factor input reallocation. Part of the relevant knowledge growth is specific to a certain region and shapes the innovation activities there. Foreign activity is also analyzed because foreign multinationals (MNEs) can be an important source of knowledge in addition to measurable R&D activities. Along with foreign MNEs, universities and public research institutes are also important (Feldman and Florida (Citation1994), Fritsch and Slavtchev (Citation2011), Fritsch (Citation2000), Fritsch and Slavtchev (Citation2005). Regional specialization of exports is measured with the Balassa-index by Balassa (Citation1965). Common growth in knowledge within a region is likely to lead to a more permanent increase in export specialization and export growth than that driven by CD if the latter is more temporary in character.
R&D is underrepresented in services that typically have separate plans where R&D is undertaken. This analysis follows Piekkola (Citation2016) and uses occupational information on R&D workers. IC is derived from innovation work using the Innodrive methodology from the FP7 project Innodrive in Görzig, Piekkola, and Riley (Citation2010) and Piekkola et al. (Citation2011). IC type workers with a technical education are considered to contribute to R&D. IC workers also include OC workers who perform management and marketing work and ICT workers. The data here rely on Statistics Finland corporate data of Finnish firms linked to employees’ occupational data.
This study shows that R&D activity increases both specialization in exports and export share of regional GDP. Ostrobothnia is potentially a good example of a region that can boost exports in the future, and employment in manufacturing and market services have also continued to grow after the financial crisis. However, innovation investments have been equally sluggish, as they have overall in Finland on average since 2000. The general shift to skill-intensive companies in the service sector in the greater Helsinki area (part of Uusimaa) has not improved trade balance, as these firms rely on imports.
The remainder of the paper is organized as follows. Section 2 reviews the relevant literature. Section 3 describes the data. Section 4 describes the methods for the composition of relative export and import shares and growth accounting. The RCA (Balassa)-index introduced by Balassa (Citation1965) evaluates the export shares of each industry at the Nuts III level relative to the average across Finland. Section 5 analyzes regional trade openness. Section 6 exercises growth accounting for labor productivity and GDP growth before analyzing the determinants of industry-region specific export and import shares and regional specialization in trade. Finally, Section 7 presents the study’s conclusions.
2. Literature review on exports and intangibles
Firm-level studies have found that innovation activity improves export performance, rather than vice versa (Wagner, Citation2012). Exports are closely related to imports and some intangibles, such as OC, related here to management and marketing work, and ICT, related here to ICT occupations, also rely substantially on intermediate inputs such as software and knowledge that are imported. R&D is imported for exports in a number of papers (Gourlay & Seaton, Citation2004; Harris & Li, Citation2008; Wagner, Citation2006). Innovation output indicators, such as product and/or process innovations or patents, are found to positively affect export intensity and/or the probability of firms becoming exporters (Caldera, Citation2010; Ganotakis & Love, Citation2010; Lachenmaier & Wößmann, Citation2006; Rodríguez & Rodríguez, Citation2005; Van Beveren & Vandenbussche, Citation2010). A broad set of intangibles has been studied very minimally thus far, although many researchers identify the organizational or firm-specific human and structural resources such as ICT as the largest subcategory of intangible investments (Bloom & Van Reenen, Citation2010; Piekkola, Citation2016; Van Ark et al., Citation2009).
A broad view of IC is required, especially in services. Lodefalk (Citation2014) finds that both in-house service activity and service imports in manufacturing are important for Swedish exports. Musolesi and Huiban (Citation2010) find knowledge-intensive business services to be as innovative as manufacturing in R&D and patent activity, and with a strong and positive influence on productivity. Much of the service activities require organizational and ICT capital purchased from IC-producing services, which were measured using Eurostat input-output data by Piekkola (Citation2018). Drenkovska and Redek (Citation2015) find that intellectual capital increases exports in Slovenia and not in other, more inward-oriented Balkan countries.
This paper capitalizes on these various in-house IC investments to analyze the long-term benefits and follows the methodology by Piekkola (Citation2016). IC can be expected to have important regional spillovers, and this paper integrates these benefits by analyzing export levels at the regional level. Fritsch and Slavtchev (Citation2005) analyze knowledge sources at the regional level in Germany: R&D employment, size of public research institutions by field of research (budget), amount of university external research funds from private firms, public departments, German Science Foundation (DFG), and other sources. The contributions of these knowledge sources are tested systematically at the level of German districts (Kreise). One main finding is that the quality of university research makes some contribution to regional innovation, while the mere size of the universities is unimportant. They also find indications of benefits stemming from industry diversity. Therefore, both the Marshall–Arrow–Romer and Jacobs’ externalities may play some role.
D’Agostino, Laursen, and Santangelo (Citation2013) find that high-income regions would have a comparative advantage in high-tech R&D, while emerging economies would have an advantage in medium/low R&D. Altomonte, Aquilante, Békés and Ottaviano (Citation2013), among others, show that in the long term internationalization is driven by innovations, and large and more productive firms are the primary drivers of internationalization. Lee (Citation2011), using a sample of 71 countries since 1970, shows that economies have tended to grow more rapidly when they have increasingly specialized in exporting high-technology goods as opposed to traditional or low-technology goods. In line with Kaldor’s (Citation1966) Keynesian-oriented framework, endogenous growth models also allow for the role for foreign trade in domestic growth. In those models, exports open up opportunities for increased specialization, which in turn leads to higher productivity.
3. Data
This study amends the export and smart specialization literature by including ICs in a broad sense as important determinants for innovation and export performance and specialization. In addition, manufacturing and market services are both covered. R&D, OC and ICT are determined by innovation occupations. A major advantage of this is that the various ICs do not overlap, as each occupation is by definition engaged only in one type of innovation activity. Formal survey-based R&D work overlaps with ICT activities, as statistical offices in practice often proxy database and software expenditures with related ICT and R&D work expenses. The linked employer-employee data (LEED) consist of Statistics Finland firm-level financial account data linked with employee data on incomes and occupations from 1999–2013 divided into three periods: 2000–2004, 2005–2009, and 2010–2013.Footnote1 The data encompass private-sector firms, and IC relies on the measurement of innovative jobs from the occupational data of workers with tertiary education in Finland. The full sample data cover over 80,000 firms per year in Finland and 213,030 firm-year observations for the 1995–2013 period. Employment in firms is on average between 11 and 5000 employees so that the smallest firms are dropped. Non-consolidated firm data on profits, value added, and tangible capital intensity are used.
The dataset linked with financial data is representative of manufacturing (NACE C), other production (NACE D, E) and market services (G, H, I, J, L, M, N), excluding financial services (K). Incorporating market services in the analysis is especially valuable as regards IC-producing services (J, L, M). Many technology firms in telecommunication J and business services M were initially parts of manufacturing firms. These firms are also in the industries with double the R&D per employee compared to that of manufacturing. The data include a rich set of variables that cover compensation, education, and profession. White-collar employees are salaried, whereas blue-collar workers, who comprise half of all employed workers, receive an hourly wage; however, annual earnings are used for the analysis. The employee data in the sample cover an average of 700,000 employees annually in 1999–2013.
Occupations follow the International Standard Classification of Occupations (http://www.ilo.org/public/english/bureau/stat/isco/). Piekkola (Citation2016) applies a similar method using occupational data from the Federation of Finnish Employers with a functional classification (e.g., management, research, development, computer, and marketing, combined with a skill level of at least “expert”). Most of the occupations within the top three major groups (Managers, Professionals and Technicians and Associate Professionals) using Isco08 three-digit level are assumed to be engaged in IC activities that contribute to the accumulation of knowhow within the firm. IC workers are divided into OC workers related to management and marketing, R&D workers, and ICT workers. Workers with Isco08 only available at two-digit level are switched to (i) being ICT workers in certain IC occupations if their educational field (isced2011) is computing, (ii) R&D workers to being OC workers if their education field code is Social Sciences and Business and (iii) OC workers to being R&D workers if their educational field is technical.
Not all working time, however, goes to investment activities (neither do all IC workers do innovative work). The share of IC-type work spent on producing IC is assumed to be 20% for OC workers, 35% for R&D workers and 50% for ICT. The rest of the time goes to maintaining current activities and hence should not be considered as investment. IC-type work after these shares is 16% of all three areas (OC 5.5% + R&D 7% + ICT 3.5%)
The belief is that R&D, OC and ICT work is augmented with related physical capital and intermediate inputs to create a measure of related IC investment. The proportions of labor costs, physical capital and intermediate inputs are assumed to be the same within each firm prevailing in the respective IC-producing services (J for ICT, M72 for R&D and M for OC). For example, the ratio of physical capital investment and intermediate inputs for OC work is the same as prevails in the OC-producing business services (M). The shares used follow the FP7 project Innodrive in Görzig et al. (Citation2010) and Piekkola (Citation2016), as assumed to be the case in European IC-producing industries. The factor multipliers employed account for the use of capital and intermediate inputs and are 1.76 for organizational wage expenses, 1.55 for R&D wage expenses, and 1.48 for ICT wage expenses. The combined multiplier is the product of the share of work effort devoted to IC production and the factor multiplier, which is 0.35 for OC, 1.1 for R&D and 0.7 for ICT. Intangible investment of type IC = OC, R&D, ICT is thus annual wage expenditures of type IC = OC, R&D multiplied by the respective combined multipliers. These figures are the same as in Piekkola (Citation2016) except they are twice as low for OC. The analysis uses value added that includes intangible investment in R&D, OC and ICT. These are not accounted for in the value added in balance sheet statistics because these items are evaluated here.
4. Measurement of relative export and import shares and growth accounting
The RCA (Balassa)-index obtained in RCA analysis evaluates the export shares of each industry at the Nuts-III level relative to the average across Finland. The analysis also includes persistence analysis of the competitive positions, i.e., how the export shares have changed over time. Data cover all firms in the Ostrobothnia regions (excluding microfirms) from 1995 to 2013, a sample consisting of approximately 2600 firms per year and their exports that are positive in approximately 500 firms. The methodologies used to examine the stability of trade patterns are briefly outlined here; see also Laursen (Citation2015), Dalum, Laursen, and Verspagen (Citation1999) and Cantwell (Citation1989). The RCA index is given by
where the numerator represents the percentage share of a given two-digit industry j export in region k’s total exports. The denominator represents the percentage share of sector j exports of all exports in Finland. RCA receives the value of one if the export share of industry i in region exports is the same as its share for Finland as a whole. The index is not symmetric around one because it cannot receive negative values, i.e., it ranges from zero to 1 if the region is less than other regions specialized in the given sector. RCA in regression analysis would give more weight to specialized sectors, where the value can range from 1 to infinity. Laursen (Citation2015) suggests a symmetric RCA through a transformation:
This symmetric RSCA index is used in analyzing persistence and specialization trends of RSCA using first the following regression equation across regions:
The superscript refers to time period, and
and
are coefficients where the latter measures the stability of a region’s specialization pattern over time. A high
indicates a high degree of stability, but if
is not significantly different from 1, then the export share remains unchanged.
, where
is the sample correlation coefficient between the observed outcomes and the observed predictor values, measures whether the level of specialization has gone up or down between the two periods. If
> 1, specialization has increased; if
< 1, then specialization has decreased. Development is first analyzed in 4–5-year periods since 1999 in three Nuts-III regions, Ostrobothnia, Etelä-Pohjanmaa and Uusimaa, before moving to use regressions over all 20 regions to explain specialization and export and import shares.
A growth accounting framework characterizes the existing contributions of IC to labor productivity growth; see also Piekkola (Citation2018). The GDP per employment growth is divided into its components: growth in tangible capital per employment and growth in IC per employment. These components are further divided into those driven by a common trend and the CD between firms in the regions. Labor productivity growth is thus broken down into the growth contribution of tangible capital and IC (all per employment, ), and multifactor productivity growth
(residual) (see Corrado et al. (Citation2014) for details regarding this method). The breakdowns by Diewert and Fox (Citation2010) and Hyytinen and Maliranta (Citation2013) are used to determine the internal or common growth from that driven by CD. The contribution to changes in labor productivity (value added per hours worked) of firm i in industry j and region k (subscripts j and k are suppressed here) can be broken down as follows:
is the value added in year t, including all capital investments in the industry j in region k (where subscripts j and k have been suppressed),
is the summation over tangible capital
and IC,
and
,
is the hours worked and
is the difference operator.
is the average two-period factor input income share of total value-added capital, with fixed tangible income K as the residual of firm-level factor inputs.
is the unadjusted residual that is not adjusted to fit income and physical products using a RAS method.Footnote2
is used as proxy for total productivity growth TFP after accounting for the reallocation effects in each factor input. The growth accounting applies the user cost of IC that depends on the fixed rate of return of 4% and the depreciation of IC. It should be noted that there is no clear consensus on the depreciation rate of OC and ICT in particular.Footnote3 The difference to Hyytinen and Maliranta (Citation2013) is that CD is analyzed for the aggregate factor input contribution and not for aggregate labor productivity contribution. The focus here is thus more on the supply push than demand push that increase demand for final goods.
In accordance with Diewert and Fox (Citation2010) and Hyytinen and Maliranta (Citation2013), we have
where is the average two-period industrial value of
and
is the aggregate average two-period figure
for continuing firms (C). The first term in (5) denotes the internal change in continuous firms, i.e., the productivity growth within each firm weighted by its value-added share. The term
in (5) is the CD element showing the effects that arise from regional share changes, where
is the change of variable
shares with respect to the aggregate value added.
denotes the aggregate value of the factor input in continuing firms. The third and fourth terms denote the part of CD that is explained by exiting firms (denoted by E) and entering firms (denoted by D), where
is the share of variables
,
and
in entering firms of the total value added in period t, and
is the equivalent for exiting firms.
CD is typically analyzed in the disaggregation of labor productivity growth into internal growth and changes in the market share of firms with different levels of labor productivity. Here, CD is related to different levels of factor input intensities. CD distinguishes the structural change in the region from trends that are common to all firms in the region. For example, IC-producing services, i.e., the business services industry, have become more important, and GDP has a faster growth than in other industries. CD increases aggregate IC intensity when these industries that are already IC-intensive invest even more in IC than other industries in the region.
Intangibles are divided into R&D and knowledge capital, which depends on organizational and ICT capital (OC and ICT). Analysis drops extreme firm-level values in the CD of each input.Footnote4 These components of GDP growth are then used to evaluate the development of RSCA and trade shares of value added. A priori, higher IC intensity should increase specialization and exports (as shown for R&D) but not necessarily the trade balance (as shown for OC and ICT). The latter is because OC- and ICT-intensive firms may require intermediate inputs from foreign IC-producing services. CD of IC increasing labor productivity growth is good for exports if the IC-intensive firms are able to improve their export position more than firms that are less IC-intensive in the region (which is not the case here, at least for R&D).
The panel of 35 two-digit industries in production and market services in Finnish Nuts-III areas in 2000–2013 is in the final stage used in econometric analysis. The explained variable is the log growth of Z = RSCA, , where RSCA is the adjusted Balassa index and TRADE/Y is the trade share of value added, all separately for exports and imports and their log difference. Explanatory variables include stock variables and their growth accounting CD effects. The common growth component is excluded, as for R&D it is positively correlated (0.67) with the level of R&D. Explaining variables are the tangible and intangible intensities, growth accounting variables, firm size and the share of foreign operations:
where is tangible and IC variables,
shows how these are interlinked with their CD restructuring effect on labor productivity growth,
is other controls, such as share of exports by foreign multinationals, total factor productivity growth and average firm size in regions, and
is residual at the regional level;
,
and
are the respective coefficients. Year dummies are also included to control for cyclical effects. Estimations are performed with random and fixed effects with robust standard errors.
5. IC intensity, trade openness and specialization in regions
Knowledge drives specialization and their GDP growth contributions can also be sizeable. Squicciarini and Le Mouel (Citation2012)—also as a chapter in a knowledge-based capital study OECD (Citation2013)—and results here suggest that organizational and ICT investment is about double to the approximately 2% of GDP suggested for the U.S. by Corrado, Hulten, and Sichel (Citation2005). The five largest industries cover 69% of all exports throughout the period, which are, in 2009–2013, paper and pulp (21%), computer, electronic and optimal equipment (19%), machinery (14%), chemicals, petroleum, pharmaceutical, rubber (9%) and other chemical and basic metal industries (9%). The paper and pulp industry imports a relatively small percentage: approximately 2% of all imports. The imports’ share of computer, electronic and optimal equipment on all imports decreased from 18.5% in 2000–2005 to 8% in 2010–2013, thus becoming an import industry in improving external balance. This openness has been in recent decades promoted by knowledge investment both in the currently two largest industries and in new knowledge-intensive business services, which are, however, relatively unimportant both in export and imports (Nace J, M were still less than 1% of all exports or imports in 2010–2013). Table shows summary statistics of the average annual IC investment per employment (L), such as R&D, OC, ICT, tangible capital (K) per labor (L), and the export value-added share and operating profits per labor across Nuts-III regions in Finland.
Table 1. Summary of regional IC and tangible investments per labor, export and profit shares of value added in private sector in Finland 2000–2013
Our choice of the regions Ostrobothnia, Etelä-Pohjanmaa and Uusimaa reflects the variation in IC intensities. Table above shows that in continental Finnish Nuts-III regions (excluding Ahvenmaa) R&D investment per labor (thousand € per employee) is lowest (2.7–2.8) in Etelä-Pohjanmaa and Kainuu and highest (4.8–4.9) in Uusimaa and Varsinais-Suomi in 2000–2013. OC and ICT intensity have higher variations, from low 2.2–2.3 in Kainuu and Pohjois-Karjala and up to 8.3 in Uusimaa. Ostrobothia is in the upper range in R&D investment per labor (4.7) and in OC and ICT intensity (4.3). OC and ICT intensity is highest in regions with larger cities.
Uusimaa and the Helsinki metropolitan area and other regions with larger cities such as Pirkanmaa (home to Tampere) and Varsinais-Suomi (home to Turku) have average export shares of value added from 43% in Uusimaa to above-average exports shares of 53–54% in Pirkanmaa and Varsinais-Suomi. All these regions are also intensive in R&D. The west-coast regions of Keski-Pohjanmaa and Ostrobothnia are open to international trade, with 101% and 84% export shares of value added, respectively, while Etelä-Pohjanmaa has a lower export share or 30%. Business is most profitable in Etelä-Karjala, Varsinais-Suomi and Pohjanmaa, with 16.4%, 14.7%, and 13.0% profit shares of value added, respectively. One can see that Lappi and Keski-Pohjanmaa have relatively high concentrations of export industry, while their average profitability of business is one of the lowest.
The figures above are calculated as aggregates over the region, whereas the average of firm figures is different, as shown in Table . In Ostrobothnia and Etelä-Pohjanmaa, the average firm-level export share of value-added 3% is around average in Finland (instead of the 84.3% for Ostrobothnia in Table ). Ostrobothnia is characterized by few large MNEs so that the firm average R&D per total labor is 3.4 in Table instead of 4.6 reported above. The average of firm figures also shows that R&D intensity (thousand € per employee) is approximately 3.5 in Ostrobothnia, which is 35% less than in Uusimaa (5.3) and approximately 4.7–4.9 for both regions (in Table ). Firm average OC and ICT investment per labor both in Ostrobothnia and Southern Pohjanmaa are approximately 4 and again half less (45%) than in Uusimaa (7.4).
Tables )– show the adjusted Balassa’s comparative advantage measure RCA from (1) the Ostrobothnia, Etelä-Pohjanmaa and Pohjanmaa regions in 1999–2013. RCA is analyzed in three 4–5-year periods: 2000–2004, 2005–2009, and 2010–2013. In 2010–2013, the Ostrobothnia region exported relatively more electricity (Nace D, E), electrical equipment, rubber and plastic, agricultural products and motor vehicles than did the rest of Finland. Electrical equipment (RCA 7.3) and electricity, gas, and the stem industry (RCA 6.3) are equally important in the period 2005–2009 and electrical equipment in 2000–2004. The manufacture of machinery and motor vehicles is also nearly twice as prevalent compared to that of Finland as a whole. Rubber and plastic, agricultural exports (fur industry) and electricity have been able to increase their export share noticeably from the level that prevailed 10 years earlier in 2000–2004, and electrical equipment has strengthened its position. Ostrobothnia is thus an example of a highly export-oriented region that is R&D-intensive and with fairly stable employment of approximately 79,000 employees, where employment in manufacturing and market services has not decreased since 2002, as in the Etelä-Pohjanmaa and Uusimaa regions (see later analysis of growth accounting for details).
Uusimaa includes the Helsinki metropolitan area, which explains the leading position in exports in services including IC-producing services. In manufacturing, the export share is above the national average in chemicals, petroleum, pharmacy, computers, electronic and optical equipment and other manufacturing. Exports from head office operations have been over double the national average since 2010. Uusimaa is the only region in Finland with a major metropolis, and employment increased from 700,000 in 2003 to 750,000 in 2013 (but not in the manufacturing and market services sectors considered here).
Etelä-Pohjanmaa is dominant in food product exports and in textiles, clothing, and leather and wood products, fabricated metal, other transport equipment and furniture. Agricultural production has maintained a strong position and many strong industries in Etelä-Pohjanmaa are based on active SMEs, whereas in Pohjanmaa, exports are dominated more heavily by large industries. Despite the average firm size being small, Etelä-Pohjanmaa is more specialized in exports than is Ostrobothnia. Employment was at 79,000 in 2013, almost the same as that in 2003.
Table using (3) shows that the persistence in export specialization and regional specialization in Finland’s private sector has increased during the three periods considered. The persistence in export shares in different Nuts-III regions has increased over time from 0.589 in 2000–2004 to 0.737 in 2010–2013. The coefficient divided by R2 has simultaneously increased so that regional specialization has increased at a rapid rate. It is thus clear that regions have been increasing their exports with a less dispersed set of industries. Similar trends can be observed from import shares.
Table 2. Regression on the persistence of RSCA export indices
6. Growth accounting and regression results
This section first analyzes the components of GDP growth in a growth accounting framework. The idea is to examine how CD in the supply side affects labor productivity growth before analyzing subsequently how these labor productivity components affect industry specialization and growth in exports and imports. As described in equation (5), the determining factors are growth in labor supply and labor productivity, where the latter is divided into growth in tangible capital and IC intensities (divided into R&D and organizational OC and ICT intensities). Table shows the growth accounting results separately for Finland and the Ostrobothnia, Etelä-Pohjanmaa and Uusimaa regions. Growth accounting is examined as average growth in 2000–2013, divided into the same three periods as before. The results imply that in Finland, GDP in the manufacturing and market services sectors has decreased annually by −1%, largely due to the negative annual growth of −2.9% during 2005–2009, which includes the 2008 financial crisis. Employment has decreased by −1.2% per year since the financial crisis during 2010–2013. In Ostrobothnia, annual GDP has instead grown in all periods, and with 1.6% annual GDP growth and 2.6% employment growth during the final period. Employment, on the other hand, decreased in Uusimaa and in Etelä-Pohjanmaa. Hence, in Uusimaa, the increase in overall employment of all industries by 0.9% is concentrated in sectors other than manufacturing and market services, especially in the public sector.
Table 3. Growth accounting of GDP growth in production and market services
Labor productivity growth in production and market services has been on average negative at −1.2%, including Ostrobothnia at −0.3% per year. The low or negative growth is explained by the deepest financial crisis period from 2005 to 2009, with a −3–4.3% annual decrease in Finland as a whole, as well as in all regions studied. The following columns show the main interest of breaking down labor productivity growth of tangible and IC into the common growth to all firms and to the CD of each factor input. Note that in the regional analysis, the CD refers to CD within region and not over the entire country.
Common growth in physical capital investments has been sluggish, but CD is notable and contributed to labor productivity growth approximately 3–4% annually in the regions considered. Recall that CD is positive if firms/industries invests more in the factor input, and the firm/industry is already relatively more intensive in the factor inputs than other firms/industries in the region.
Common growth in ICs was negligible in all periods. Piekkola and Åkerholm (Citation2013) found intangible CD had an increased output since 2005 in manufacturing and other private sectors, although common IC growth has been slow since 2000. Here, CD of OC and ICT intensity has been negative for all of Finland, with a −0.3% annual contribution to productivity. CD of R&D has also been negative at −0.4%. The exception is Uusimaa, where CD of ICs contributed 2.8 percentage points to regional productivity growth.
It is also of interest to consider how restructuring in the form of firm entry and exit affects export orientation. Entry and exit includes changes in ownership so that the firm that exits may enter the market the following year with no substantial change in production. It is hence better to analyze the sum of entry and exit effects, as false exits do not disturb these figures. The sum of firm entries and exits improves labor productivity by 0.2% per year and in Etelä-Pohjanmaa, with a relatively higher share of SMEs, by 0.5%-point per year. In Ostrobothnia, large firms dominate and entries and exits have relatively small effects.
The last column shows a strong negative annual total factor productivity growth of −3.9%, up to −7.3% in 2005–2009. Piekkola (Citation2018) shows that total factor productivity growth was actually positive throughout Europe from 2008 to 2013 after controlling for the negative growth contribution of intangibles. This study covers relatively more purchased ICs evaluated from intermediate inputs using Eurostat input-output data. Hence, the true decrease in total factor productivity is likely to be smaller if the negative labor productivity contribution of these external ICs had been taken into account.
The regression analysis from (6) evaluates how different components of GDP or labor productivity have transformed into changes in RSCA index. Smart specialization requires the identification of GDP growth factors that also lead to an increased specialization of exports measured using adjusted Balassa-index RSCA from (2). Analysis is performed for RSCA constructed for both exports and imports and their difference. The explanatory variables of the future one period RSCA index change includes the stocks or log level of R&D or OC and ICT and CD growth contribution to regional productivity growth of the respective intangibles. In addition to CD of physical capital and ICs, the other explanatory variables are labor productivity growth effects of new firm entries in the market and total factor productivity growth, average firm size and foreign firms’ value-added share in the region.
The Breusch and Pagan Lagrangian multiplier tests in explaining RSCA index for export or export shares show that random effects should be preferred over ordinary least squares. The Hausman test shows that fixed effects should be preferred over random effects. A high R2 within shows that within variation in regions explains most of the variation in explained variables (high R2 within relative to R2 between and relatively high intraclass correlation Rho). Table shows that changes in RCSA indices for export and import are interrelated. Changes in export industry variety also affect the industry variety of capital goods imported. Frensch and Wittich (Citation2009) do indeed find that the effect of the trade-based measure of product variety on productivity also reflects the variety of capital goods and many of which are imported intermediary goods. The final column is a rough measure of net effect, indicating whether the RSCA index effect is greater for exports or imports.
Table 4. Determinants of the regional growth of RSCA export and import indices, fixed-effect estimates
Higher tangible capital intensity increases export and import specialization as measured by RSCA. The concentration of the tangible capital investment into firms that are already intensive in physical capital (CD in supply side)—as is the case in Table —instead decreases import specialization. The common growth in R&D per labor rather than CD from Table would have led to higher export (first row) and import specialization (second row). The level of R&D and growth of R&D are correlated, inclining agglomeration benefits. Henderson et al. (Citation1995) and Duranton and Puga (Citation2001) compared new and mature industries, showing that mature industries as such may benefit more from the localization externalities that were generated in more specialized cities or regions. However, the common growth of R&D per labor in Finnish regions has been sluggish, except for the greater Helsinki area (Uusimaa in Table ).
OC- and ICT-intensive firms benefit from urban diversity and tend rather to specialize in imports. These firms provide their products and services in domestic and foreign markets so that exports diversify in large sets of industries. As seen from growth accounting, many of the R&D or OC and ICT industries that continue to invest in IC are in Uusimaa (and in the greater Helsinki region), but common growth and CD in R&D or in OC and ICT per labor is absent during the period considered. CD of OC and ICT intensity has been the highest in Uusimaa, which has supported import rather than export specialization. This again shows the necessity to be in urban areas with diversified industries. Jacobs’ externalities are available so that industries have benefitted from urban diversity and thereby also in diversity of exports; see Jane Jacobs (Citation1969) and Glaeser, Kallal, Scheinkman, and Schleifer (Citation1992). Henderson et al. (Citation1995) also find that new (high-tech) industries entered diversified cities where Jacobs’ externalities were available. High OC and ICT intensity may also correlate positively with good management, as Bloom and Van Reenen (Citation2010) find for U.S. firms. Good management is general IC that can be applied in a highly diversified set of industries.
Regions with a larger average firm size have higher export and import specialization. The importance of few large firms in Ostrobothnian exports thus explains why exports are more specialized than those in Uusimaa but less than those in Etelä-Pohjanmaa; see Table (a,b). Etelä-Pohjanmaa is exceptional because average firm size is one of the smallest (21 employees compared to 52 in Ostrobothnia and 37 in Uusimaa). At the same time, industries have specialized in exports.
One can see that net entries of new firms in the market also led to greater specialization of exports. Neffke et al. (Citation2011) analyze technological relatedness in Sweden and find that regions diversify because of the entry of industries that are technologically related. Exit effect leads to the opposite: withdrawal of industries that are technologically related to other local industries. The net effect of the entry and exit of local industries turned out to be insignificant. Analysis here shows that entry and exit effects are in general weak but tend to lead to restructuring industrial composition in ways leading to a higher specialization in exports than in imports. Lastly, a large share of foreign firms usually increases the variety of imports. The export effects remain ambiguous. Exports also concentrate to certain industries when total factor productivity grows rapidly.
It is of considerable interest to analyze the effect of the same explanatory factors for the magnitude of exports and imports and from the difference affecting trade balance shown in Table . The comparison of Tables and shows that specialization in exports and imports and their value-added share go hand in hand. Those regions that are export-oriented also tend to specialize their export from certain industries. CD in supply side by tangible capital-intensive firms lowers imports (and import specialization), but the trade balance effect remains unclear. It is seen that common growth in R&D has a positive effect on exports and imports in way that improves trade balance. CD of R&D-intensive firms within regions is unimportant, as before.
Table 5. Determinants of the regional growth of export and import shares, fixed-effect estimates
OC and ICT activity is related more to demand for imports while products are sold both for the domestic market and abroad. Therefore, the effect on trade balance is ambiguous. Thus, the knowledge-intensive firms located especially in Uusimaa do not necessarily improve the trade balance of Finland, as they are highly dependent on imports in their activity. Radzi and Md et al. (Citation2015) instead show ICT to improve exports of Malesian firms. In less developed countries, ICT and quality management help relatively more exports by solving the shortages related to the time delay and cost increment of exports. CD related to OC and ICT is unimportant for exports. In contrast to R&D, it is relatively unimportant whether these ICs accumulate unequally between OC- and ICT-incentive or other firms. Hence, the diversified nature of industries in these ICs tells us relatively little about whether or not the region is oriented toward exports.
Regions with a larger average firm size have higher export and import shares and variety, but the trade balance effect remains unclear. Fritsch and Slavtchev (Citation2011) findings in Germany indicate that regions dominated by large establishments tend to be even less efficient than regions with a lower average establishment size. In Finnish regional data, average firm size is uncorrelated to productivity growth, while increasing export propensity. As can be seen from Tables and , we find that specialization and higher export and import shares go hand in hand. R&D activity is the only one that unambiguously improves trade balance, and the growth in R&D activity should be broad rather than concentrated in some R&D-intensive firms. Another factor that improved trade specialization was to encourage the birth of new firms measured by net births and deaths. However, the effects on trade balance are insignificant.
In all estimates, negative total factor productivity is the major explanation for low or negative growth in exports and imports after the financial crisis. This outcome has had an ambiguous effect on trade balance. An increase in foreign ownership measured by the share of value added of foreign-owned companies does not affect the trade balance either. The only clear effect is foreign firms having a lower level of import specialization.
Bloom and Van Reenen (Citation2010) and Helpman, Melitz, and Stephen (Citation2004) suggest a pecking order whereby exporting firms are better managed than non-exporters. Our analysis shows that exports would have benefitted from a general trend of Finnish firms becoming more skill-intensive with higher R&D intensity, while at least at the regional level other knowledge such as OC and ICT has an ambiguous effect on exports.
7. Conclusions
This analysis shows some smart specialization whereby Finnish regions have been increasing their exports in special industries in a consistent manner. Industry variety over the exporting industries has narrowed over time. Similar trends could be observed from import shares. One simple explanation is that Finland is a small open economy that typically must specialize in exports. Thus, the concept of smart specialization promoted by the EU better adapts to a small economy and its regions: firms specialize in order to gain sufficient market share and to be competitive.
Our findings confirm earlier findings, e.g., by Piekkola (Citation2018), showing that recently IC intensity has not increased, especially among the most IC-intensive firms. A lower level of R&D has led to a decrease in exports and the worsening of trade balance. R&D stocks and growth are also correlated, indicating agglomeration effects. Despite all this, R&D growth should be broad, and increasing the common growth of R&D skills and regions that are not R&D-intensive may increasingly benefit supply-side economies. Smart specialization does not imply that innovation activities should target only a few firms, even though regions specialize in certain industries in exports. Those firms less intensive in IC appear to have higher marginal returns from knowledge, as CD of ICs did not promote exports. This is not to say that R&D and OC and ICT tend to be regional concentrates, but only that common growth of knowledge in the region is better than supporting specialized firms alone.
Physical investment has concentrated on tangible capital-intensive firms with relatively poor export performance. If the tangible capital investment growth had spread equally, leading to common growth in tangible investments, the export industry would also have benefitted from this trend. This result shows that the level of tangible investment is not a good approximation of sufficiently high levels of tangible investment activity if the reallocation effects are away from the export industry.
The regions that have promoted exports and improved their trade balance are those with larger companies relying (at least formerly) on R&D, such as Ostrobothnia, which has a high Balassa’s index for exports in electricity, electrical equipment, rubber and plastic, and certain agricultural products. These industries also have noticeably higher gross operating surpluses. The export share of valued added is double that in the Uusimaa region, which includes the metropolitan Helsinki area. GDP growth has been positive during the entire period from 2000 to 2013, and export shares have also been relatively stable during that whole period.
Ostrobothnia is potentially a good example of a region that can boost exports in the future, and employment in manufacturing and market services have also continued to grow after the financial crisis. Such a policy requires some large companies that can survive in international competition and that are IC-intensive both in terms of R&D and in OC and ICT. It is noteworthy that large firms also use subcontractors extensively so that a large share, up to 30% here, of the valued added from exports in Finland is created by these SMEs. However, innovation investments have been equally sluggish, as they have overall in Finland on average since 2000.
Many of these MNEs and other firms are foreign-owned, which as such does not push the firms to be more export-oriented. However, the presence of foreign firms has substituted imports since more is produced locally. The large number of foreign multinationals located in Sweden still appears to be one factor influencing the good economic performance that distinguishes Sweden from other Nordic countries. Finland has lower foreign ownership of exporting firms and a relatively poorer export performance.
Etelä-Pohjanmaa is dominant in food-product exports and some small business in textiles, clothing, and leather and wood products, and transport. The growth potential may be related to foreign direct investment abroad in food products rather than to exporting local products.
Uusimaa and the greater Helsinki area, as a focus of economic activity and innovation potential, have continued to grow following the 2008 financial crisis. Employment in manufacturing and market services, however, has decreased by −2.1% per year since 2003. Hence, all employment growth in Uusimaa has taken place in the public sector or in non-market services. The general shift to skill-intensive companies in the service sector in the greater Helsinki area has improved export performance and trade balance effects, although not so for firms with the highest OC and ICT per labor. Such firms appear to remain orientated to domestic market in their sales.
All these trends call for a new industrial policy to maintain competitiveness and export growth in a small open economy such as Finland’s. Increased specialization in special industries such as domestic IC-producing services, without the simultaneous broad support of the innovation activity of all firms, will not improve a country’s competitive position in international markets that boost exports.
Additional information
Funding
Notes on contributors
Hannu Piekkola
Hannu Piekkola is a professor of economics since 2017 and chairman of collegium in University of Vaasa in Finland and previously engaged in research institutes ETLA and PT. His research includes the analysis of factors for competitiveness of Finnish and European economies. He has extensive international co-operation in the field of IC and innovations, which is ongoing. International publications in referred journals are 24, of which 7 are joint with other researchers. Publications follow three overlapping thematic phases in his research career: taxation especially capital income and finance (1987–1995), labor market, R&D, productivity growth and performance-based pay (1995–2007) and his ongoing research on analyzing innovative activity using extensively community innovation survey CIS data with linked employer-employee data and IC (2007–). International networking and projects include INNODRIVE (FP7) (coordinator), AGIR (FP5), AHEAD (FP6), AIM (FP6) projects in Enepri network (www.enepri.org) and ActivAge (FP5) project.
Notes
1. The deep recession, with an 8% decrease in GDP in 2009, is also explained by collapses in the manufacturing of electronic equipment (mobile phone sales by Nokia) and the paper and pulp industry.
2. The RAS method is an iterative method of biproportional adjustment of input-output rows and columns; see UN Handbook, “Handbook of Input–Output Table Compilation and Analysis”, Studies in methods series F (New York: United Nations, Citation1999).
3. Depreciation rates are here 15% for R&D, 20–25% for OC (higher for services) and 33% for ICT.
4. For firms with an average of less than 1400 workers, firm observations i outside 5% and 95% distribution of the CD contributions are dropped. Additionally, firm i contributions that have a greater effect than 5% on total CD contribution of OC and ICT are dropped.
References
- Altomonte, C., Aquilante, T., Békés, G., & Ottaviano, G. I. (2013). Internationalization and innovation of firms: Evidence and policy. Economic Policy, 28(76), 663–700.
- Balassa, B. (1965). Tariff protection in industrial countries: An evaluation. Journal of Political Economy, 73(6), 573–594. doi:10.1086/259085
- Bloom, N., & Van Reenen, J. (2010). Why do management practices differ across firms and countries? The Journal of Economic Perspectives, 24(1), 203–224. doi:10.1257/jep.24.1.203
- Caldera, A. (2010). Innovation and exporting: Evidence from Spanish manufacturing firms. Review of World Economics, 146(4), 657–689. doi:10.1007/s10290-010-0065-7
- Cantwell, J. (1989). Technological innovation and multinational corporations. Cambridge, MA: B. Blackwell.
- Corrado, C., Hulten, C., & Sichel, D. (2005). Measuring capital and technology: An expanded framework. In C. Corrado, J. Haltiwanger, & D. Sichel (Eds.), Measuring capital in the new economy (pp. 11–46). Chicaco, IL: University of Chicago Press.
- Corrado, C., et al. (2014). Intangibles and industry productivity growth: Evidence from the EU. Retrieved from: www.intan-invest.net.
- D’Agostino, L. M., Laursen, K., & Santangelo, G. D. (2013). The impact of R&D offshoring on the home knowledge production of OECD investing regions. Journal of Economic Geography, 13(1), 145–175. doi:10.1093/jeg/lbs012
- Dalum, B., Laursen, K., & Verspagen, B. (1999). Does specialization matter for growth? Industrial and Corporate Change, 8(2), 267–288. doi:10.1093/icc/8.2.267
- Diewert, W. E., & Fox, K. E. (2010). On measuring the contribution of entering and exiting firms to aggregate productivity growth. In W. Erwin Diewert, B. M. Balk, & D. Fixler (Eds.), Price and productivity measurements (Vol. 6, pp. 41–66). Victoria: Trafford Publishing.
- Drenkovska, M., & Redek, T. (2015). Intangible capital, innovation and export-led growth: Empirical comparative study of Slovenia and the Western Balkans. Economic and Business Review for Central and South-Eastern Europe, 17(1), 25.
- Duranton, G., & Puga, D. (2001). Nursery cities: Urban diversity, process innovation, and the life cycle of products. American Economic Review, 91(5), 1454–1477. doi:10.1257/aer.91.5.1454
- European Union. (2017). ‘Smart specialisation for European regions’. Retrieved from https://scholar.google.fi/scholar?hl=en&as_sdt=0%2C5&q=european+union+smart+specialisation+for+european+regions&btnG=
- Feenstra, R. C., & Kee, H. L. (2007). Trade liberalisation and export variety: A comparison of Mexico and China. The World Economy, 30(1), 5–21. doi:10.1111/j.1467-9701.2007.00869.x
- Feenstra, R. C., Madani, D., Yang, T. H., & Liang, C. Y.(1999). Testing endogenous growth in South Korea and Taiwan. Journal of Development Economics, 60(2), 317–341. doi:10.1016/S0304-3878(99)00054-1
- Feenstra, R. C., & Rose, A. K. (2000). Putting things in order: Trade dynamics and product cycles. The Review of Economics and Statistics, 82(3), 369–382. doi:10.1162/003465300558876
- Feldman, M. P., & Florida, R. (1994). The geographic sources of innovation: Technological infrastructure and product innovation in the United States. Annals of the Association of American Geographers, 84(2), 210–229. doi:10.1111/j.1467-8306.1994.tb01735.x
- Frensch, R., & Wittich, V. G. (2009). Product variety and technical change. Journal of Development Economics, 88(2), 242–257. doi:10.1016/j.jdeveco.2008.04.003
- Fritsch, M. (2000). Interregional differences in R&D activities—An empirical investigation. European Planning Studies, 8(4), 409–427. doi:10.1080/713666416
- Fritsch, M., & Slavtchev, V. (2005). The role of regional knowledge sources for innovation: An empirical assessment (Vol. 15). Freiberg: Technical University Bergakademie Freiberg-Faculty of Economics and Business Administration.
- Fritsch, M., & Slavtchev, V. (2011). Determinants of the efficiency of regional innovation systems. Regional Studies, 45(7), 905–918. doi:10.1080/00343400802251494
- Ganotakis, P., & Love, J. H. (2010). R&D, product innovation, and exporting: Evidence from UK new technology based firms. Oxford Economic Papers, 63(2), 279–306. doi:10.1093/oep/gpq027
- Glaeser, E. L., Kallal, H. D., Scheinkman, J. A., & Shleifer, A. (1992). Growth in cities. Journal of Political Economy, 100(6), 1126-1152.
- Görzig, B., Piekkola, H., & Riley, R. (2010). Production of own account intangible investment: Methodology in innodrive project innodrive. University of Vaasa. Working paper No 1.
- Gourlay, A. R., & Seaton, J. S. (2004). UK export behaviour at the firm level. Economic Issues, 9(2), 3–20.
- Handbook, U. N. (1999). Handbook of input–output table compilation and analysis’, Studies in methods series F. New York, NY: United Nations.
- Harris, R., & Li, Q. C. (2008). Exporting, R&D, and absorptive capacity in UK establishments. Oxford Economic Papers, 61(1), 74–103. doi:10.1093/oep/gpn011
- Helpman, E., Melitz, M. J., & Stephen, R. Y. (2004). ‘Exports versus FDI with heterogenous firms, American economic review 94ʹ. American Economic Society.
- Henderson, V., Kuncoro, A., & Turner, M. (1995). Industrial development in cities. Journal of Political Economy, 103(5), 1067–1090. doi:10.1086/262013
- Hyytinen, A., & Maliranta, M. (2013). Firm lifecycles and evolution of industry productivity. Research Policy, 42(5), 1080–1098. doi:10.1016/j.respol.2013.01.008
- Jacobs, J. (1969). Strategies for helping cities. American Economics Review, 59(4), 652–656.
- Kaldor, N. (1966). Marginal productivity and the macro-economic theories of distribution: Comment on Samuelson and Modigliani. Review of Economic Studies, 33(4), 309-319.
- Lachenmaier, S., & Wößmann, L. (2006). Does innovation cause exports? Evidence from exogenous innovation impulses and obstacles using German micro data. Oxford Economic Papers, 58(2), 317–350. doi:10.1093/oep/gpi043
- Laursen, K. (2015). Revealed comparative advantage and the alternatives as measures of international specialization. Eurasian Business Review, 5(1), 99–115. doi:10.1007/s40821-015-0017-1
- Lee, J. (2011). Export specialization and economic growth around the world. Economic Systems, 35(1), 45–63. doi:10.1016/j.ecosys.2010.11.002
- Lodefalk, M. (2014). The role of services for manufacturing firm exports. Review of World Economics, 150(1), 59–82. doi:10.1007/s10290-013-0171-4
- McCann, P., & Ortega-Argilés, R. (2015). Smart specialization, regional growth and applications to European Union cohesion policy. Regional Studies, 49(8), 1291–1302. doi:10.1080/00343404.2013.799769
- Musolesi, A., & Huiban, J.-P. (2010). Innovation and productivity in knowledge intensive business services. Journal of Productivity Analysis, 34(1), 63–81. doi:10.1007/s11123-009-0163-5
- Nadim, A. (2017), ‘Trade in value added and beyond: Developing integrated international economic accounts’, The joint Eurostat – DG RTD satellite event on “Challenges in measuring productivity, growth and intangibles” of the Eurostat biannual conference “New Techniques and Technologies for Official Statistics – Increasing Data Relevance for All” (13 – 17 March 2017), OECD.
- Neffke, F., Henning, M, & Boschma, R. (2011). How do regions diversify over time? Industry relatedness and the development of new growth paths in regions. Economic Geography, 87(3), 237–265.
- OECD. (2013). ‘Measuring knowledge-based capital’, supporting investment in knowledge capital, growth and innovation. Paris: Author.
- Piekkola, H., ed. (2011), Intangible capital - Driver of growth in Europe. Proceedings of the University of Vaasa. Reports 167; Vaasa).
- Piekkola, H. (2016). Intangible investment and market valuation. Review of Income and Wealth, 62(1), 28–51. doi:10.1111/roiw.2016.62.issue-1
- Piekkola, H. (2018). Broad-based intangibles as generators of growth in Europe. Economics of Innovation and New Technology, 27(4), 377–400.
- Piekkola, H., & Åkerholm, J. (2013). ‘Talouden kasvun veturit – Osaamiseen ja aineettomiin investointeihin vaikuttavat tekijät ‘. Kansantaloudellinen aikakauskirja, 109(4), 429–442.
- Radzi, M. S. N. M., Junoh, A. S., Hussain, N. S. N., Aziz, Z. A., & Zawawi, N. F. M. (2015). ‘The effect of information, communication and technology (ICT) and quality management to export performance of Malaysian’s SME in manufacturing sector. Journal of Scientific Research and Development 2(14), 146–157.
- Rodríguez, J. L., & Rodríguez, R. M. G. (2005). Technology and export behaviour: A resource-based view approach. International Business Review, 14(5), 539–557. doi:10.1016/j.ibusrev.2005.07.002
- Squicciarini, M., & Le Mouel, M. (2012), ‘Defining and measuring investment in organisational capital using US microdata to develop a task-based approach’, OECD Science, Technology and Industry Working Papers (Paris).
- Van Ark, B., Hao, J. X., Corrado, C., & Hulten, C. (2009). Measuring intangible capital and its contribution to economic growth in Europe. EIB Papers, 14(1), 62–93.
- Van Beveren, I., & Vandenbussche, H. (2010). Product and process innovation and firms’ decision to export. Journal of Economic Policy Reform, 13(1), 3–24. doi:10.1080/17487870903546267
- Wagner, J. (2006). Export intensity and plant characteristics: What can we learn from quantile regression? Review of World Economics, 142(1), 195–203. doi:10.1007/s10290-006-0063-y
- Wagner, J. (2012). ‘International trade and firm performance: A survey of empirical studies since 2006ʹ. Review of World Economics, 148(2), 235–267. doi:10.1007/s10290-011-0116-8
Appendix A
Figure A.1. Domestic value added in exports by domestic firms, foreign MNEs and foreign value added 2009 in 22 countries.
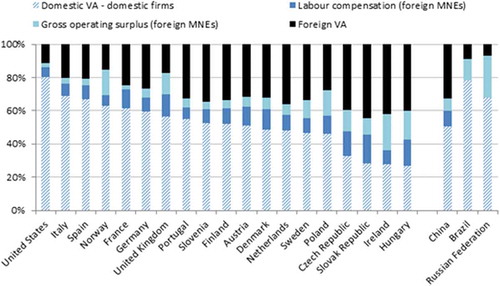
Figure A2. Firm types in gross exports and value added of exports in Nordic countries, 2013.
Source: Nadim (Citation2017)
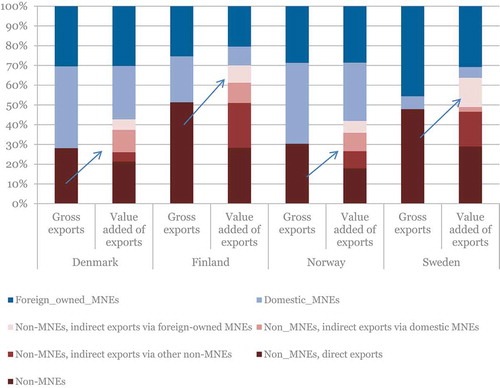
Table A.1. Summary tables of firm-level figures in Ostrobothnia, Etelä-Pohjanmaa and Uusimaa
Table A.2(a). Revealed comparative advantage RCA in Ostrobothnia region in 1999–2013 using the adjusted Balassa’s comparative advantage measure RCA
Table A.2(b). Revealed comparative advantage in Etelä-Pohjanmaa region in 1999–2013 using the adjusted Balassa’s comparative advantage measure RCA
Table A.2(c). Revealed comparative advantage in Uusimaa region in 1999–2013 using the adjusted Balassa’s comparative advantage measure RCA