
Abstract
This study investigates the effects of remittances on education and health outcomes using a 5-year interval data on 46 Sub-Saharan African (SSA) countries from 1975 to 2014. Employing system GMM, remittances were found to significantly improve education and health in SSA. It was also established that improving education impacts positively on health and the reverse was also true.
Public Interest Statement
Significant proportions of the population from Sub-Saharan Africa are found in places other than their country of origin. They do migrate for varied reasons and one of such is to search for ‘better’ opportunities. These migrants sometimes send monies (remittances) back home to families and friends. And the remittances are spent on various items including food, education, health, purchases of land and payment of loans. This paper thus investigates whether the remittances contribute significantly to the development of education and health in Sub-Saharan Africa. This will be an attempt to explore alternative income sources necessary to deepen investment in education and health in the region
1. Introduction
1.1. Background of the study
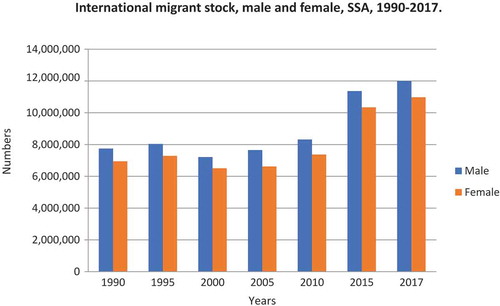
A sizeable proportion of the Sub-Saharan Africa (SSA) population is living outside their country of origin. The stock of migrants in 2013 was estimated at 23.2 million or 2.5% of the total population, with South Africa, Cote D’Ivoire, Uganda, Nigeria and Ethiopia being the top five countries that recorded the highest migration stock by mid-year 2017 (World Bank, Citation2016a; United Nations, Citation2017). Data presented by the United Nations (UN) depict a consistent rise in the total migrant stock from 2000 to 2017. The pattern has been the same for specifically male and female migrants. Nonetheless, the total numbers for the male migrants are slightly higher than their female counterparts (Figure ).
Figure 1. International Migrant Stock, Male and Female, SSA, 1990–2017.
Source: Author’s based on UN data (2017).
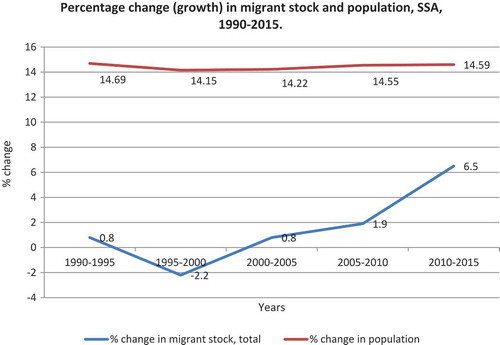
The numbers for total migrant stock recorded in the region between 1990 and 2017 increased but an opposite picture was portrayed when considering migrant stock as a proportion of the [SSA] population. Simply, it means the rise in migrant stock was outweighed by the “speedy” rise in the region’s population, given the year under review. Thus although the numbers for the total migrant stock keep increasing, the migrant stock as a percentage of the population is reducing. Migrant stock as a percentage of population recorded in 2017 was as a result lower than the figure recorded in 1990 (Figures and ). The growth of population has been high but steady. The growth of the migrant stock has been sharp comparatively, but consistently below that of the population growth (Figure ).
Figure 2. International migrant stock as a percentage of population, SSA.
Source: Author’s based on UN data (Citation2017).
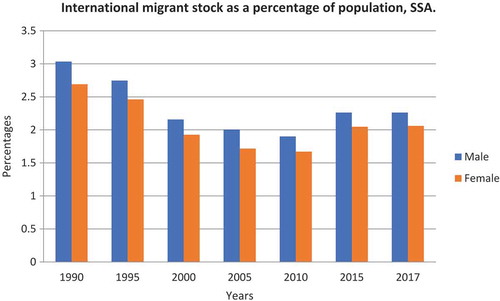
Figure 3. Percentage change (growth) in migrant stock & population, SSA, 1990–2015.
Source: Author’s based on UN data (Citation2017).
Basically, several migrants are between the ages of 20 and 39, followed by the below 15-years-of-age group. Time after time, relatively fewer migrants are beyond the ages of 60 (Figures 4–6). These possibly make one presume the likely motives behind the majority of such migrations. That is, the dependent age groups likely moving for family visitations whereas the vibrant working age group likely moving to search for “better” opportunities.
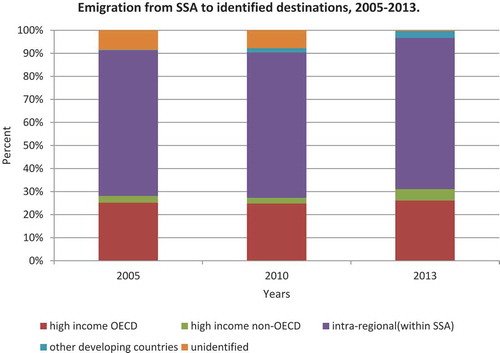
Migration in SSA is characterized by intra-regional and international migrations, the former being dominant. Preferably, the author calls it the ‘within migration’Footnote1 and the ‘between migration’Footnote2 Ratha et al. (Citation2011) report about two-thirds of the entire migration in SSA is intra-regional. This translates into over 60, percentage-wise. Specifically, accounts on intra-regional migration were 63.2%, 63.0% and 65.6% in 2005, 2010 and 2013, respectively (World Bank, Citation2008, Citation2011, Citation2016). Intra-regional migration is most common in poorer countries from the region, notably because of insufficient financial resources to travel long distances to other continents. Also, they may lack adequate education and skills needed to be successful in “rich countries’ labour markets” (Ratha et al. Citation2011). Therefore, majority of them move to other SSA countries that have relatively larger and diversified economies like South Africa, Cote D’Ivoire and Nigeria. These are mainly influenced by cultural and language linkages, income variations, geographic closeness, environmental reasons, political instability in home countries and political stability in host countries (Gonzalez-Garcia, Hitaj, Viseth, & Yenice, Citation2016; Ruyssen & Rayp, Citation2014). The dominant intra-regional migration corridors outlined in descending order for 2013 were Burkina Faso-Cote D’Ivoire; Zimbabwe-South Africa; Cote D’Ivoire-Burkina Faso; Somalia-Kenya; Somalia-Ethiopia; Sudan-South Sudan; Mali-Cote D’Ivoire; Mozambique-South Africa; and Lesotho-South Africa (World Bank, Citation2016a). Nine of these corridors also made it to the top 10 entire migration (both intra-regional and international) corridors in 2013. This further stresses the dominant nature of intra-regional migration in the region.
Migration outside the region although low is, however, picking up sharply, mostly to the Organization for Economic Co-operation and Development (OECD) countries. The stock of SSA migrants outside the region in 2013 stood at 6.6 million, 2½ times larger the number recorded in 1990. The main driver of migration outside the region is an economic motive. Differences in per capita income between SSA and OECD countries largely tend to push labor to the latter region. The composition of SSA migrants to foreign countries has also changed. There has been a decline in the percentage that moved as refugees, due to a decline in wars in SSA. In 2013, the number of migrants who moved for economic reasons had increased to 90% from 40% in 1990 (Gonzalez-Garcia et al., Citation2016).
Figure and Table present a pictorial view of migration from SSA to other identified destinations both within and outside the region.
Table 1. Top 10 emigration countries in SSA and their top five destination countries for 2013, in descending order
Figure 4. International migrant Stock by age and sex, SSA, 2000.
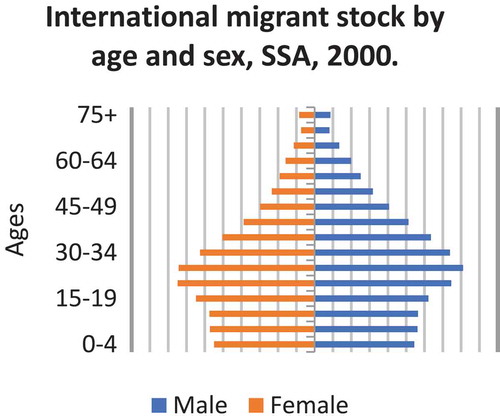
Figure 5. International migrant Stock by age and sex, SSA, 2010.
Source: Author’s based on UN data (2017).
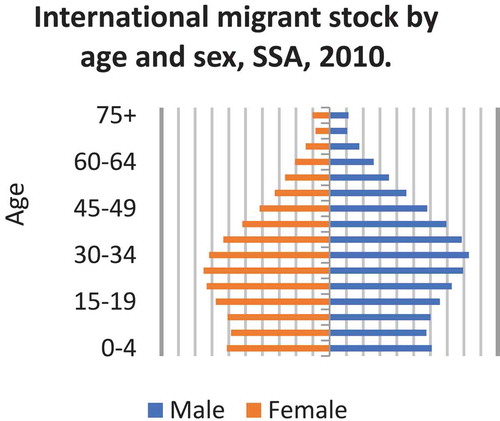
Figure 6. International migrant stock by age and sex, SSA, 2017.
Source: Author’s based on UN data (2017).
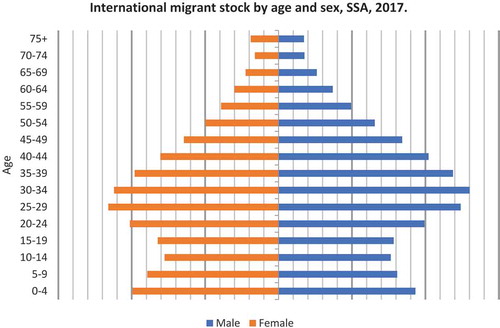
Figure 7. Emigration from SSA to identified destinations, 2005–2013.
Source: Author’s based on UN data (2017).
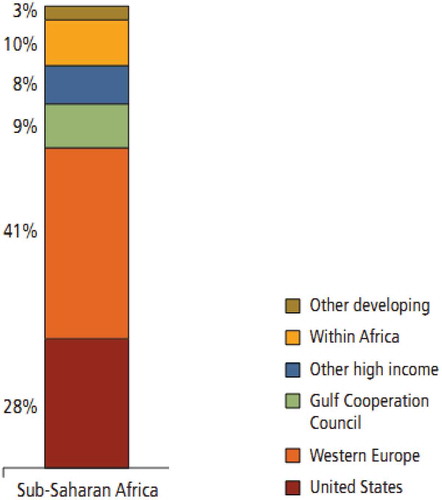
Remittances are sent by emigrants to families and friends back home. This has been a substantial source of income for homes in developing countries and specifically Sub-Saharan countries. Statistics from the World Bank (Citation2017) revealed remittances almost doubled between 2005 and 2015. In 2014, US$ 36.9 billion was received as remittances in the region and rose to US$ 39.8 billion in 2015. These represented 2.16% and 2.59% of GDP for the respective years (World Bank, Citation2017). Remittances received in US dollars depicted an upward trend between 1990 and 2015. But for the more than proportionate rise in GDP, remittance as a percentage of GDP decreased between 2005 and 2010 (World Bank, Citation2017) (Figures and ). The various sources of remittances to the region in 2010 are also presented in Figure (extracted from Ratha et al., Citation2011, p. 53).
Figure 8. Remittances received in current US$, SSA.
Source: Author’s based on World Bank Data (Citation2017).
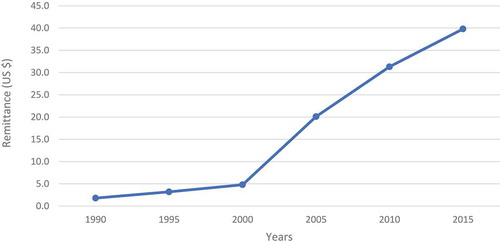
Figure 9. Remittances received as a percentage of GDP, SSA.
Source: Author’s based on World Bank Data (Citation2017).
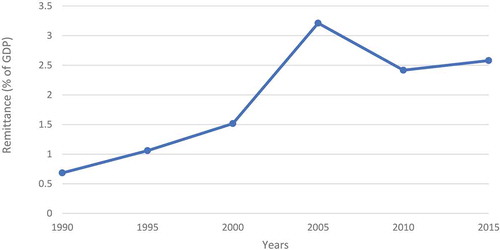
Figure 10. Sources of remittances to SSA, 2010.
Source: Ratha et al. (Citation2011, p. 53).
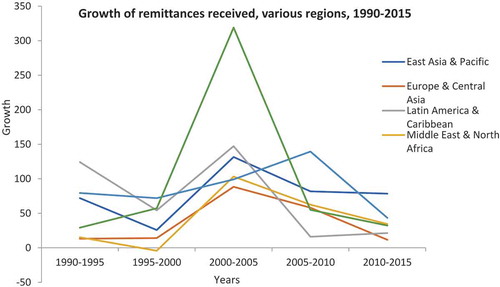
Regional comparison of remittances sent and received in monetary terms showed low figures for SSA, for the average period 1990 to 2015. In relation to remittances sent, SSA recorded the second to last, after South Asia under the year under consideration. They [SSA] also recorded the least remittances received over the same period (Figure ). Nonetheless, the growth of remittances received in the region has been positive with a shock in the year 2000–2005 (Figure ). So basically, remittances received in SSA continually increase but are still low compared to other regions.Footnote3
Figure 11. Remittances sent and received, various regions, 1990–2015 average.
Source: Author’s based on World Bank data (Citation2017).
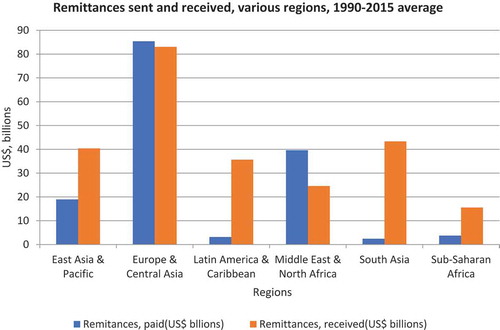
Figure 12. Growth of remittances received, various regions, 1990–2015.
Source: Author’s based on World Bank (Citation2018) data.
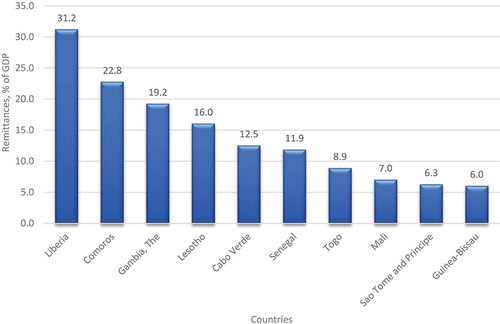
Nigeria was the highest recipient of remittances in 2015, valued US$ 21.1 billion, representing more than half of the total remittance received in the region. Ghana and Senegal followed with remittances received valued at US$ 5.0 billion and US$1.6 billion, respectively. Looking at remittances as a percentage of GDP however, put Liberia, Comoros and The Gambia ahead with 31.1%, 22.8% and 19.2% of GDP, respectively, in 2015 (World Bank, Citation2017). This is explained by the low GDP in these countries compared to countries like Nigeria and Ghana. As such, even relatively lower remittances received generate a relatively higher remittance per GDP (Figures and 1).
Figure 13. Remittances received in US$ for top 10 SSA countries, 2015.
Source: Author’s based on World Bank (Citation2017).
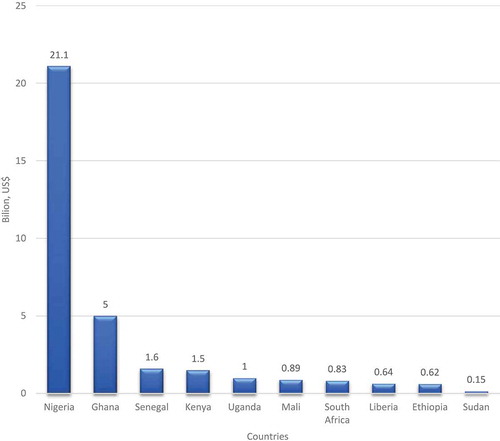
Figure 14. Remittances received as a percentage of GDP for top 10 SSA countries, 2015.
Source: Author’s based on World Bank (Citation2017).
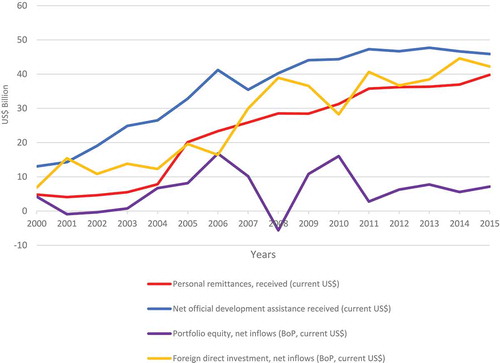
Although migration has mainly been intra-regional, intra-regional remittances are however low contrasted with international remittances. This is because of higher incomes received by African migrants in Europe and the United States compared to migrants in other African regions (Ratha et al., Citation2011). About three-fourths of the total remittances received in 2015 were from advanced countries with the remaining one-fourth coming from the SSA region (Gonzalez-Garcia et al., Citation2016). Remittances have not only been a significant source of income, they are also less volatile. They typically increase during natural disasters when they are motivated by altruism (World Bank, Citation2016b). This story is no different from SSA. Remittance to the region is steady and consistently increasing. It remained less volatile even during the global financial crises in 2008 (Figure ). This makes it a potentially reliable source of income and one that can be depended on to make some decisions.
Figure 15. Remittances and other resource flow to SSA, 2000–2015.
Source: Author’s based on World Bank (Citation2017).
Specific uses of remittances for selected countries in 2009 has been estimated by Ratha et al. (Citation2011) and it revealed a greater proportion of remittances received in SSA were spent on human and physical capital investments like education, health, land, construction of new and rebuilding of old houses. A significant fraction was also invested in establishing businesses. Food remained a non-investment item with significant expenses on. This may probably be due to its necessity nature (Table ). The sub-headings under each country present three sources of remittances: those received from within the country itself (domestic); those received from within Africa––excluding the country under consideration; and finally those received from outside Africa. Each further expresses how it is spent on various items.
Table 2. Uses of remittances in some African countries, by the source of remittance (percentage of total remittance)
Calculations based on results of household surveys conducted in Burkina Faso, Kenya, Nigeria, Senegal, and Uganda in 2009 as part of the Africa Migration Project.
Note: .. = negligible or missing.
Includes agricultural equipment.
OA, outside Africa (source of remittance);
Remittances impacts are observed both at the micro and macro levels. At the micro level, it serves as a social insurance. It increases households spending and has powerful anti-poverty effects (Lubambu, Citation2014; Ratha, Citation2013). It is also a source of investment, especially in education and health and thus contributes to the development of human capital (Lubambu, Citation2014). At the macro level, empirical studies by Solimano (Citation2003) and World Bank (Citation2006) found a positive effect on economic growth. Aggarwal and Peria (Citation2006); Giuliano and Ruiz-Arranz (Citation2005) have also argued remittances boost consumption and investment and as such a prospective tool to minimize the effects of a recession in a country.
1.2. Review of education and health in Sub-Saharan Africa
“Health and Education are not only human rights, but also the basis for the realization of all other rights” (UNICEF, Citation2013).Footnote4 They are used as tools to measure the level of economic and human development of an area. Likewise, the connection between education and health has been established. Education has been proven to create opportunities for better health whiles good health forms a basis for effective studies (education) (Center on Society and Health, Citation2015). They are thus crucial to the transformation of an area.
A review of these indicators in SSA depicts a promising future. The number of children enrolled in primary education increased by 75% between 1999 and 2012. Adult literacy marginally increased from 53% in 1990 to 59% in 2012 (UNICEF, Citation2015). Data from the World Bank (Citation2017) also show infant mortality rate in SSA has consistently declined over the past 50 years. Male and female adult mortality rates have also witnessed a substantial decline. Yet, the region still lags behind relative to others (Figures and 1).
Figure 16. Educational outcomes for various regions, 1990–2015 average.
Source: Author’s based on World Bank (Citation2017).
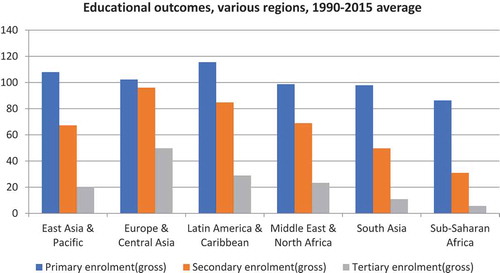
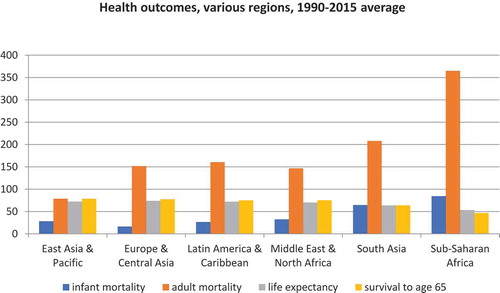
Figure 17. Health outcomes for various regions, 1990–2015 average.
Source: Author’s based on World Bank (Citation2017).
Primary, secondary and tertiary education (TE) enrollments remained lowest for the average period 1990 to 2015. The primary, secondary and TE enrollments (gross) averaged 86.3, 30.9 and 5.6%, respectively, compared to 102.3, 96.0 and 49.8% in Europe. The Latin America and the Caribbean witnessed the highest enrollments in the primary school level for the period under review. Europe and Central Asia then dominated in the secondary and tertiary gross enrollment rates. World Bank (Citation2017).
Infant and adult mortality in SSA remained the highest among the six regions. Europe and Central Asia recorded the least infant mortality rate followed by Latin America and the Caribbean. Europe and Central Asia still recorded the least adult mortality. Life expectancy at birth in SSA also averaged 53.1 years for the period [1990–2015], and this was the lowest among the regions, same as the percentage of newborn babies who would live up to age 65 (survival to age 65) (Figures and 1).
1.3. Statement of the problem
The persistent challenges in education and health in SSA stimulate the need to explore options in an attempt to deal with these challenges. Governments’ expenditures on education and health have continually made some impacts. But, there is the need to consider other effective income sources that can also bring the menace under control. Such an alternative is remittances.
Despite the increasing importance of remittances, there are not many empirical studies that link remittances to education and health specifically in SSA. However, it must be acknowledged that there have been some studies on developing countries in general. The majority of the empirical works have centered on Latin American and Asian countries with limited studies on SSA (Gyimah-Brempong & Asiedu, Citation2015). And so some relevant questions to ask are:
Do remittances impact on education and health (human capital formation) in SSA?
Does improving one indicator [for example, education] impacts positively on the other [for example, health]?
How different are the marginal effects of remittances from the marginal effects of public expenditure on education and health in SSA?
1.4. Objectives of the study
The main objective of this study is to establish the link between remittances, education and health in SSA. Specifically:
Examine the effects of remittances on education: primary enrollment (gross), secondary enrollment (gross), and tertiary enrollment (gross).
Investigate the effects of remittances on health: infant mortality, adult mortality, life expectancy and survival to age 65.
1.5. Significance of the study
This study will add to the relatively small literature on remittances and human capital formation in SSA. While most studies, for example, have looked at remittances and infant mortality as a measure of health outcomes, this study will incorporate adult mortality. Similarly, enrollment from primary to tertiary enrollment is looked at in this study. This will provide a better understanding of the effect of remittances on education and health at different cohorts.
The study will also serve as a basis for which policies regarding education and health can be developed and implemented.
Finally, the study will shed light on the need for human capital development in the region. These are both economic and human development indicators necessary to transform the region.
2. Literature review
The importance of remittances on economic development has raised the interest in researching in this area. Development has been critical in recent literature and as such various empirical works seek to establish its link with remittances. Among these include remittances and poverty, financial development, investment, education and health.
Some studies show recipients of remittances spend their income on consumption goods and therefore remittances may have a negligible effect on development. They argued a less proportion is saved or invested in productive activities but rather significantly spent on “status-oriented” consumption goods. They typically invest in housing, land, jewelry which is not beneficial to the entire economy (Chami and Samir, Citation2003).
This has been refuted by Adams and Cuecuecha (Citation2010). They argued households rather spend more of their remittances on investment goods because they view it [remittance] as a temporary and not a permanent income, thus, the marginal propensity to invest is high. Households receiving remittances do not spend high proportion on foods and consumer goods than a non-remittance receiving household, they added. Adams and Cuecuecha (Citation2010). Remittances relax resource constraints on households and provide incentives for investment (Gyimah-Brempong & Asiedu, Citation2015). They raise consumption and expenditure on health, education, and nutrition which contribute to long-term productivity (Mohapatra & Ratha, Citation2011).
Attempts to empirically understand the effect of remittances on health and education have yielded mixed results. Numerous studies have found that remittances improve health outcomes such as infant mortality and child health. However, the effect on educational outcomes—school enrollment—is debatable. While some have found that remittances increase completion rate, others have argued otherwise (Adams, Citation2011).
2.1. Remittances and education
The level of one’s education is likely to influence decisions to migrate and eventually remit. This shows how education may have an influence on remittances. On the other hand, remittances from migrants are also invested in education, yielding benefits. This paper seeks to examine the latter case, that is, how remittances affect education.
Zhunio, Vishwasrao, and P. (Citation2012) conducted a cross-country study on 69 low- and middle- income countries. Their results showed remittances through its effect on private educational spending, have a higher effect on educational outcomes than public expenditure on education. Also, the effect of remittances at the secondary level was higher than that of the primary level. Using two-stage least squares (2SLS) estimation and calculating for elasticity, they found that 1% rise in real remittances per capita leads to 0.12% rise in the share of students registered in the secondary school and 0.09% rise in primary completion rate. The Hausman–Taylor estimates also showed a positive relationship between secondary school enrollment, primary school completion rate (coefficients of 2.352 and 2.931, respectively) and real remittances per capita. The effect of remittances on primary school enrollment was positive but insignificant.
Research by Amakom and Iheoma (Citation2014) on 18 Sub-Saharan countries using 2SLS method found primary school enrollment and secondary school enrollment rose by 4.2% and 8.8%, respectively, for every 10% rise in remittances. This confirmed studies by Zhunio et al. (Citation2012) who argued the impact on secondary school enrollment was greater than primary school enrollment.
Lu and Treiman (Citation2007) argued that in South Africa, children from remittance recipient households [Blacks] were 30% more likely to have some secondary education compared to non-migrating households without remittances. Remittance recipient households were also 73% likely to have some secondary education and 130% likely to have educational levels beyond secondary school.
In Ghana, it was found the probability a child enrolls in primary school rises by 13% if a household’s status moves from a non-international remittance recipient one to an internationalFootnote5 remittance recipient one. Similarly, the likelihood of attending a secondary school rises by 54% for the same household status change. Households headed by females were also more likely to invest remittances in children’s education than those headed by men (Gyimah-Brempong & Asiedu, Citation2009, Citation2015).
A percentage increase in the fraction of remittance-receiving households in Mexico reduces children illiteracy by close to 3 percentage points. Considering remittances impacts on education for different age categories, he established schooling for under-age-five group rises by 11% for a 1% rise in receiving remittances. However, remittances reduced school attendance among teenagers between 15 and 17 years and had no significant impact among children between 6 to 14 years (Lopez-Cordova, Citation2006).
In contrast, McKenzie and Rapoport (Citation2011) conclude in their research that remittances had negative effects on school attendance and attainment in rural Mexico for boys between 12 and 18 years and girls between 16 and 18 years. This is as a result of children having to take up roles of migrated adults, lack of effective supervision of children, and incentive for older children to also migrate and find low skill jobs.
Finally, Cattaneo (Citation2010) finds remittances have no significant results on education in Albania. This he argued may be due to the low perceived returns to education in the region because of the low quality of education, and directives from remittance senders to use the money on specific allocations instead of education.
2.2. Remittances and health
A study by Zhunio et al. (Citation2012) found a percentage rise in real remittances per capita raises life expectancy by 0.03% and reduces infant mortality by 0.15%, for 69 low- and middle-income countries. Another cross-country study on 84 countries by Chauvet, Gubert, and Mesplé-Somps (Citation2009) revealed remittances reduced both infantFootnote6 and childFootnote7 mortality, but the reduction was higher for the richest households compared to the poorest households.
In SSA, Amakom and Iheoma (Citation2014) using 2SLS estimation found 10% rise in remittances increase life expectancy at birth by 1.2% on average. This impact was larger than those caused by public health expenditure per capita; which was 0.5% on average for every 10% rise in public health expenditure per capita.
Duryea et al. (Citation2005) based on population census data examined how international remittances impact on infant mortality in Mexico. They employed 2SLS and instrumented remittances with historic state-level rates of migration in Mexico and distance to the US border. They established international remittances reduce infant mortality in the first month of life, but this is only significant in large urban areas and not rural communities (Cited by Adams, Citation2011). Further studies in Mexico disaggregated the impacts into an immediate and long run. It was argued that children’s health generally declines during the first year of their parents’ migration but improves in later years. The immediate effect was due to the initial family disruption and psychological instability (Kanaiaupuni and Donato, Citation1999; Cited by UNICEF, Citation2013).
Lopez-Cordova also estimated using instrumental variables and 2SLS based on municipal-level data from Mexico. He instrumented remittances with rainfall concentration and distance to Guadalajara (located in Central Mexico). He established a percentage increase in the fraction of remittance-receiving households lowers deaths of infants by 1.2 lives (2006). In Nigeria, the probability of a child dying reduces by 1.66% for every percentage increase in remittances (Ifeyinwa, Citation2010).
In Jamaica, however, a joint research by UNICEF and the Government of Jamaica found no significant differences in the health outcomes of children from remittance-recipient households and those that are not. This was in spite of increased health expenditure in remittance-recipient households (UNICEF and PIOJ,Footnote8 2009; Cited by UNICEF, Citation2013).
3. Methodology
3.1. Economic model
A review of the literature depicts portions of remittances are spent on education and health, among other goods and services. An assumption in microeconomic utility maximization theory is local non-satiation that explains even a little change in the consumption of goods and services are preferred. However, the resources available at a time become a limitation to our desires. This paper follows the resource constraint model under the assumptions that parents wish to spend on their children’s education and health up to a desirable level, out of altruism, but are faced with resource constraints. Remittance, a source of income to households, when received relaxes the constraint [limited income] and makes it possible to spend on children’s education, health and other goods. This is expressed as follows:
Assume a household maximizes utility by spending on education and health (human capital), and all other goods subject to a budget constraint.
Then Utility = U(X,Z) such that Y ≥ pxX + pzZ; (1)
where
U = utility
X = quantity of education and health demanded
Z = quantity of all other goods demanded
Px = price of education and health
Pz = price of all other goods
pxX + pzZ = expenditure on education and health, and all other goods
Y = total income = remittance income + non-remittance income
The relation in Equation (1) shows households would like to maximize their utility from the consumption of education and health, and all other goods but they are restricted by their income (Y). This is typical for the SSA region because of the high incidence of poverty. An inflow of remittance (an alternative source of income) increases total income making more resources available for families to spend on goods and services. Hence, all things equal, remittances are expected to improve education and health outcomes.
In detail, remittances can be argued to alleviate the barriers that force children into work instead of school at earlier ages. As such it is expected school enrollments increase especially at the secondary level that is costlier and not compulsory. Moreover, households can afford medicines, healthy foods and access health care that will lead to a reduction in deaths and higher life expectancies. At the macro level, remittances can be used to finance the construction of schools and health facilities, generating positive benefits.
3.2. Econometric specification and estimation
The interest is to analyze the effects of remittances on specific education and health outcomes. The econometric specification for estimation is as follows:
Outcomeίt = βjRemitit+ βkXίt+ γί+ Фt + είt;
where
Outcome = education and health outcomes;
Education outcomes = primary enrollment (gross), secondary enrollment (gross), tertiary enrollment (gross).
Health outcomes = Infant mortality, adult mortality, survival to age 65, life expectancy.
Remitίt = real remittance per capita received by country ί at time t.
X ίt = characteristics of country ί at time t.
These characteristics include GDP per capita, public expenditure on education and health, primary completion rate, unemployment rate, rural population, physicians, the percentage of population aged 25–24 years with completed TE, net migration rates, income differences between OECD and SSA countries, and dependency ratio.
γί represents country-fixed effect, to control for country-specific time-invariant characteristics that affect education, health and remittances like culture, colonial ties.
Фt represents time-fixed effect, to control for shocks at specific times, for example, the financial crises in 2008; wars that happened in some SSA countries over the years.
είt represents the standard error term.
βj, βk are coefficients.
An issue with estimating remittances is the endogeneity problem. Considering education, health and remittances variables, there is the tendency for this problem due to reverse causality. In as much as remittances may influence the level of education and health demanded, education and health can also influence remittances. The level of one’s education is likely to induce migration and thus remittances. A healthy person, on the other hand, has the ability to migrate, work for more hours and remit. Thus, the stock of education and health may influence remittances received.
As a result of the endogeneity problem, estimating with ordinary least-squares (OLS) may yield biased and inconsistent results. A plausible approach to resolve this issue is the use of generalized method of moments (GMM) (Baltagi Badi, Citation2015). This research specifically uses system GMM. They are designed for “small T, large N” panels. That is panel data with few time periods and large cross-sectional dimension (groups). Relative to OLS, GMM produces consistent results (Baltagi Badi, Citation2015). Also unlike difference GMM, system GMM includes the level equation, thus generating additional instruments that “can dramatically improve efficiency” (Roodman, Citation2006).
3.3. Diagnostic checks
In all the estimations, the AR(1), AR(2) and Hansen test were employed. These are used to check autocorrelation and overall exogeneity of instruments, respectively.
4. Presentation and discussion of results
4.1. Data
The data for the empirical estimation cover 46 SSA countries from the period 1975 to 2014 obtained from the World Bank’s World Development Indicators. Data on net migration rates were obtained from the United Nations Population Division (World Population Prospects, the 2017 Revision). Descriptive statistics of the various variables are presented in Table .
Table 3. Descriptive statistics
4.2. Limitations
There are two main limitations to this research. Firstly, is underreporting of actual remittances and secondly missing data. Figures on remittances reported by the World Bank only captured those sent through official channels. Meanwhile, significant portions of these inflows are through informal or unofficial sources that are not recorded. The remittance inflows data reported by countries thus tend to be higher than the World Bank figures. For example, the central bank of Ghana reported US$ 1.6 billion remittances to the country in 2009; over 10 times the US$ 114 million figure reported by the International Monetary Fund (IMF) and captured by the World Bank data. In the same year, Ethiopia reported about US$ 700 million compared to US$ 353 million by IMF. These tend to underestimate the marginal impacts of remittance (Ratha et al., Citation2011).
The other limitation is missing data. Data on a number of variables were not reported by some countries for some periods. Countries like Central African Republic, Chad, The Democratic Republic of Congo, Liberia and Zambia had a little report on remittances and other variables. To maximize the number of observations, the 5-year interval data on all variables were used. This minimized the missing data problem. Notwithstanding, the results were robust.
4.3. Presentation of results
Real remittance per capita correlates positively with all the educational outcomes. But the higher the educational level, the higher the correlation. Real remittance per capita also correlates inversely with infant and adult mortalities, but positively correlated with survival to age 65 and life expectancy (Table ).
Table 4. Correlation matrixes between real remittance per capita, education and health outcomes
A further test of stationarity was conducted on all variables. It was revealed that all variables except the rural population were stationary at levels. The rural population was only stationary after first difference (Table ).
Table 5. Stationarity tests for various variables
There are two separate tables for outcomes. Table presents results for educational outcomes, while Table presents that of health outcomes. For each table, there are two columns; system GMM (1) and system GMM (2). Column (1) of each table captures estimations based on using internal instruments. That is, instrumenting remittances with its lags. For column (2) of each table, which is our interest, external instruments are employed in addition to the internal instruments to instrument remittance. These external instruments included net migration rates, dependency ratio and the difference in GDP per capita between individual SSA countries and OECD as a group.
Table 6. Real remittance per capita and education
Table 7. Real remittance per capita and health
These variables were selected as the instrument because they tend to drive the inflow of remittances. Net migration rates comprise of immigration and emigration rates in an area. In SSA majority of the emigrants from a particular country end up as immigrants in other SSA countries. With the focus of this study on the whole region, the net migration rate was preferred to net outward migration [which only captures emigration] which has been used in other studies as instruments. A significant source of remittances to SSA also comes from OECD countries. Thus, the income of the host country [region] significantly affects remittances to SSA (Singh, Haacker, & Lee, Citation2009). Ideally, people may tend to remit more if the difference between what they receive in their host countries is slightly higher than what their beneficiaries receive back home. The dependency ratios of remittance senders back home also to an extent determine how much is being sent. As already established, a majority of the migrants from SSA fall within the active working age group and as such relations left back home have some expectations in terms of financial support. The higher the number of people depending on migrants, the higher the expected amount to remit, all things being equal. These three variables are hence used as external instruments to predict remittances.
The results from Tables and 7 show the coefficients of estimation and the significance at 10, 5 and 1% level for all education and health outcomes under consideration. Real remittance per capita impacts significantly on all health outcomes and on two out of three educational outcomes. The focus of discussion of the results is on column (2) of each Table .
4.4. Discussion on findings
Enrollments in secondary and TE increase when real remittance per capita increases. The effect is stronger at the secondary level than at the tertiary level. Likely, the relatively high demand for and to a large extent the “necessary” nature of secondary school will mean high motivation for parents to invest in education at that level for any alternative income received such as remittances. TE on the other hand may be seen as “luxury” for some families and as such if remittance senders do not give specific directives as to what to use remittance for, say invest in TE, then one may expect the impact of remittance on tertiary enrollment to be relatively low. The effect of real remittance per capita on primary enrollment was insignificant and negatively signed. In terms of significance, this result was similar to Zhunio et al. (Citation2012) who also found no significant relationship between real remittance per capita and primary enrollment. However, their research had a positively signed coefficient for the variable of interest—real remittance per capita- on primary enrollment. Conversely, Amakom and Iheoma (Citation2014) had positive and significant results for primary enrollment on [18] SSA countries. The negatively insignificant results in this paper can be likened to the absence of mostly male adults, who are usually the migrants. The result is less control or enforcement on younger children to attend school. The interest of younger children to willingly attend school is low compared to older children. As such, the absence of a parent [and mostly men who happen to the family heads] to exert some control and properly monitor younger children may raise the latter’s desire to snub schooling. Education at the primary level is also virtually free, which implies enrollment at that level may not necessarily depend on income constraints but rather factors such as ethnicity, family’s educational history and parents’ value they place on education.
Contrary to results from Zhunio et al. (Citation2012) and Amakom and Iheoma (Citation2014), public education expenditure appeared to significantly improve primary and secondary enrollments. It does seem that households are motivated to send their children to school if governments invest more in education at that level. This may be that the specific areas governments’ expenditures are directed significantly affect households’ income. Thus, households are willing to release their wards from engaging in other income-generating activities and attend school when governments spend more on education. Moreover, the effect of public education expenditure was higher than that of real remittance per capita.
Reducing infant mortality increases enrollment, significantly at the secondary level. For the percentage of the population aged 25–34 with completed TE, increasing this number translates into higher secondary and tertiary schools enrollments. Majgaard and Mingat (Citation2012) used the percentage of the population aged 25–34 with completed TE as a proxy to measure the supply of highly skilled labor and found that it was significant in improving tertiary enrollment in SSA. Using the same variable, this research found similar results for not only tertiary enrollment but also secondary enrollment. This may be due to: firstly, completing TE may guarantee higher paid jobs to assist dependants. Secondly, these highly educated people may be more motivated to advise children and parents -that is if they are not parents themselves––to equally go to school based on their personal educational experiences. Thus, one can only expect a rise in the proportion of educated people to improve subsequent educational outcomes. Unemployment rates had expected signs but were not significant in all cases. Reduction in unemployment will mean more available jobs for parents, guardians and elder brothers, which eventually translate into more money available to fund the education of their dependents.
For the health outcomes, remittances lowered infant mortality, adult mortality, prolonged the percentage of newly born infants who live up to age 65 (survival to age 65) and the overall life expectancy of the population. As expected, remittances made it possible for households to access proper health care and live a good life hence improvement in their stock of health. A higher reduction was seen in adult mortality relative to infant mortality. This implicitly implies the adult age group is more sensitive to changes in remittance. For infants who are vulnerable, parents or guardians might do everything possible to cushion them [infants] against remittance shocks. Public health expenditure and GDP per capita were insignificant in improving health outcomes.
An increased number of people who have completed some primary education minimizes infant mortality and prolongs life expectancy. Ideally, having completed primary education means they will learn some basic things like personal hygiene, drug abuse, ante- and post-natal cares, that in-turn benefits their health stock. When the level of unemployment falls, infant mortality also falls, survival to age 65 and life expectancies rise. Unemployment also had an expected sign on adult mortality but was not significant. Similar to findings by Zhunio et al. (Citation2012), higher rural population worsens health indicators but the results are insignificant, with reference to this paper.
Increasing physicians in the region improved all health outcomes looked at in this paper. The marginal effects were greater. There exist a one-to-greater-than-one relationship between the number of physicians and health outcomes. A single physician added to the existing numbers on average improves health outcomes by more than a unit. This can be attributed to the already fewer physicians in the region, thus even a small increase generate very high impacts.
5. Conclusion and recommendations
5.1. Conclusion
The paper used 5-year interval data on 46 SSA countries to investigate how remittances impact on education and health in the region. Using system GMM, controlling for both time and country-specific effects, it was found real remittances per capita increase enrollment in secondary and TE, reduce infant mortality, adult mortality and prolong infants survival to age 65 and life expectancy. Real remittance per capita had no significant effect on primary enrollment.
5.2. Recommendations
The cost of remittance transfers to the region should be revised downwards. The cost of sending remittances to the region remain highest, averaging 12% for a US$ 200 transaction whiles averaging less than 8% for other developing countries (Ratha et al., Citation2011). Minimizing the cost will motivate more inflows and intensify the human capital investment.
There should be an improvement in the management of remittances data by the various central banks in the region. The wide gap between the actual remittances and the reported tends to undermine estimating the full effects of remittances. Strong policy formulation and implementation require strong empirical backing premised on fully provided data.
Finally, countries operating fixed exchange rate regimes in the region should take a second look at their approach as it hinders the transfer of remittances through formal sources. Pegging the exchange rate specifically below the market clearing price influences a higher price at the black market. People are thus motivated to trade in the black market, discouraging official transactions. For example on 22 February 2016 in Nigeria, a dollar was traded at 367 naira in the black market and 195 naira in the official market (World Bank, Citation2016b). This fosters illegal transactions and underestimates officially recorded values of remittances for empirical investigation.
Correction statement
This article has been republished with minor changes. These changes do not impact the academic content of the article.
Additional information
Funding
Notes on contributors
Komla Amega
Komla Amega holds an MSc degree in economics from the University of the West Indies, St Augustine Campus, Trinidad and Tobago. He had his undergraduate studies at the University of Ghana, where he obtained a BA degree in economics with geography and resource development. He has experience in undertaking academic, market and social researches. His research interest covers education, health, behavioral economics and policy analysis.
Notes
1. Within migration (intra-regional migration) to mean movements confined to the geographical boundaries of the region.
2. Between migration (international migration) to mean movements beyond the geographical boundaries of the region.
3. Regional classification based on the World Bank’s classification of the world.
4. UNICEF––United Nations Children’s Fund.
5. Gyimah-Brempong and Asiedu (Citation2015) distinguished between sources of remittances. Those received from within Ghana (internal) due to internal migration are termed domestic remittances and international remittances are those from outside Ghana (external).
6. Deaths of children under 1 year of age per 1000 live births.
7. Deaths of children under 5 years of age per 1000 live births.
8. Planning Institute of Jamaica.
References
- Adams, R. H. (2011). Evaluating the economic impact of international remittances on developing countries using household surveys: A literature review. The Journal of Development Studies, 809–828. doi:10.1080/00220388.2011.563299
- Adams, R. H., & Cuecuecha, A. (2010). Remittances, household expenditure and investment in Guatemala. World Development, 38, 1626–1641. doi:10.1016/j.worlddev.2010.03.003
- Aggarwal, R., Demirgüç-Kunt, A., & Peria, M. S. (2006). Do workers’ remittances promote financial development? Washington DC: The World Bank.
- Amakom, U., & Iheoma, C. G. (2014). Impact of migrant remittances on health and education outcomes in Sub-Saharan Africa. IOSR Journal Of Humanities And Social Science, 19, 33–44. doi:10.9790/0837
- Baltagi Badi, H. (2015). The Oxford handbook of panel data. New York: Oxford University Press.
- Cattaneo, C. (2010). Migrants’ international transfers and educational expenditure: Empirical evidence from Albania. SSRN Electronic Journal. doi:10.2139/ssrn.1555709
- Center on Society and Health. (2015, February 13). Center on society and Health. Author Retrieved from: http://societyhealth.vcu.edu/work/the-projects/why-education-matters-to-health-exploring-the-causes.html
- Chami, R., Fullenkamp, C., & Samir, J. (2003). Are immigrant remittance flows a source of capital for development? Washington DC: IMF.
- Chauvet, L., Gubert, F., & Mesplé-Somps, S. (2009). Are remittances more effective than aid to reduce child mortality? An empirical assessment using inter and intra-country data. Paris: HAL.
- Duryea, S., Cordova, L. E, & Olmedo, A. (2005). Migrant remittances and infant mortality: Evidence from Mexico. Inter-American Development Bank.
- Giuliano, P., & Ruiz-Arranz, M. (2005). Remittances, financial development, and growth. Washington DC: The World Bank.
- Gonzalez-Garcia, J., Hitaj, E., Viseth, A., & Yenice, M. (2016, November). Sub-Saharan Africa Migration: Patterns and Spillovers. Washington, DC: International Monetary Fund Spill Over Notes.
- Gyimah-Brempong, K., & Asiedu, E. (2009). Remittances and Poverty in Ghana. African Economic Conference. Addis Ababa.
- Gyimah-Brempong, K., & Asiedu, E. (2015). Remittances and Investment in Education: Evidence from Ghana. The Journal of International Trade and Economic Development, 24, 173–200. doi:10.1080/09638199.2014.881907
- Ifeyinwa, O. G. (2010). The effects of remittances on poverty and human capital formation in Nigeria.
- Kanaiaupuni, S. & Donato, K. (1999). Migradollars and Mortality: The effects of migration on Infant Survival in Mexico. In Demogarphy. Vol 36 (pp. 339–353).
- Lopez-Cordova, E. (2006). Globalization, migration and development: The role of Mexican migrant remittances. Maryland: Institute for the Integration of Latin America and the Caribbean.
- Lu, Y., & Treiman, D. J. (2007). The effect of labor migration and remittances on children’s education among blacks in South Africa. California: California Center for Population Research.
- Lubambu, K. M. (2014). The impacts of remittances on developing countries. Brussels: European Union.
- Majgaard, K., & Mingat, A. (2012). Education in Sub-Saharan Africa: A comparative analysis. Washington Dc: The World Bank.
- McKenzie, D., & Rapoport, H. (2011). Can migration reduce educational attainment? Evidence from Mexico. Journal of Population Economics, 24, 1331–1358. doi:10.1007/s00148-010-0316-x
- Mohapatra, S., & Ratha, D. (2011). Migrant remittances in Africa: An overview. Washington DC: The World Bank.
- Ratha, D. (2013). The impact of remittances on economic growth and poverty reduction. Washington DC: Migration Policy Institute.
- Ratha, D., Mohapatra, S., Ozden, C., Plaza, S., Shaw, W., & Shimeles, A. (2011). Leveraging migration for Africa: Remittances, skills, and investments. Washington DC: The World Bank.
- Roodman, D. (2006). How to Do xtabond2: An introduction to “Difference” and “System” GMM in Stata. Washington DC: Center for Global Development.
- Ruyssen, I., & Rayp, G. (2014). Determinants of intraregional migration in Sub-Saharan Africa 1980–2000. The Journal of Development Studies, 50, 426–443. doi:10.1080/00220388.2013.866218
- Singh, R. J., Haacker, M., & Lee, K.-W. (2009). Determinants and macroeconomic impact of remittances in Sub-Saharan Africa. Washington DC: International Monetary Fund.
- Solimano, A. (2003). Workers remittances to the Andean region: Mechanisms, costs and development impact. Quito.
- UNICEF. (2013). Migration, mainstreaming, education and health, Draft 2B. New York City: Author.
- UNICEF. (2015). Regional overview: Sub-Saharan Africa. New York City: Author.
- Unites Nations(2017, December). United Nations, department of economics and social affairs, population division. Trends in International Migrant Stock. Retrieved July 28, 2018, from: http://www.un.org/en/development/desa/population/migration/data/estimates2/estimates17.shtml
- World Bank. (2018). World development indicators. http://databank.worldbank.org/data/reports.aspx?source=world-development-indicators
- WorldBank. (2006). The development impact of workers’ remittances in Latin America. Washington DC: The World Bank.
- WorldBank. (2008). Migration and remittance factbook. Washington DC: The World Bank.
- WorldBank. (2011). Migration and remittance factbook. Washington DC: The World Bank.
- WorldBank (2016a). Migration and remittances factbook. Washington DC: The World Bank.
- WorldBank. (2016b). Migration and remittances: Recent developments and outlook. Washington DC: World Bank.
- WorldBank (2017, April 15). World development indicators. Retrieved from http://databank.worldbank.org/data/reports.aspx?source=world-development-indicators#advancedDownloadOptions
- Zhunio, M. C., Vishwasrao, S., & P., C. E. (2012). The influence of remittances on education and health outcomes: A cross-country study. Journal of Applied Economics, 44, 4605–4616. doi:10.1080/00036846.2011.593499