
 ?Mathematical formulae have been encoded as MathML and are displayed in this HTML version using MathJax in order to improve their display. Uncheck the box to turn MathJax off. This feature requires Javascript. Click on a formula to zoom.
Abstract
The main objective of this paper was to establish which behavioural finance biases are associated with a certain level of risk tolerance and investor personality. Furthermore, the study aimed to indicate how these behavioural finance biases can influence investment decisions. Since behavioural finance is becoming more essential in the investment industry, further research within a South African context was regarded as necessary. Results indicated that investors with a low-risk tolerance level and a conservative investor personality are subject towards loss aversion and mental accounting biases. Investors with a high-risk tolerance level are mostly subject towards the self-control bias. The significance of this study will enable investment companies to more accurately profile their investors and to offer more refined investment options.
Public Interest Statement
Investors generally make financial decisions based on their personality and how much financial risk they are willing to tolerate. These same investors often deviate from their original investment decisions due to certain financial biases that drive these decisions. Up till now investment companies have only incorporated risk tolerance and investors personalities but have excluded behavioural finance biases due to a lack of quantifiable research. Understanding how different investor personalities make financial decisions and what bias drives these decisions will benefit both the investment company and the individual investor by minimising the risk and leaving more opportunity for higher returns.
1. Introduction
The degree of market efficiency is determined by the availability of information reflected in the prices of securities (Fama, Citation1970). Markets are neither strictly efficient nor strictly inefficient (Fahkry, Citation2016; Haugen, Citation2001). Therefore, Barberis and Thaler (Citation2002) are of the opinion that efficiency is where market prices are an unbiased estimate of the true value of an investment. The efficient market hypothesis (EMH) defines an efficient market as a market where new information is quickly and correctly reflected in the price of a security (Lim, Citation2011). Efficient markets have been empirically tested to determine if prices fully reflect particular subsets of available information. As a result, three forms of efficient markets were identified namely weak, semi-strong and strong form (Fama, Citation1970; Joo & Durri, Citation2015). The perfect market is known to reflect prices for resource allocation, thus enabling firms to make production investment decisions where investors can choose among securities that are representative of a firm’s activities (Fama, Citation1970).
It is believed by the EMH that irrationality on behalf of some investors, also called “noise traders”, will not have a remarkable influence on the overall functioning of the market as long as the majority of investors are rational (La Blanc & Rachlinski, Citation2005). It seems that irrational investors are likely to undertake more risk in the hope to be rewarded with higher returns. Thus, under the EMH a small group of irrational investors will probably have a small effect on market prices. As a result, the EMH claims that all securities are accurately priced, which restricts irrational investors to overpay for securities. The EMH states that irrespective of the beliefs and preferences of the investors, the price paid for securities is an efficient price that reflects the securities’ true value (Mak & Ip, Citation2017). However, it can be argued that the expectations of a large number of irrational investors grouped together can influence the market price of an asset (Fama, Citation1970). Fahkry (Citation2016) highlighted that issues regarding asset pricing cannot be addressed and resolved without referencing behavioural finance. One of the most known criticisms against the EMH is that market participants are more likely to be homo-sapiens than homo economics (Fahkry, Citation2016).
The above arguments gave birth to the concept of market anomalies. This concept exists when the change in the price of an asset cannot be associated with current market information or the release of new information. Normally anomalies occur either when a market is inefficient or if inadequacies exist in asset-pricing (Schwert, Citation2003). Keim (Citation2006) highlighted that it is specifically market anomalies that gave birth to the behavioural finance theory that is an influential factor in investment decisions. According to Joo and Durri (Citation2015) behavioural finance is based on the notion of “Bounded Rationality” which labels rational choices that includes the cognitive limitation of the decision-maker. In the event of rational decisions, limitations of human beings are a given that acts as boundaries to rational thinking patterns which results in bounded rational humans.
Investors should have an understanding of their own investment behaviour in the context of behavioural finance in order to enable them to select the most appropriate investment according to their risk personality (Kannadhasan, Citation2009; Kumari & Sar, Citation2017). Investor decisions based on stereotypes refers to the representativeness bias of behavioural finance. As a result, Kannadhasan (Citation2009) argues that some investors base investment decisions on inaccurate market participant perceptions and patterns. Moreover, investors tend to overreact in the market because of the perception of pattern repetition (Singh, Citation2012). Overconfidence is a result of investors who tend to overestimate their investment capabilities. Moreover, because of overconfidence, investors attempt to time the market in such a manner in order to outperform the market (Singh, Citation2012). Innumerable information is available to use in the market to base investment decisions on, but anchoring exists in the market when investors only rely on a single piece of information (Kannadhasan, Citation2009). Due to the propensity of investors to rely on a single piece of, mostly historical, information the adjustment to additional information tends to be relatively slowly.
A notion in the market exists that gamblers can outperform the market majority of the time. Gamblers fallacy is a result of “gambler” investors that inaccurately predict market movements and fail to outperform the market (Singh, Citation2012). Gambler investors are confident in their abilities to outperform the market and bet on the future trend of the market. Investment decisions based on only the most recent available information are classified in the availability bias category (Kannadhasan, Citation2009). Typically, these investors lack background information and tend to interpret current information incorrectly. Since investment decisions are based only on recent available information, they could possibly impede positive investment returns, which could simultaneously reflect in poor portfolio returns.
Investors reflect loss aversion when they mentally experience a given loss more drastically than a gain of the same size (Singh, Citation2012). As a result, different emotions, i.e. joy, anxiety, excitement are typically more experienced when gains and losses are realised. Moreover, investors tend to hold on to investments that deliver negative returns and will attempt to reduce losses by taking more risks. Regret aversion is a bias experienced by investors when realising errors were made in the judgement process of investors (Quiggin, Citation1994). This bias is evident when investors make investment decisions and regret certain steps in the decision-making process due to failure of delivering expected returns. Investors experience grief when returns are not realised due to underperforming investments, moreover investors also experience a feeling of guilt for making incorrect decisions. Zeelenberg and Pieters (Citation2007) state that investors will attempt to manage situations to avoid regret and be regret averse. Information related to specific events is grouped into specific compartments, which reflect the mental accounting bias. However, information can differ relating to specific events, which possibly affect behaviour more than the event itself (Jagongo & Mutswenje, Citation2014). Mental accounting can be explained with two scenarios: the first scenario is when an investor invests money and receives excessive returns and the second scenario is when an investor invests money and receives normal returns. The investor then typically compares the two scenarios and the reaction will be hesitant to dispose investments with normal returns. As a result, the excessive returns will motivate investors, due to the comparison between compartment information, to wait until higher returns are achieved. Regarding self-control, previous studies indicate that investors are subject towards temptation and attempt to exercise self-control in order to reduce temptations (Pompian, Citation2016).
The previous differs from a rational approach where investment decisions are based on market timing, forecasting or actual performance. During this process, it was observed that due to unrevealed reasons there was a major deviation between forecasted and realised returns. Extensive research proved the main reason for this deviation between forecasted and realised returns was inaccuracies in the decision-making process. Lintner (Citation1988) concluded that psychological factors contributed towards making inaccurate decisions. As a result, it is believed that psychology in terms of behaviour and personality plays a major role in determining the aggregate behaviour of the market. Therefore, behavioural finance is ultimately defined as “the study of how humans interpret and act upon on information to make informed investment decisions” (Lintner, Citation1988).
Therefore, the main objective of this paper was to establish a link between risk tolerance, investor personalities and behavioural finance biases. The aim is to determine which behavioural finance biases are associated with a certain risk tolerance level and investor personality. Furthermore, the study aims to indicate how these behavioural finance biases can influence investment decisions.
2. Literature review
Different types of investors are known in the market and investors are grouped typically by the different levels of risk that can be tolerated. Risk can be described as the potential difference between actual and expected income (Holton, Citation2004). The amount of risk investors can tolerate classify them into certain investor personalities: namely conservative, moderate, growth- or aggressive investors (Mak & Ip, Citation2017; Pompian, Citation2016). Optimistic investors are viewed as people that have higher risk and return expectations in contrast with people experiencing lower sentiment. Moreover, there is a relationship between sentiment-creating factors, individual mood and expectations regarding stock market returns. Such an investor tends to buy stocks rather than sell (Kaplanski, Levy, Veld, & Veld-Merkoulava, Citation2015).
Conservative investor’s place great emphasis on financial security while maintaining their wealth, whether inherited or risking their capital to build wealth (Oehler, Wendt, Wedlich, & Horn, Citation2018). Conservative investors tend to have a low-risk tolerance, which indicates that the risk appetite and capacity to take risk is low. Conservative investors, when being uncertain or uncomfortable, are slow when making decisions. These types of investors usually take care of their family and like to invest well in education and home ownership (APT Wealth Partners, Citation2014; Pompian, Citation2016). Conservative investors primarily seek to minimise investment risk and loss of capital. Moreover, these investors typically gain wealth through either inheritance or by investing in low-risk investment opportunities. A characteristic that stands out is the cautiousness to take on excessive risks (Bourse securities, Citation2016; Pompian, Citation2016). Therefore, the investment portfolio for these investors tends to be tedious due to the lack of, or slow reaction to, market changes. To conclude, conservative investors are those whose portfolio has greater expected return and less portfolio risk.
Moderate investors attempt to reduce risk and increase returns proportionately to seek higher long-term results. Unfortunately, this group of investors tends to lack investment knowledge and will follow the trends set by friends or colleagues (Bourse securities, Citation2016; Pompian, Citation2016). Moderate investors sometimes overestimate their risk tolerance and may even decide to put off their investment decisions without consulting professional advice. Only current popular investment options are considered for investment purposes. Moderate investors are sometimes difficult because they lack the joy or have no aptitude for the investment process (APT Wealth Partners, Citation2014).
Growth investors are known to have medium to high-risk tolerance levels and their behavioural bias orientation is cognitive (Pompian, Citation2016). Some growth investors are strong-willed and are independent. They like to trust their gut and not consult other people when making decisions but are not always competent when doing their own research. Growth investors are self-assured, often enjoy their investments and are comfortable when taking risks. As a result, these investors are willing to accept a portion of returns from irregular capital gains and are comfortable to take risks (Dow, Citation1998). To conclude, growth investors attempt to outperform the market to realise higher returns on investment portfolios (Oehler et al., Citation2018).
Characteristics associated with aggressive investors are the willingness-to-tolerate high risk and overconfidence in abilities (Bourse securities, Citation2016). Thus, a willingness exists to take substantial risk to maximise returns. In the chase for maximum returns, it is almost a given that the investment portfolios of aggressive investors will change regularly simply because there will be an effort to continuously include the highest rate of return investment options into the portfolio. Corter and Chen (Citation2006) found in their research that investors with high-risk tolerance scores tend to have higher-risk profiles.
3. Methodology
The following section describes the research instrument and research sample of the study.
3.1. Research instrument
A questionnaire was used to execute the quantitative approach consisting of three sections. The first section of the questionnaire contained a single risk tolerance question known as Survey of Consumer Finance (SCF). This validated question is a direct measure of risk attitude (Gilliam et al., Citation2010). The question is:
Which of the following statements comes closest to the amount of financial risk that you and your (husband/wife/partner) are willing to take when you save or make investments?
1. Take substantial financial risks expecting to earn substantial returns.
2. Take above average financial risks expecting to earn above average returns.
3. Take average financial risks expecting to earn average returns.
4. Not willing to take any financial risks.
The second section of the questionnaire is the behavioural finance biases question. Nine behavioural finance biases were transformed into statements and respondents were asked to rank the statements from most to least relevant. The third section of the questionnaire entails the Domain specific risk-taking scale (Dopsert) which measured investor personality. The original Dospert scale was developed in 2002 and was revised in 2006. The purpose of the 2002 Dospert scale was to assess risk preference through self-report in five constructs, namely financial (investment, gambling), health/safety, recreational (jumping off a bridge), ethical (passing off someone else’s work as your own) and social (admitting your tastes are different from those of a friend). A 7-point Likert scale was used to rate the questions ranging from (1) strongly disagree to (7) strongly agree. The 7-point Likert scale was preferred as it provides a greater variety of options, which results in increasing probability of achieving the objective reality of participants (Joshi, Kale, Chandel, & Pal, Citation2015). The Dospert scale of Weber, Blais, and Betz (Citation2002) was revised in 2006 (Blais & Weber, Citation2006). It is a shorter version (25% shorter) and more applicable to suit a broader range of ages, cultures and educational levels, and involves the five risk constructs as the Dospert scale of 2002. The Dospert scale of 2006 displays the following characteristics:
30 items rated two times each;
Rates the likelihood of engaging in a behaviour using the risk-taking scale using 7-point ratings (1 = extremely unlikely to 7 = extremely likely); and
Rates the perceived riskiness of a behaviour using the risk perception scale using 7-point ratings (1 = not at all risky to 7 = extremely risky).
The risk-taking responses of the 30-item version of the new Dospert scale effectively evaluates a person’s behavioural intentions or their likelihood to act or engage in risky situations/activities or behaviours. The risk-perception, on the other hand, evaluates respondents’ intuitive level assessment; that is how their risk-taking behaviour is measured by applying a 7-point rating scale. For the purpose of this study, the investment company used preferred to leave out items which might make their clients feel uncomfortable. Two items were identified and eliminated from the questionnaires: (1) drinking heavily at a social function and (2) engaging in unprotected sex under the health/safety construct. As a result, only 28 items were measured for risk-taking behaviours.
3.2. Research sample
The sample population included investors in general whereas the sample frame included investors making use of an investment company. The clientele of a South African investment company was used to collect the sample data for this study. This South African investment company is a South African financial services group, which are located in South Africa but also operates in various other countries. Some of the services/investments offered by this company typically include passive investments, wealth management, multi-management, capital management and international investments. The choice of company was based on convenience whilst the sample was selected in a random manner to ensure unbiasedness. Random participants were selected for this study that are located in South Africa which invest in this investment company’s offerings. The total sample has 1 171 participants (n = 1 171) of which the participants received the questionnaire online and completed the questionnaire out of own free will.
3.3. Hypothesis
The following hypotheses were formulated to achieve the primary objective:
Null hypothesis (: There are no significant differences between behavioural finance biases for Dospert/constructs.
Alternative hypothesis (: There is a significant difference between behavioural finance biases for Dospert/constructs.
3.4. Statistical analysis
The statistical analysis included descriptive statistics for the investor personality scale—Dospert. In order to have ensured internal consistency reliability a Cronbach’s test was also executed. A null hypothesis was stated in order to determine the statistical difference between behavioural finance biases and Dospert/constructs. The statistical differences were determined by undertaking an analysis of variance test (ANOVA) set at a confidence level of 95%.
4. Empirical results
Table represents the descriptive statistics for the Dospert scale in total. Clark and Watson (Citation1995) indicated the average inter-term correlation should be between 0.15 and 0.50, and for the Dospert scale the average inter-term correlation is between the advisable range. Moreover, the Dospert scale obtained a Cronbach’s α of 0.852 which is more than the recommended level of 0.6 (Malhotra, Citation2010). It can be concluded that the scale has internal consistency reliability. Content validity refers to the extent to which the instrument is really measuring the characteristic and whether it provides an adequate sample or items representing the concept (Kumar, Citation2005, p. 180; Neuman, Citation2014, p. 216). In this study, the researcher used the questionnaire as a validated instrument to measure investor behaviour in the South African context.
Table 1. Descriptive statistics for Dospert
Table represents the results obtained for statistical differences between Dospert/constructs and behavioural finance biases.
Table 2. Dospert/constructs and behavioural finance biases
From Table the ethical and financial construct has a significant difference value lower than 0.05 and as a result the null hypothesis ( is rejected for these two constructs and the alternative hypothesis (
concluded. This indicates that a statistical difference between behavioural finance biases and Dospert/constructs exist. The statistical differences found were further investigated with the Tukey HSD test in order to establish where the specific variances occur.
Table indicates the link between risk tolerance, investor personality and behavioural finance biases. Table therefore represents investor personality in terms of behavioural finance biases and risk tolerance levels.
Table 3. The relationship between risk level, investor personality and behavioural finance biases
For the Dospert scale and constructs mean values between 1 and 2.5 is categorised as low risk, >2.5–<4.5 as medium risk and ≥4.5–7 as high risk. Regarding the SCF, 1–2 is regarded as low risk, >2–<3 as medium risk and ≥3–4 as high risk.
Referring to Table , the loss aversion bias (μ = 1.989, std dev = 0.912) and mental accounting bias (μ = 2.474, std dev = 0.745) in terms of the Dospert scale had a low-risk level. The SCF scale provided opposite results as a medium-risk tolerance level for the loss aversion (μ = 2.920, std dev = 0.739) and mental accounting bias (μ = 2.700, std dev = 0.927).
Investors subject towards the representativeness bias had a medium level risk using Dospert ( = 3.246, std dev = 0.891). This concurs with the theory of Pompian (Citation2016, p. 8) as moderate/growth investors with a medium-risk tolerance are subject towards the representativeness bias. The mean risk tolerance score under SCF (
= 2.77, std dev = 0.950) indicates a medium-risk tolerance level which confirms the result of the Dospert scale. In terms of the overconfidence bias (
= 3.372, std dev = 0.877), gamblers fallacy (
= 3.456, std dev = 0.656) and availability bias (
= 3.209, std dev = 0.752), all of these biases had medium-risk tolerance levels relating to moderate-to-growth investor personalities. This is confirmed by the SCF with mean values between
= 2.600–2.900 indicating that a medium-risk tolerance level had been obtained. Dospert (
= 2.498, std dev = 0.795) indicated a medium-risk rating for investors subject towards the anchoring bias. The SCF (
= 2.730, std dev = 0.884) also has a medium-risk tolerance level. For the regret aversion bias, the Dospert scale (μ = 3.156, std dev = 0.841) had a medium-risk level. However, the SCF (μ = 3.130, std dev = 0.883) obtained a high-risk tolerance level for investors subject towards regret aversion. The self-control bias was the only bias with mean values greater than 4.5 indicating a very high risk level. The Dospert scale found a high-risk level (μ = 5.095, std dev = 1.713), while the SCF found (μ = 2.810, std dev = 0.791) risk tolerance scale slightly below a high-risk tolerance level.
5. Discussion
In order to achieve the main objective of this study, a framework was constructed to profile investors in terms of their level of risk tolerance, investor personality and behavioural finance biases. This was done by dividing investor personalities and a single risk tolerance scale into low-risk, medium-risk and high-risk levels according to each behavioural finance bias. Table represents the link created by both theory and analysis between these concepts.
Table 4. Linking risk tolerance, investor personality and behavioural finance biases
5.1. Low-risk tolerance
Investors with a low-risk tolerance level and conservative investor personality are subject towards the mental accounting bias. These investors will compartmentalise information before making any hasty investment decisions. This was confirmative research done by Jagongo and Mutswenje (Citation2014) who also found that conservative investors with low-risk tolerance levels can possibly be subject towards the mental accounting bias. Conservative investors with a low-risk tolerance level were also subject towards the loss aversion bias. These results supports prior research done by Pompian (Citation2016). These investor decisions will lead investors to keep investments that yield negative returns while hoping to reduce losses by taking on more risk (Singh, Citation2012).
5.2. Medium-risk tolerance
Conservative investors with a medium-risk tolerance level can be subject towards the anchoring bias. Pompian (Citation2016) confirmed that conservative investors are subject towards the anchoring bias. These investors are slow in making investment decisions since they hold on to a single piece of information and are slow to adjust to new information. As a result, from the sample and from theory, stated by Pompian (Citation2016), conservative investors tend to be more subject towards the anchoring bias. Investors subject towards the regret aversion bias were found to be mainly moderate investors associated with a medium-risk tolerance. This result is in agreement with Bourse securities (Citation2016) who found moderate investors subject towards the regret aversion bias to have a medium-risk tolerance level. Investors subject towards the regret aversion bias will make investment decisions in such a way as to avoid the regrets of past investment decisions (Quiggin, Citation1994).
Figure contributes to this study by providing a graphical representation of investor risk tolerance levels and investor personalities according to each behavioural finance bias as found by the results of this study.
Figure 1. Risk tolerance, investor personality and behavioural finance biases.
Source: Author compilation.
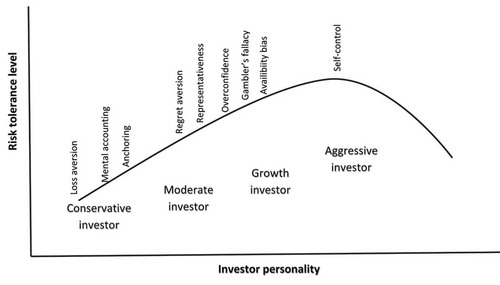
The representativeness bias, overconfidence, gamblers fallacy, and availability bias were all found to have similar results. Investors subjected towards these four behavioural finance biases were found to be moderate-to-growth investor with a medium-risk tolerance level. Pompian (Citation2016) also found that moderate-to-growth investors are subject towards the representativeness bias. This bias leads investors to make investment decisions based on stereotypes, inaccurate market perceptions and the perception of pattern repetition (Kannadhasan, Citation2009). Lake (2017) states that investors subject towards the overconfidence bias are usually aggressive investors; however, moderate/growth investors can also act like an aggressive investor. As a result, the overconfidence bias can possibly occur by moderate-to-growth investors. Overconfident investors aim to outperform the market by following their perceived superior market timing skills (Singh, Citation2012). This can lead to incorrect market timing and irrational investment decisions.
Lucarelli and Brighetti (Citation2011) also found that moderate-to-growth investors are subject towards the gambler’s fallacy. It can be concluded from theory and analysis that investors subject towards the gambler’s fallacy have a medium-risk level. These investors are so called “gambler” investors and believe they can outperform the market but leads to inaccurate market predictions and fail to outperform the market (Singh, Citation2012). Furthermore, Kannadhasan (Citation2009) and Abreu (Citation2014)also confirmed that moderate-to-growth investors can be subject towards the availability bias; as these investors base investment decisions only on recent available information. These investors decisions normally impede their positive investment returns and may negatively influence their investment portfolios. Pompian (Citation2016) stated that moderate-to-growth investors are subject towards these biases which leads moderate-to-growth investors to be medium-risk tolerant.
5.3. High-risk tolerance
Investors subject towards the self-control bias were the only investors to fall in the aggressive personality category according to the Dospert scale. Moreover, the SCF scale found investors’ subject towards the self-control bias to have a high-risk tolerant level. This concurs with the research of Pompian (Citation2016, p. 8) which stated that aggressive investors can experience the self-control bias. These investors are subject towards temptation and will exercise self-control when making their investment decisions.
6. Conclusion
The inclusion of behavioural finance within investor profiling are becoming eminent to financial companies. This paper aimed to profile investors with their level of risk tolerance, investor personality and behavioural finance biases to determine how investment decisions are made. The significance of this can contribute to the future process of accurate investor profiling. This paper placed investors with a certain risk tolerance level and personality in a category to be subject towards a certain behavioural finance bias. Hence, investment companies will be able to understand how investors make their financial decisions and what drives these decisions. Investors with a low-risk tolerance level and categorised as conservative investors were subject towards the loss aversion and mental accounting bias. These investors will tend to hold on too long to bad performing investments exposing themselves to more risk. Investment companies will have to ensure these investors do not attempt to reduce losses by taking on more risk.
Medium-risk tolerant investors were categorised as moderate-to-growth investors’ subject towards anchoring, regret aversion, representativeness, overconfidence, gamblers fallacy and the availability bias. Investors within this category will make investment decisions based on previous incorrect financial decisions. Financial managers will need to assist investors to use both present and historical information correctly when investing and not to cling onto one specific loss experienced. These investors also tend to make speculative decisions which could impede future returns. High-risk tolerance investors tend to be aggressive investors and were found to be subject towards the self-control bias. As a result, high-risk tolerance investors are often subject towards temptation and will need to exercise self-control with the assistance of the investment company to ensure that large losses are not incurred.
A graphical illustration was further produced as part of this papers contribution to the field of behavioural finance by linking risk tolerance, investor personality and behavioural finance biases. The conclusion was also made that investors do not make rational investment decisions since they were subject towards one or more behavioural finance bias. Further recommendations can be made to include behavioural finance in investors risk profiles as a clear link exists between investor risk tolerance levels, investor personality and how financial investment decisions are made. Future researchers can make use of a structural equation model (SEM) and incorporate other variables such as the demographics of investors to assist in the creation of a structural investor profile.
Conflict of interest statement
The authors have no relationship, financial or otherwise, with individuals or organisations that could influence the author’s work inappropriately and as such represents no conflict of interest.
Cover image
Source: Author.
Additional information
Funding
Notes on contributors
Zandri Dickason
Dr Zandri Dickason-Koekemoer and Ms Sune Ferreira
The researchers specialise in financial risk management having obtained their PhD and Master degrees in this field. Their main focus area is the financial risk tolerance of investors and studying these investors financial behaviour. These researchers have already published a few articles in accredited journals regarding this field of interest.
References
- Abreu, M. (2014). Individual investors‘ behavioural biases. Teaching economics working papers. ISSN No 2182-1.
- APT Wealth Partners. (2014). Investment risk profiles. Retrieved from http:///www.aptwealth.com.au/wp-content/uploads/2013/08/Investment-risk-profiles1.pdf
- Barberis, N., & Thaler, M. (2002). Mental accounting, loss aversion, and individual stock returns. The Journal of Finance, 56(4), 1247–1292. doi:10.1111/0022-1082.00367
- Blais, A., & Weber, E. U. (2006). A domain-specific risk-taking (DOSPERT) scale for adult populations. Judgment and Decision Making, 1(1), 33–47.
- Bourse securities. (2016). Bourse weekly review: Making the most with your US dollars. Retrieved from https://bourseinvestment.com/bourse-weekly-review-making-us-dollars/
- Clark, L. A., & Watson, D. (1995). Constructing validity: Basic issues in objective scale development. Psychological Assessment, 7(3), 309–319. doi:10.1037/1040-3590.7.3.309
- Corter, J. E., & Chen, Y. (2006). Do investment risk tolerance attitudes predict portfolio risk? Journal of Business & Psychology, 20(3), 369–381. doi:10.1007/s10869-005-9010-5
- Dow, C. G. (1998). Growth versus value investing. Falmouth: Dow Publishing.
- Fahkry, B. (2016). A literature review on behavioural finance. Journal of Economics Library, 3(3), 458–465.
- Fama, E. F. (1970). Efficient capital markets: A review of theory and empirical work. The Journal of Finance, 25(2), 383–417. doi:10.2307/2325486
- Gilliam, J., Chatterjee, S., & Grable, J. E. (2010). Measuring the perception of financial risk tolerance: A tale of two measures. Journal of Financial Counselling and Planning, 21(2), 30-43.
- Haugen, R. A. (2001). Modern investment theory (5th ed.). USA: Prentice Hall.
- Holton, G. A. (2004). Defining risk. Financial Analysts Journal, 60(6), 19–25. doi:10.2469/faj.v60.n6.2669
- Jagongo, A., & Mutswenje, V. S. (2014). A survey of the factors influencing investment decisions: The case of individual investors at the NSE. International Journal of Humanities and Social Science, 4(4), 92–102.
- Joo, B. A., & Durri, K. (2015). Comprehensive review of literature on behavioural finance. Indian Journal of Commerce & Management Studies, 6(2), 11–19.
- Joshi, A., Kale, S., Chandel, S., & Pal, D. K. (2015). Likert scale: Explored and explained. British Journal of Applied Science and Technology, 7(4), 396–403. doi:10.9734/BJAST/2015/14975
- Kannadhasan, M. (2009). Role of behavioural finance in investment decisions. Retrieved from http://dl4a.org/uploads/pdf/52.pdf
- Kaplanski, G., Levy, H., Veld, C., & Veld-Merkoulava, Y. (2015). Do happy people make optimistic investors? Journal of Financial and Quantitative Analysis, 50(2), 145–168. doi:10.1017/S0022109014000416
- Keim, D. B. (2006). Financial market anomalies. Retrieved from http://finance.wharton.upenn.edu/~keim/research/NewPalgraveAnomalies%28May302006%29.pdf
- Kumar, R. (2005). Research methodology: A step-by-step guide for beginners (2nd ed.). London: SAGE.
- Kumari, N., & Sar, A. K. (2017). Recent developments and review in behavioural finance. International Journal of Applied Business and Economic Research, 15(19), 235–250.
- La Blanc, G., & Rachlinski, J. J. (2005). In praise of investor irrationality. Retrieved from http://scholarship.law.cornell.edu/cgi/viewcontent.cgi?article=1020&context=lsrp_papers
- Lake, R. (2017). Dangers of being an overconfident investor. https://money.usnews.com/investing/articles/2017-06-13/the-dangers-of-being-an-overconfident-investor Date of access: 12 October 2017
- Lim, K. (2011). The evolution of stock market efficiency over time: A survey of the empirical literature. Journal of Economic Questionnaires, 25(1), 96–108.
- Lintner, G. (1988). Behavioural finance: Why investors make bad decisions. The Planner, 13(1), 1–7.
- Lucarelli, C., & Brighetti, G. (2011). Risk tolerance in financial decision making. UK: Palgarave Macmillan.
- Mak, M. K. Y., & Ip, W. H. (2017). An exploratory study of investment behaviour of investors. International Journal of Engineering Business Management, 9(1), 1–12. doi:10.1177/1847979017711520
- Malhotra, N. K. (2010). Marketing research: An applied orientation (6th ed.). New Jersey: Pearson Education Limited.
- Neuman, W. L. (2014). Social research methods: Qualitative and quantitative approaches (7th ed.). Boston: Pearson Education.
- Oehler, A., Wendt, S., Wedlich, F., & Horn, M. (2018). Investors’ personality influences investment decisions: Experimental evidence on extraversion and neuroticism. Journal of Behavioural Finance, 19(1), 30–48. doi:10.1080/15427560.2017.1366495
- Pompian, M. M. (2016). Risk profiling through a behavioural finance lens. Virginia, Charlottesville: CFA Institute Research Foundations.
- Quiggin, J. (1994). Regret theory with general choice sets. Journal of Risk and Uncertainty, 8(2), 153–165. doi:10.1007/BF01065370
- Schwert, G. W. (2003). Anomalies and market efficiency. Handbook of Economics and Finance, 1(2), 939–974.
- Singh, S. (2012). Investor irrationality and self-defeating behaviour: Insights from behavioural finance. The Journal of Global Business Management, 8(1), 116–122.
- Weber, E. U., Blais, A. R., & Betz, N. E. (2002). A domain-specific risk-attitude scale: Measuring risk perceptions and risk behaviors. Journal of Behavioral Decision Making, 15(4), 263–290. doi:10.1002/bdm.414
- Zeelenberg, M., & Pieters, R. (2007). A theory of regret regulation. Journal of Consumer Psychology, 17(1), 3–18. doi:10.1207/s15327663jcp1701_3