
 ?Mathematical formulae have been encoded as MathML and are displayed in this HTML version using MathJax in order to improve their display. Uncheck the box to turn MathJax off. This feature requires Javascript. Click on a formula to zoom.
Abstract
Taking a sample of seasoned equity offerings (SEOs) by firms listed on Bombay Stock Exchange (BSE) from the year 1992 to 2012, we examine two of the key issues concerning SEOs. First, whether SEOs are underpriced, issued at a price lower than the prevailing market price; and second, whether companies time their issues. Study of 162 SEOs exhibits significant underpricing at 1% significance level leading us to conclude that SEOs in India are significantly underpriced. Analysis of abnormal returns for 114 SEOs taking different event windows surrounding issue opening dates reveals that, except for the −1 to + 1 event window, CAAR for all other event windows are significantly negative. This leads us to conclude that investors in India experience significantly negative abnormal returns surrounding SEO issue opening. Overall, findings of the study reveal that SEOs in India are underpriced and that there exist windows of opportunity for SEOs in India.
JEL classification:
PUBLIC INTEREST STATEMENT
Seasoned equity offering (SEO) is a method of raising equity capital by issuing shares to the public, usually at a price below the prevailing market price, by firms already listed on the stock exchanges. In India, it is called Follow-on Public Offerings (FPOs). It is common that when companies go public through initial public offerings (IPOs), shares issued through these IPOs generally experience two kinds of anomalies—underpricing and long-run underperformance. If the price quoted on the listing day, especially the closing price, is significantly higher than the issue price, it is called underpricing. Similarly, if the long-run return with listing day closing price as the base is negative, it is called underperformance. In this study, we examine the presence of windows of opportunity for SEOs taking a sample of 162 SEOs announced by firms listed on Bombay Stock Exchange (BSE), India, during the years 1992 to 2012. We also examine whether there have been abnormal returns surrounding the SEOs.
1. Introduction
It is a well-documented phenomenon that when companies go public through initial public offerings (IPOs), shares issued through these IPOs generally experience two kinds of anomalies—initial underpricing and long-run underperformance. When the price quoted on the listing day, especially the closing price, is higher than the offer price, it is termed as underpricing [Ritter (Citation1984), Beatty and Ritter (Citation1986), Muscarella and Vetsuypens (Citation1989), Levis (Citation1993), Amihud et al. (Citation2003), Derrien and Womack (Citation2003)]. However long-run returns, computed with listing day closing price as the base, have been negative which is termed as underperformance [Aggarwal and Rivoli (Citation1990), Ritter (Citation1991), Loughran (Citation1993), Loughran and Ritter (Citation1995)]. Such long-run underperformance of IPOs indicates a phenomenon of timing the IPOs by the companies. Timing in the issue involves making the public issue when the companies are overvalued and when the market is excessively optimistic about the prospects of such companies. Eventually, when the market realises this, the same shares underperform in the long run.
SEO is a method of raising equity capital by issuing shares to the public by firms that are already listed on the stock exchange. In India, it is called Follow-on Public Offerings (FPOs). Timing of issues is not just a phenomenon limited to IPOs alone; even the listed companies, when they approach capital market with SEOs, do so when they are overvalued or when there exists information asymmetry. If the firms succeed in getting a better price for their shares, they are said to have taken advantage of prevailing “windows of opportunity” (Bayless and Chaplinsky (Citation1996), Lee (Citation1997), Clark, Dunbar, and Kahle (Citation2004)). According to Bayless and Chaplinsky (Citation1996), certain periods offer “windows of opportunity” in which capital can be raised at favourable terms. Investment Dealer’s Digest (21 March 1991, p.10) quotes Richard Smith, syndicate manager at Montgomery Securities: “There’s an attitude on Wall Street that the window is generally open for a short time; it’s been closed for so long”. Smith adds that the fear of missing the window could force many companies into the market. Knowing that issuers time when they are overvalued, market reacts negatively to the announcement of SEOs. This is evident from the results obtained for event windows of varying lengths surrounding the announcement of SEOs [Asquith and Mullins (Citation1986), Korajczyk, Lucas, and McDonald (Citation1991), Jain (Citation1992)]. The present study tests the existence of such windows of opportunity for SEOs issued in India by taking event windows of varying lengths.
Following the abolition of Controller of Capital Issues (CCI) and the introduction of free pricing of public issues in 1992, many public issues hit the capital market in India. During the period 1993–1996, over 3,500 public issues (this includes IPOs, SEOs, and offer for sale) raised more than Indian Rupees 32,000 crore (one crore is equal to 10 million) from the market (Prime Database (2013)). During the regime of National Democratic Alliance (NDA) from 1999 to 2004, the federal government in India had initiated the disinvestment process in public sector undertakings (PSUs) by creating a separate disinvestment ministry in the union cabinet. In addition, capital market in India during the post-2000 decade witnessed several major developments. Therefore, the two-decade period spanning over 1992–2012 provides us an ideal period to study two of the key issues concerning SEOs in India. First, whether SEOs in India are also underpriced just as IPOs; second, whether issuers in India time seasoned their equity issues.
This research adds to the existing literature in many ways. First, it provides further empirical evidence on two of SEO anomalies—underpricing and the presence of windows of opportunity. Results of our study show that SEOs in India are significantly underpriced, and there exists windows of opportunity for SEOs. Second, it helps prospective investors to develop investment strategy surrounding SEOs.
In addition, all previous studies on SEO underpricing and the presence of windows of opportunity for SEOs focus on developed capital markets, especially the USA. To the best of our knowledge, ours is the first work on pricing of SEOs in India. In the present study, we use both the measures of SEO underpricing and test their significance. Further, except Ghosh, Sirmans, and Nag (Citation2000), other studies have used only raw measure of SEO underpricing; while in our study, we even adjust the raw underpricing measure to corresponding market movement.
The paper is structured as follows: Section 2 presents a review of literature and formulates hypotheses; Section 3 describes sample and methodology; Section 4 presents and analyses the results; and Section 5 provides conclusions.
2. Review of literature and hypotheses
The research works on SEOs focus mainly on two issues. First, whether the SEO issues are made at a discounted price, a price below the existing market price. Second, whether firms can time their issues to take advantage of windows of opportunity.
Ghosh et al. (Citation2000) report underpricing of SEOs using both the measures—close-to-offer and offer-to-close. They use real estate investment trust (REIT) SEOs in their study and have found that underpricing of SEOs depends on institutional ownership of firm’s common stock; SEOs by firms where institutional ownership is high (greater information asymmetry) are more underpriced. They also report that SEO underpricing is a function of issue size and underwriter reputation. Corwin (Citation2003) reports that SEO underpricing has gradually increased across the decades of 1980s and 1990s. Further, he also finds that SEO underpricing is positively related to the level of uncertainty about firm value.
Investigating whether auditor change is associated with the pricing of SEOs in the USA, Kim and Park (Citation2006) find that SEO companies switching their auditors just before the issue opens experience more underpricing, on average, than do other SEO firms which do not change their auditors. Using the alternative measure of SEO underpricing (close-to-offer) which is also called “offer discount”, study reports similar findings. Safieddine and Wilhelm (Citation1996) document −0.55% and 0.52% of SEO underpricing using close-to-offer and offer-to-close measure, respectively.
Testing whether timing of equity issues is associated with any favourable news about the firm, Korajczyk et al. (Citation1991) find that earnings release prior to an equity issue convey unusually good news about the issuing firm. With earnings releases used as a proxy for reliable information about the issuing firms, the study documents that equity issues tend to follow good earnings releases. Study also documents stock price decline upon announcement of equity issue and the magnitude of such decline is found to be increasing since the previous information release. Loughran and Ritter (Citation1997) also document that firms use operating performance to convey their quality and time their issues when their operating performance peaks; firms that issue equity show improvement in profitability prior to the offering and after the issue profitability declines. The post-issue decline in operating performance results in low post-issue stock returns. Such a finding of the study is similar to Loughran and Ritter (Citation1995) who document that stocks of firms issuing SEOs underperform by 8% per year and Asquith and Mullins (Citation1986) who find that equity issues reduce stock prices significantly and that equity issues are perceived by the market as negative signals.
However, Friday, Howton, and Howton (Citation2000) report better median operating performance for SEO firms than for the industry in the year before and in the 3 years following the SEO. Such a finding contradicts Loughran and Ritter (Citation1997) who argue that due to asymmetric information between shareholders and managers, managers can time equity issues with future declines in operating performance which the market cannot anticipate. Findings of Friday et al. also contradict Myers and Majluf (Citation1984) information asymmetry model that stock price changes will be negative following SEO announcements and the negative price reaction could be caused either because of declining operating performance or because of changes in the perceived risk of the issuing firms.
Computing announcement period abnormal returns (APARs) and testing whether issuers time their issues, Denis (Citation1994) finds positive relation between ex-ante measures of growth opportunities and APARs for SEOs in the USA indicating that issuers in the USA time their issues when their prospects look good. Cornett, Mehran, and Tehranian (Citation1998) find that post-issue stock performance of banks depends on whether the issue is voluntary or otherwise. Banks that voluntarily issue SEOs experience significantly negative two-day APARs of equity issue; decline in post-issue operating performance 3 years following issue; and significantly negative benchmark firm-adjusted stock returns over the 3-year post-issue period. Clark et al. (Citation2004) find negative and significant 3-year and 5-year post-issue abnormal returns. While the decline in post-issue operating performance for SEOs made by insiders is significant, it is not found to be significant for the non-insider group.
Overall, above studies indicate that SEO firms time their issues and try to take advantage of windows of opportunity. Knowing the fact that issuers time their issues to take advantage of windows of opportunity, market reacts negatively for the announcement of SEOs. This is evident from the post-issue negative or low stock returns documented by different researchers.
However, there are also evidences that issuers do not time their issues. Contrary to the signalling model of John and William (Citation1985) which suggests that dividends are used to signal firm value so that issuers can raise capital at more favourable terms, Loderer and Mauer (Citation1992) find no evidence for US SEOs that managers rely on dividends to get higher prices. Further, Healy and Palepu (Citation1990) also find no post-issue operating performance decline which means issuers do not time their issues when their operating performance peaks.
In India, a few studies have been conducted on pricing and performance of IPOs. However, studies on SEO pricing have not taken place to the best of our knowledge. About studies on IPOs, in-line with international finding of underpricing, Narasimhan and Ramana (Citation1995) find significant underpricing of Indian IPOs. They also find that premium issues are more underpriced than par issues. Using a sample of 386 Indian IPOs that went public between July 1992 and December 1994, Krishnamurti and Kumar (Citation2002) find that underpricing in India is severe for risky (par-value) issues. Examining the factors responsible for IPO underpricing, study finds that absence of mechanism in assessing the degree of demand from potential investors, pricing restrictions by regulatory authority on new firms having no track record, and the time gap between the approved date and the actual opening date of the issue are the potential factors contributing for IPO underpricing in India. Ghosh (Citation2005) studies underpricing phenomenon of 1,842 IPOs of Indian companies that got listed on BSE between 1993 and 2001. The study finds some support for the signalling theory of IPO underpricing, which states that high-quality firms deliberately underprice their IPOs to convey their quality so that they can re-visit capital market with SEOs at a higher price, subsequently. The study finds that IPOs with larger issue size, belonging to business groups, are more underpriced than their stand-alone counterparts and, subsequently, such firms raise more funds from the market. Chaturvedi, Pandey, and Ghosh (Citation2006) find that the extent of oversubscription determines underpricing of an IPO; oversubscription, in turn, depends on market index during the time of IPO, type and nature of business, foreign collaboration and tracks record of promoters/company. Garg, Arora, and Singla (Citation2008) also document that IPOs in India are significantly underpriced; they have also noted that the level of underpricing does not vary much in the hot and cold IPO market. Bora, Adhikary, and Jha (Citation2012) find underpricing of 21.42% and 18.22% for fixed-price and book-built IPOs, respectively. However, when adjusted for market movement, they did not find a significant difference in underpricing for the two categories with figures of 16.71% and 16.75%, respectively.
Analysing the long-run performance of IPOs in India, Madhusoodanan and Thiripalraju (Citation1997) find that IPOs in India offered positive returns in contrast to international findings. They also find underpricing in the short run which is in-line with international findings. Using buy and hold abnormal return (BHAR) measure, Sehgal and Singh (Citation2007) find that long-run returns for IPOs in India have been negative between 18 and 40 months of holding; while CAAR measure exhibited the presence of underperformance in the second and third years. More recently, using samples of 365 book-built and 99 fixed-price IPOs, Hawaldar, Kumar, and Mallikarjunappa (Citation2018) find that though IPOs in India that went public between 2001 and 2015 are underpriced, book-built IPOs are underpriced by lesser magnitude when compared to fixed-price IPOs. About long-run performance, study finds that book-built IPOs are associated with negative CAARs up to five years and beyond; while fixed-price IPOs turn positive after one and a half year and continues to be positive thereafter.
The studies on SEOs discussed above investigate whether issuers of SEOs take advantage of windows of opportunity. Many of these studies focus on whether issuers time their issues when their operating performance peaks. In the present study, though we do not test whether companies in India time their issues when their operating performance peaks, we study whether issuers time their issues and take advantage of windows of opportunity by computing stock returns for varying event windows surrounding SEO issues. Overall, in the present study, we test the hypotheses that SEOs in India are underpriced and that there exist windows of opportunity for the issuers of SEOs in India.
3. Sample and methodology
3.1. Sample and data
The total number of SEOs in India for the period 1992 to 2012 is found to be 198 according to Prowess, the corporate database of Centre for Monitoring Indian Economy (CMIE) Private Limited. For the present study, the sample of SEOs and the relevant data are compiled from two main databases: First, for the years 1992 to 1999, the New Issue Monitor column of various issues of the Capital Market magazine is referred. This source provides information about SEOs that are going to be floated during the forthcoming fortnight along with information like face value, issue price, number of shares offered, issue size, and issue opening and closing dates. Next, for the years 2000 to 2012, the database from the Changes in Debt and Equity Capital section of the Prowess is referred. On referring to these two databases, however, relevant information like offer price or market price on issue opening day was not available for 36 SEOs. Therefore, matching the two databases provides us a sample of 162 SEOs announced by 162 firms listed on BSE for the study period of 1992 to 2012. The SEO issue opening date is taken as the 0th day. Daily prices are collected for SEO issues considering a window period of −30– + 30 (61 days event window surrounding SEO issue opening) and an estimation period of 250 trading days, i.e. −31–−280 days prior to SEO issue opening.
3.2. Measuring of SEO underpricing
Underpricing/overpricing of SEOs is measured using two measures. Corwin (Citation2003) uses close-to-offer (R0) measure, and Kim and Park (Citation2006) use offer-to-close (R1) measure. Safieddine and Wilhelm (Citation1996), and Ghosh et al. (Citation2000) use both measures in estimating SEO underpricing. In the present study, we use both the measures:
Close-to-offer (R0) measure of SEO underpricing for security i is:
where Pi0 is the SEO offer price, and Pi-1 is the closing price of the security i on the day prior to SEO opening.
Market-adjusted measure of SEO underpricing (ARi0) for each issue:
Offer-to-close (R1) measure of SEO underpricing:
where Pi1 is the closing price of security i on the SEO opening day.
The market-adjusted measure of underpricing (ARi1) is computed as:
where Pm1 is the closing index of the market on the SEO opening day. Market-adjusted underpricing under both the measures are estimated using BSE-100 index returns.
The average raw and market-adjusted SEO underpricing for both the measures for the entire sample:
where is the average underpricing for the sample of SEO firms; Ri is the underpricing of stock i; and n is the sample size. To test the statistical significance of average SEO underpricing under both the measures, we use t-test.
An understanding of the two measures of underpricing and analysis of the results obtained from these measures is required. In close-to-offer measure, the base (denominator) in computing underpricing is closing price on the previous day (Pi-1), while in offer-to-close measure, the base is the offering price (Pi0). Further, in the case of close-to-offer, a negative measure means that SEOs are underpriced; while in the case of offer-to-close, a positive measure means underpricing. For example, studying 328 secondary offerings of firms listed on NYSE and AMEX for the period 1971–1975, Smith (Citation1977) reported a negative return of 0.54% based on close-to-offer measure and a positive return of 0.82% offer-to-close measure. Also, Corwin (Citation2003) and Safieddine and Wilhelm (Citation1996) report -2.21% and -0.55% of SEO underpricing, respectively, using close-to-offer measure.
3.3. Abnormal returns surrounding SEO issue opening
We follow event study methodology to analyse the abnormal returns on stock prices surrounding the opening of SEO issues. In computing APARs surrounding SEOs, the day when SEO was first announced is taken as the 0th day. For example, searching Wall Street Journal Index for announcement of security offerings, Cornett et al. (Citation1998) used these dates of SEO announcements as the initial announcement date. However, in our study, as the first announcement date of SEOs in India was not available, we have taken the issue opening day as the 0th day. Therefore, the event period is centred around the issue opening date of the SEOs and is designated as the 0th day. Previous studies have considered different event window periods to study the impact of a given corporate event on its stock returns. For example, Brown and Warner (Citation1985) use 11-day event window (-5 to + 5) to analyse daily stock returns. In this study, we use an event window of 61 days; 30 days before the opening of SEO issue and 30 days after the opening of SEO issue, zero being the SEO issue opening day. Underpricing of SEOs is estimated using offering price and closing price either on the previous day or on the issue opening day. However, abnormal returns surrounding SEO issue opening are the excess of actual return over expected return. Significance of abnormal returns surrounding the SEO issue opening during the window period is tested using t-test. The parameters are estimated using an estimation period of 250 days: starting from day -280 up to -31 day from SEO issue opening date (0th day).
In event studies, we normally assume that the data are independently and identically distributed (ibid). In practice, this assumption may be violated but as opined by MacKinlay (Citation1997, p. 17) While this assumption is strong, in practice it generally does not lead to problems because the assumption is empirically reasonable and inferences using the normal return models tend to be robust to deviations from the assumption.
We estimate underpricing of SEOs using a sample of 162 SEOs. However, while computing abnormal returns surrounding SEO issue opening, we find that complete set of required data is not available for 48 of these SEOs either for the event windows or for the estimation period or relating to the market index, i.e. BSE-200 index for the relevant time period. This leaves us a sample of 114 SEOs for the computation of APARs surrounding SEO issue opening.
The market model is given by the following regression equation:
where
α is intercept. (Mean return over the period not explained by the market),
Rjt is the expected return on security j for day t,
Rmt is the expected market return for day t,
βj is the slope of the regression and,
ejt is the error term (with a zero mean and constant standard deviation)
The predicted return represents the return that would be expected if no event took place. The predicted return for a firm for a day in the event period is given by the following market model:
where Rmt is the return on the market index for day “t” in the event period.
The log returns during the estimation window and the event window are calculated using the equation . Rjt is the daily return on security “j” on day t, Pjt is the daily adjusted price of the security “j” at the end of day “t”, Pjt-1 is the daily adjusted price of the security “j” at the end of day “t-1”. The market returns are calculated using the similar equation.
The abnormal return is the difference between the actual return on day t and the predicted return by the market model using the parameters from the estimation window, i.e.
The residual ARjt represents the abnormal return, i.e. the part of the return that is not predicted and is, therefore, an estimate of the change in firm’s share price on that day which is caused by the SEO issue opening.
Abnormal returns are averaged across firms (j = 1 to N) to produce average abnormal return for day t using the following formula,
where AARt is the average abnormal return on event day t and N is the number of firms in the sample. Using the AAR, we compute cumulative average abnormal return (CAAR) for the event period. The CAAR values represent the average total effect of the event across all firms for different time periods in the event window. CAAR is given by:
We use Z-test to examine the statistical significance of the AARs, CAARs and the hypothesis that the abnormal returns surrounding the event is zero.
3.3.1. Testing the significance of the AARS and the CAARs
The excess returns are standardised before they are aggregated, and the standardised aggregates form the basis of the test statistics. For each security “j”, the excess return (ARjt) or the prediction error (PEjt), for each of the days in the event window is standardised by dividing the ARjt by the standard deviation, (Sjt) of the abnormal returns during the estimation period to yield a standardised excess return, SERjt.
The standardised excess return (SER) is computed as:
where
where T is the number of days in the estimation period
In the present study, the number of days in the estimation period is 250 (-31–-280)
The test statistic for any given day for N companies would be:
where
N denotes the number of companies in the study,
SERjt is the standardised PE for firm “j” on day “t”,
The standardised cumulative excess returns for firm “j” is the sum of the SERj among any periods of interest, adjusted for the number of days (M) being considered, starting at t1 and ending at t2 and is computed as:
where t = −30 …0… + 30 days
The test statistic for N firms is the sum of the SCERj divided by the square root of the number of firms:
where N is the number of firms.
4. Analysis of the results of the study
Before we analyse the results of our study, an understanding of the characteristics of the firms taken for the study is necessary. These characteristics are presented in the form of summary statistics in Table .
Table 1. Summary statistics for different variables of 162 SEO firms listed on BSE
Summary statistics of the five variables—market capitalisation, earnings per share (EPS), price-earning (PE) ratio, price-to-book (PB) ratio, and issue size—for the sample SEO firms is given in Table . In our sample of SEO firms, no firm has more than one SEO during the study period, i.e. no SEO firm has made multiple visits to the capital market during the period 1992–2012. The 162 SEOs are from exactly 162 firms. Our SEO sample ranges from small-sized private-sector entities to big-sized public-sector giants. This is evident from the fact that market capitalisation of SEO firms ranges from Rs.53 million (Natco Polyplast Ltd. in the private sector) to Rs.17,29,898 million (National Thermal Power Corporation Ltd, a public-sector giant). Similarly, the issue size varies from Rs.15 million (Indian Seamless Financial Services Ltd in private sector) to Rs.99,672 million (National Mineral Development Corporation in public sector). The highest EPS of 171 is for State Bank of Bikaner and Jaipur, once again a state-owned public sector bank. Overall, the firm characteristics in the sample show that there is a wide variation across the sample firms, and this needs to be considered as a caution while concluding.
4.1. Underpricing of seasoned equity offerings (SEOs)
As mentioned in Section 3.2, according to close-to-offer measure, negative-computed return indicates that SEOs are underpriced; while according to offer-to-close measure, positive-computed return indicates that SEOs are underpriced. Table shows underpricing using two measures for 162 SEOs.
Table 2. Underpricing of 162 firms listed on BSE that issued SEOs from years 1992 to 2012
The results presented in Table reveal that using close-to-offer return measure, the raw SEO underpricing has been −23.34%. The market (BSE-100) close-to-open return considering the event days has been 2.95% (not shown in Table ) leaving us with market-adjusted underpricing of −26.29%. However, a word of caution is required while considering this measure of SEO underpricing. Due to the nature of data available from Prowess database, for some of the SEOs, the day before SEO opening has been several days before SEO opening. For instance, the available price data for day before SEO opening have been more than 1 month for 13 SEOs; the highest gap between issue opening day and the day before issue opening being 3 years 10 months and 25 days for one SEO. When close-to-offer underpricing is recomputed excluding these 13 SEOs, the raw and BSE-100 adjusted measures have been −29.30% and −30.09%, respectively. The BSE-100 market return is 0.79% when recomputed excluding the 13 SEOs. For both the samples, raw as well as market-adjusted measures of SEO underpricing are significant at 1% level.
Next, using offer-to-close measure, the SEO underpricing has been 74.54% when not adjusted for market movement, and 74.57% when adjusted for market movement using BSE-100. Using this underpricing measure also, the market-adjusted return has been slightly more than raw measure. This is, again, because while the average closing price on the SEO opening day has been more than the issue price, the closing market index has been lower than the opening index on the SEO opening day, on an average. Considering the event days, the corresponding BSE-100 open-to-close return has been −0.03%. Underpricing computed using this measure also is found to be significant at 1% level. Overall, using both the measures, close-to-offer and offer-to-close, we find that SEOs issued in India during the period 1992–2012 are underpriced and the magnitude of underpricing is highly significant. This leads us to accept the first hypothesis that SEOs in India are significantly underpriced.
Since the offer-to-close underpricing appears unusually high at 74.57%, we recomputed this measure of underpricing, both raw and BSE-100 adjusted, by excluding SEOs with unusually high returns. When SEOs with more than 1000% underpricing are excluded (two such SEOs are found), the raw and market-adjusted underpricing for the remaining 160 SEOs are found to be 56.72% and 56.75%, respectively. When SEOs with more than 400% underpricing are excluded (three such SEOs are found), revised raw and market-adjusted underpricing figures for the remaining 159 SEOs are 54.56% and 54.59%; when SEOs with more than 200% underpricing excluded (five such SEOs are found), raw and market-adjusted underpricing figures for the remaining 157 SEOs are 51.87% and 51.9%; and, finally, when SEOs with more than 100% underpricing are excluded (26 such SEOs are found), the raw and market-adjusted underpricing measures for the remaining 136 SEOs are 36.88% and 36.94%, respectively. All these revised measures are also found to be significant at 1% level.
Further, we have segregated SEOs into seven classes based on their market-adjusted underpricing measures. Table provides the frequency distribution of total SEOs based on their offer-to-close underpricing measures.
On analysing Table , we find that the largest number of SEOs (55) belong to the sub-group of less than 30% underpricing. This class has a modest market-adjusted underpricing of 9.06%. Another 36 SEOs (third largest sub-group) belong to the class of 30% to 50% underpricing with an average underpricing of 39.18%. The unusual underpricing of 74.57% for the whole sample is mainly contributed by two SEOs with an average underpricing of 1500%; three SEOs with an average underpricing of 310.94%; and 21 SEOs with an average underpricing of 148.79%.
The finding that SEOs in India are significantly underpriced is of special interest because unlike IPOs, SEOs are already listed and have a track record of prices listed on the exchanges. Despite this, issuers of SEOs in India underprice their issues.
4.2. SEO issue opening period abnormal returns
Although underpricing was computed using 162 SEOs, due to reasons mentioned earlier, APARs around SEO issue opening is computed using 114 SEOs. The study examines abnormal returns around SEO issue opening day for the sample of SEOs during the study period of 1992–2012. SEO issue opening period PEs are estimated using the standard market model procedure by taking BSE-200 market index with parameters estimated over a 250-trading day estimation period starting from day −31 up to day −280 from the SEO opening day. The study uses 61 days event window period, i.e. day −30 to day + 30 with SEO issue opening day as the 0th day. Significance tests are conducted using standardised PEs. Further evidence on CAAR significance is provided with confidence band (CB) for CAAR at 95% level of significance. Relevant upper and lower bands for CAAR value on day t in the event period is computed using CAAR on day t, Z table value and standard error (SE). The relevant equation is
and
, where M is the number of days used in cumulating AAR to arrive at CAAR.
Table presents the AARs and CAARs along with Z values for the 61-day event window period surrounding SEO issue opening and confidence band at 95% for the CAARs for 114 SEOs during the period 1992–2012.
Table 3. Frequency distribution of SEOs according to offer-to-close underpricing
Table 4. AARs, CAARs, Z-Values for the 61-days event window surrounding SEO issue opening along with confidence band at 95% for the CAARs for 114 SEOs
An analysis of Table and Figure reveals that under the market model, AARs are positive for 14 days and negative for 16 days before the SEO issue opening. After the issue opens, they are positive for 7 days, and negative for 23 days, while on the issue opening day, the AAR is positive. For the event window of 61 days, AARs are positive for 22 days and negative for 39 days. Of the negative AARs before the SEO opens, four are significant at 5% level and, of these, only one is significant at 1% level. Among the negative AARs after the issue opening, 12 are significant at 5% level and, of these, eight are found to be significant at 1% level also. The presence of negative AARs, especially after the SEO issue opening, reveals negative share price movement after the SEO issue opening. Such a movement tends to confirm that firms take advantage of “windows of opportunity” by issuing equity when they are overvalued and, knowing this, market reacts negatively for the SEOs by such issuers. Such a finding of the study is comparable with that of Jain (Citation1992) who documents that equity issues are made after firms experience relatively “good times” and that the announcement of equity issues conveys negative information about earnings; Bayless and Chaplinsky (Citation1996) and Clark et al. (Citation2004) who have reported APARs consistent with the market interpreting the news of issue of shares by insiders with access to better information regarding firms’ prospects more negatively; and Lee (Citation1997) who finds that top executives sell their shares before the SEOs underperform which is, again, consistent with asymmetric information where managers with superior information about the firm have an incentive to issue overvalued equity and, consequently, the stock price of issuing firm drops on the announcement of new issue.
Figure 1. AARs, CAARs, Upper and Lower confidence band (CB) Values for CAARs during the 61-days event window surrounding SEO issue opening for 114 SEOs.
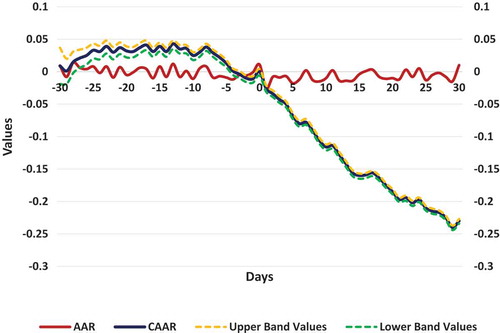
CAARs are positive for most of the days before the issue opening. Four days prior to the issue opening, the positive CAAR turns into negative and this continues for the remaining post-issue opening event window. Among the negative CAARs for the event window, 28 are significant at 5% level. Of these 28, 25 are significant at 1% level also. Figure clearly depicts the behaviour of CAAR surrounding the opening of the SEO issues. The CAAR has been positive for most part of the event window before the opening of the SEO issues. A few days before the issue opening, the positive CAAR turns into negative and then onwards, the negative performance of CAAR intensifies for the remaining part of the event window.
We have earlier mentioned in Section 3.3 that due to lack of information as to when SEO was first announced, we have taken SEO issue opening as the 0th day. However, on analysing Table , we find that CAAR turns negative ahead of SEO issue opening (4 days before issue opening, to be specific) and this negative return continues thereafter. This is a clear indication that market started reacting negatively ahead of issue opening and that information about the issue opening had already been reflected in the market price of securities. Future studies on APARs for SEOs could be focused by taking first announcement date of SEOs as the 0th day.
Table and Figure present the AAR, CAAR and confidence bands for CAARs. Both show that AAR values are not significant but CAAR values are statistically significant. Confidence band values show how the upper and lower band values move along CAAR. The band values are indicative of the upper and lower limits for the CAAR values at 95% confidence level. Confidence bands show that CAAR values will not exceed these in 95% of the cases.
Finally, we analyse the CAARs around SEO opening taking event windows of varying lengths.
Table presents the CAARs and the Z-values for various event windows surrounding SEO issue opening and for pre-event, event-day and post-event windows, separately.
Table 5. CAARs and Z-values for different event windows surrounding SEO issue opening, pre-event, event-day, and post-event windows
From the analysis of the results presented in Table , it is clear that CAARs for various event windows surrounding SEO issue opening are negative. These negative CAARs for various event windows represent abnormal loss to the investors. Except for the event window −1 to + 1, for all other event windows, the negative CAARs or abnormal losses are significant at 1% level. Therefore, excluding the 3-day event window, for all other event windows surrounding the opening of SEO issues, we conclude that abnormal returns have been negative and significant surrounding the opening of SEOs. These findings support the existence of windows of opportunity for the issuance of seasoned equities in Indian capital market.
However, when the event windows are analysed separately based on pre-event, event-day and post-event returns, i.e. −30 to −1, 0, and 1 to 30 days, respectively, we have some interesting findings. The abnormal return on the event day or the issue opening day (day 0) is not only found to be positive but also highly significant. CAAR based on both pre-event and post-event returns are though negative, for the pre-event window (−30 to −1), it is found to be insignificant; while the negative CAAR for the post-event window (1 to 30) is found to be highly significant. The insignificant negative returns in the pre-event window show the market did not anticipate a big negative news initially and, therefore, market has underreacted. However, when the SEO was announced, the market has not taken this information well which is evident from highly significant negative CAAR in the post-event window period. Therefore, the market’s under-reaction previously to the information conveyed by the SEO offering is one of the significant findings.
Finally, to compare underpricing of SEOs and abnormal returns for different windows surrounding SEO issue opening, we would like to clarify that APARs surrounding issue opening are computed to test market’s reaction to SEOs and whether market perceives SEO firms to be overvalued. Negative APARs indicates the existence of windows of opportunity, i.e. firms approach capital market when they are overvalued. However, underpricing of SEOs is an entirely different issue. Ghosh et al. (Citation2000), e.g. relate underpricing/overpricing of SEOs to asymmetric information hypothesis.
5. Conclusion
We have examined windows of opportunity and the performance of SEOs by selecting 162 SEOs announced by the firms listed on BSE during the period from 1992 to 2012. We have used two measures of underpricing—close-to-offer and offer-to-close—and the results of the study exhibit significant underpricing at 1% level. The finding of this study leads to the rejection of the alternative hypothesis that there is no significant underpricing of SEOs. Results of this study are consistent with the results of Corwin (Citation2003) who uses close-to-offer return measure, Kim and Park (Citation2006) who uses offer-to-close return measure, and Ghosh et al. (Citation2000) who use both these measures and document significant underpricing of SEOs using both the measures. Our analysis of the abnormal returns surrounding the opening of SEO issues for an event window of −30 to + 30 shows that after the opening of the issues, the CAARs are significantly negative, while before the issue opening they were positive though not significant for majority of the days. When APARs are computed for varying event windows, we find that, except for event window of −1 to + 1, for other event windows the CAARs are significantly negative. This leads us to reject the alternative hypothesis that investors cannot earn abnormal returns in the period surrounding the opening of SEO issues. These results support the findings of the studies by Bayless and Chaplinsky (Citation1996), and Clark et al. (Citation2004) who report negative APARs. Findings of our study, both underpricing and negative post-SEO returns, are also in-line with the findings of Asquith and Mullins (Citation1986) that price reduction following equity announcement is consistent with two hypotheses: First, the hypothesis that when there is issue of equity by firms or by informed investors, this is taken by the market as unfavourable signals regarding the present performance as well as future prospects of the firm; second, the price-pressure hypothesis that the demand for firm’s shares is always downward sloping. These findings of their study indicate a permanent fall in firm value following equity issue announcement and hence issue of equity at a discounted stock price. Overall, the findings of our study support the existence of windows of opportunity and underpricing of SEOs in Indian capital market. Finally, our analysis of market reaction to SEO using the different window period shows that returns are significantly negative in the post-SEO opening window period and the returns are insignificantly negative pre-SEO window and, therefore, we conclude that market has underreacted to the news conveyed by SEO issue.
Acknowledgements
The authors thank Dr Numan ÜLKÜ, Senior Lecturer of Finance, University of South Australia and the reviewers for their comments on the earlier versions of this paper. The authors have greatly been benefited from these comments and the quality of the paper has certainly improved by incorporating their suggestions.
Additional information
Funding
Notes on contributors
K.R. Naveen Kumar
Dr K.R. Naveen Kumar, He has 19 years of teaching experience at the under-graduate and post-graduate levels. He has been awarded with PhD for the thesis titled “A Study of Pricing and Performance of Public Issues in Indian Capital Market” by Mangalore University. He has done his research in capital market in India.
Iqbal Thonse Hawaldar
Professor Iqbal Thonse Hawaldar, Having obtained his PhD for the thesis titled “Efficiency of the Indian Stock Market” from Mangalore University, India, he continues to commit himself to teaching and research. He has published a book titled “Efficiency of Stock Market”, which continues to be a significant resource in its domain.
T. Mallikarjunappa
Professor T. Mallikarjunappa, He has 36 years of postgraduate teaching and research experience and published 125 research papers and presented 350 papers in the international and national conferences and seminars. He got Outstanding Management Teacher and Researcher Award, Outstanding Management Research Guide award, Best Teacher in Financial Management, and Best Teacher award. He has successfully supervised 15 students leading to the award of PhD in management.
References
- Aggarwal, R., & Rivoli, P. (1990). Fads in the initial public offering market? Financial Management, 19(4), 45–57. doi:10.2307/3665609
- Amihud, Y., Hauser, S., & Kirsh, A. (2003). Allocations, adverse selection, and cascades in IPOs: Evidence from the tel aviv stock exchange. Journal of Financial Economics, 68(1), 137–158. doi:10.1016/S0304-405X(02)00251-9
- Asquith, P., & Mullins, D. W., Jr. (1986). Equity issues and offering dilution. Journal of Financial Economics, 15(1–2), 61–89. doi:10.1016/0304-405X(86)90050-4
- Bayless, M., & Chaplinsky, S. (1996). Is there window of opportunity for seasoned equity issuance? The Journal of Finance, 51(1), 253–278. doi:10.1111/j.1540-6261.1996.tb05209.x
- Beatty, R., & Ritter, J. (1986). Investment banking, reputation and the underpricing of IPOs. Journal of Financial Economics, 15(1–2), 213–232. doi:10.1016/0304-405X(86)90055-3
- Bora, B., Adhikary, A., & Jha, A. (2012). Book building process: A mechanism for efficient pricing in India. International Journal of Trade, Economics and Finance, 3(2), 109–113. doi:10.7763/IJTEF.2012.V3.182
- Brown, S. J., & Warner, J. B. (1985). Using daily stock returns: The case of event studies. Journal of Financial Economics, 14(1), 3–31. doi:10.1016/0304-405X(85)90042-X
- Chaturvedi, A., Pandey, A., & Ghosh, S. K. (2006). Firm financing through IPOs: A study of causal variables responsible for under-pricing. Vision, 10(3), 23–33. doi:10.1177/097226290601000303
- Clark, J., Dunbar, C., & Kahle, K. (2004). The long-run performance of secondary equity issues: A test of the windows of opportunity hypothesis. Journal of Business, 77(3), 575–603. doi:10.1086/386531
- Cornett, M. M., Mehran, H., & Tehranian, H. (1998). Are financial markets overly optimistic about the prospects of firms that issue equity? Evidence from voluntary versus involuntary equity issuance by banks. The Journal of Finance, 53(6), 2139–2159. doi:10.1111/0022-1082.00085
- Corwin, S. A. (2003). The determinants of underpricing for seasoned equity offers. The Journal of Finance, 58(5), 2249–2279. doi:10.1111/1540-6261.00604
- Denis, D. J. (1994). Investment opportunities and the market reaction to equity offerings. The Journal of Financial and Quantitative Analysis, 29(2), 159–177. doi:10.2307/2331220
- Derrien, F., & Womack, K. L. (2003). Auctions vs. book building and the control of underpricing in hot IPO markets. Review of Financial Studies, 16(1), 31–61. doi:10.1093/rfs/16.1.0031
- Friday, H. S., Howton, S. D., & Howton, S. W. (2000). Anomalous evidence on operating performance following seasoned equity offerings: The case of REITs. Financial Management, 29(2), 76–87. doi:10.2307/3666286
- Garg, A., Arora, P., & Singla, R. (2008). IPO underpricing in India. The ICFAI Journal of Applied Finance, 14(3), 33–42.
- Ghosh, C., Sirmans, C. F., & Nag, R. (2000). The pricing of seasoned equity offerings: Evidence from REITs. Real Estate Economics, 28(3), 363–384. doi:10.1111/1540-6229.00805
- Ghosh, S. (2005). Underpricing of initial public offerings: The Indian experience. Emerging Markets Finance and Trade, 41(6), 45–57. doi:10.1080/1540496X.2005.11052625
- Hawaldar, I. T., Kumar, K. R. N., & Mallikarjunappa, T. (2018). Pricing and performance of IPOs: Evidence from Indian stock market. Cogent Economics & Finance, 6(1), 1–20. doi:10.1080/23322039.2017.1420350
- Healy, P., & Palepu, K. (1990). The effectiveness of accounting-based dividend covenants. Journal of Accounting and Economics, 12(1–3), 97–123. doi:10.1016/0165-4101(90)90043-4
- Jain, P. C. (1992). Equity issues and changes in expectations of earnings by financial analysts. The Review of Financial Studies, 5(4), 669–683. doi:10.1093/rfs/5.4.669
- John, K., & Williams, J. (1985). Dividends, dilution, and taxes: A signalling equilibrium. The Journal of Finance, 40(4), 1053–1070. doi:10.1111/j.1540-6261.1985.tb02363.x
- Kim, Y., & Park, M. S. (2006). Auditor changes and the pricing of seasoned equity offers. Accounting Horizons, 20(4), 333–349. doi:10.2308/acch.2006.20.4.333
- Korajczyk, R. A., Lucas, D. J., & McDonald, R. L. (1991). The effect of information releases on the pricing and timing of equity issues. The Review of Financial Studies, 4(4), 685–708. doi:10.1093/rfs/4.4.685
- Krishnamurti, C., & Kumar, P. (2002). The initial listing performance of Indian IPOs. Managerial Finance, 28(2), 39–51. doi:10.1108/03074350210767681
- Lee, I. (1997). Do firms knowingly sell overvalued equity? The Journal of Finance, 52(4), 1439–1466. doi:10.1111/j.1540-6261.1997.tb01116.x
- Levis, M. (1993). The long-run performance of initial public offerings: The UK experience 1980-1988. Financial Management, 22(1), 28–41. doi:10.2307/3665963
- Loderer, C. F., & Maurer, D. C. (1992). Corporate dividends and seasoned equity issues: An empirical investigation. The Journal of Finance, 47(1), 201–225. doi:10.1111/j.1540-6261.1992.tb03983.x
- Loughran, T. (1993). NYSE vs NASDAQ returns: Market microstructure or the poor performance of initial public offerings? Journal of Financial Economics, 33(2), 241–260. doi:10.1016/0304-405X(93)90006-W
- Loughran, T., & Ritter, J. R. (1995). The new issue puzzle. The Journal of Finance, 50(1), 23–51. doi:10.1111/j.1540-6261.1995.tb05166.x
- Loughran, T., & Ritter, J. R. (1997). The operating performance of firms conducting seasoned equity offerings. The Journal of Finance, 52(5), 1823–1850. doi:10.1111/j.1540-6261.1997.tb02743.x
- MacKinlay, C. A. (1997). Event studies in economics and finance. Journal of Economic Literature, 35(1), 13–39.
- Madhusoodanan, T. P., & Thiripalraju, M. (1997). Under-pricing in initial public offerings: The Indian evidence. Vikalpa, 22(4), 17–30. doi:10.1177/0256090919970403
- Muscarella, C., & Vetsuypens, M. R. (1989). A simple test of Baron’s model of IPO underpricing. Journal of Financial Economics, 24(1), 125–135. doi:10.1016/0304-405X(89)90074-3
- Myers, S. C., & Majluf, N. S. (1984). Corporate financing and investment decisions when firms have information that investors do not have. Journal of Financial Economics, 13(2), 187–221. doi:10.1016/0304-405X(84)90023-0
- Narasimhan, M. S., & Ramana, L. V. (1995). Pricing of initial public offerings: Indian experience with equity issues. The ICFAI Journal of Applied Finance, 1(1), 26–39.
- Ritter, J. R. (1984). The “Hot Issue” market of 1980. The Journal of Business, 57(2), 215–240. doi:10.1086/jb.1984.57.issue-2
- Ritter, J. R. (1991). The long-run performance of initial public offerings. The Journal of Finance, 46(1), 3–27. doi:10.1111/j.1540-6261.1991.tb03743.x
- Safieddine, A., & Wilhelm, W. J., Jr. (1996). An empirical investigation of short-selling activity prior to seasoned equity offerings. The Journal of Finance, 51(2), 729–749. doi:10.1111/j.1540-6261.1996.tb02701.x
- Sehgal, S., & Singh, B. (2007). The initial and after-market performance of indian IPOs. The ICFAI Journal of Applied Finance, 13(11), 16–36.
- Smith, C. W. (1977). Alternative methods for raising capital: Rights versus underwritten offerings. Journal of Financial Economics, 5, 273–307. doi:10.1016/0304-405X(77)90040-X
Web Sources
- Retrieved August 8, 2013 from http://www.primedatabase.com/catalogue.pdf