
 ?Mathematical formulae have been encoded as MathML and are displayed in this HTML version using MathJax in order to improve their display. Uncheck the box to turn MathJax off. This feature requires Javascript. Click on a formula to zoom.
Abstract
We have investigated the influence of investors’ expectation of future market trends on their trading and investment decisions in various market states. The efficiency of mutual-fund markets can be threatened by systematic biases in different decision-makings. Mutual-fund investors exhibit the disposition effect whereas neither type of investor exhibits such effect in the bear market. Stock-fund investors in the bull and neutral markets exhibit the disposition effect, whereas balanced-fund investors exhibit the disposition effect only in the neutral market. This study enables mutual-fund managers to plan cash holdings in the trading of various types of mutual funds and in various market states to respond to future fund investors’ fund redemption. Multiple regression analysis is conducted to verify whether stock-fund investors are prone to exhibit the disposition effect in various market states. Stock-fund investors exhibit a higher tendency toward the disposition effect than the balanced-fund investors. In addition, in the bear market the redemption rate for the stock-fund investors is higher than that for the balanced-fund investors that resulted in a high turnover rate.
PUBLIC INTEREST STATEMENT
The disposition effect that refers to the tendency of individual investors to quickly sell stocks that have appreciated in price since purchase and hold on to losing stocks, has attracted considerable interest by stock market investors and proved to be crucial for investment decision-making and stock trading. Mutual-fund investors exhibit the disposition effect in various market states in Taiwan. The stock- and balanced-fund investors do not exhibit the disposition effect in the bear market whereas such effect has been observed in the neutral market. In the bull market, only stock-fund investors exhibit the disposition effect while balanced-fund investors are robust and conservative investors. We have shown that the stock funds are characterized as high risk and high return, while the balanced funds show low risk and low return. The volatility of the net value as well as the return of stock funds is higher than that of balanced funds.
1. Introduction
The disposition effect has attracted considerable interest by stock market investors and proved to be crucial for investment decision-making and stock trading. However, limited studies have investigated mutual-fund investors and the disposition effect, compared with those focusing on stock market investors. One of the most robust behavioral regularities documented in the studies of trading behavior is deposition effect which refers to the tendency of individual investors to quickly sell stocks that have appreciated in price since purchase and hold on to losing stocks. Consequently, learning to avoid the disposition effect would be beneficial to investors. However, the ever changing nature of the market environment provides a challenging setting for improving the trading behavior. Such behavior has been well-documented in many situations and in various markets around the world such as the housing market or in the exercise of executive stock options [Aliprantis and Border (Citation2006), Barberis and Xiong (Citation2009) and Wu, Johnson, and Sung Citation2008]. The deposition effect is based directly on the prospect theory (Kahneman & Tversky, Citation1979) and mental accounting (Thaler, Citation1985). Following the prospect theory, investors employ an S-shaped value function to evaluate their potential gains and losses to maximize their utility whereas under the mental accounting, investors are most likely to assign their assets into different accounts for different stock positions. On the other hand, in Shefrin and Statman’s model (Citation1985), investors maintain a separate mental account for each stock position, and are keen to maximize an S-shaped value function that is convex for losses and concave for gains. The mechanism driving the disposition effect has recently been documented through simulation and pays particular attention to the influence of different risk preferences, as suggested by prospect theory, together with a preference for immediate rewards over delayed rewards (Shoji & Kanehiro, Citation2016). Very recently, Dorow, Costa, Takase, Prates, and Silva (Citation2018) have shown that there is a change in brain activity of the participant in the process of the disposition effect and return performance. Recent reports have discussed the variation of disposition effect based on market state and divided the market into “bull” or “bear” market states, arguing that the disposition effect may vary based on market state (Muhl & Talpsepp, Citation2018). At the behavioral level, professionals are shown more likely to escape the disposition effect, a result that receives neural support from the experimental data. Understanding the role of behavioral biases in individual mutual-fund decisions is equally important. Little work has been done to link the decision-making biases of individuals to their mutual-fund investments.
Mutual funds have access to superior investment technologies and constantly trade securities in the financial markets. The experience acquired through continuous trading makes mutual funds more experienced than the average retail investor and consequently more likely to avoid behavioral biases (Seru, Shumway, & Stoffman, Citation2010). Significant interests shown to mutual funds by investors due to the following reasons: (a) mutual funds are operated by professional managers, and therefore are a convenient investment tool for investors who are unfamiliar with the investment process and lack of sufficient time in focusing the market trends; (b) the investment risk of mutual funds can be determined based on a person’s risk tolerance level and financial planning; (c) compared with the investment risk of stocks or other financial derivatives, mutual funds can be more easily diversified; and (d) the threshold for investment in mutual funds is lower than that for investment in other financial instruments. Since the Taiwanese government allowed the establishment of financial holding companies, lifted cross-industry restrictions, and initiated investment in financial instruments, the number of investment channels and products available to domestic investors has increased considerably. Among the available financial instruments, the majority of investors have invested in mutual funds. In this paper, we have examined behavioral bias relating to disposition effect of Taiwanese mutual fund and stock market investors. Our study suggests that similar to stock market investors, mutual-fund investors also exhibit the disposition effect. We have also investigated the influence of investors’ expectation of future market trends on their trading and investment decisions in various market states (i.e. bull, bear, and neutral market). In addition, the behavior of various types of mutual-fund investors to determine whether fund investors sold winning funds quickly but hesitated to sell losing funds when formulating trading decisions are analyzed.
2. Materials and methods
2.1. Data
This study is conducted between January 2008 and December 2012, over a total of 60 months. The research sample comprises the domestic stock fund and domestic balanced fund classified by Taiwan Economic Journal (TEJ). The domestic stock funds are all open-ended and categorized into seven types (i.e. general stock funds, technology stock funds, small and medium stock funds, over-the-counter stock funds, special situation stock funds, China concepts stock funds, and value stock funds). The domestic balanced funds are categorized into types of general stock, value stock, and balanced fund with financial module. A total of 170 funds are used as the research sample, consisting of 143 domestic stock funds and 27 domestic balanced funds. The variables used in this study comprise redemption value, rate of fund changes over the past year, standard deviation, turnover rate, and TAIEX value; monthly data are used for analysis.
2.2. Literature and hypotheses
The prospect theory (Kahneman & Tversky, Citation1979) explains the decision-making behaviors under uncertain conditions. In this theory, when the investors invest in stocks, the purchase price is considered as a typical reference point for the assessment of stock value. Investors can use a S-shaped function to assess investment decisions; a concave function represents gains, and a convex function indicates losses. The S-shaped function reflects an investor’s risk-averse attitude when acquiring gains and risk-seeking attitude when experiencing losses. This theory can also be used to explain the disposition effect; investors’ gains from investment, stimulate them to turn to risk aversion and to reduce assets in high-risk investment, and losses stimulate risk seeking to increase assets. Therefore, the disposition effect is a crucial aspect of prospect theory for investment decision-making and stock trading. Using the trading data from Estonian stock market as well as the laboratory experiments, Talpsepp, Vlcek, and Wang (Citation2014) reported that investors behave differently depending on whether their investment is in gains or losses. Ploner (Citation2017) recently confirmed that the existence of the disposition effect in a simple risky task in which choices is taken sequentially.
Shefrin and Statman (Citation1985) defined the disposition effect as investors’ tendency to sell winning stocks and retain losing stocks when selling stocks because they can attain a sense of achievement from gain realization when selling stocks at a profit. In contrast, investors tend to retain losing stocks because they are afraid of admitting their incorrect decision of purchasing the losing stock, and retain the stocks in the hope of breaking even. Shefrin and Statman (Citation1985) divided the data of individual investors into three categories based on the length of time they retained a stock (1 month or less, 1–6 months, and 6 months to 1 year). The empirical results indicate that investors exhibit the disposition effect regardless of the length of time for which they retain a stock. Odean (Citation1998) examined the trading information obtained from 10,000 individual investors in the U.S. market from 1987 to 1993 and determined that the investment decision-making behaviors of U.S. stock market investors exhibit the disposition effect. Investors who gain profits retain the stocks for an average of 104 days, and investors who experience losses retain the stocks for an average of 124 days. Investors tend to retain losing stocks for a long time; only 15% of investors sold losing stocks quickly. This result implied that investors exhibit a risk-aversion disposition when gaining profit. However, when investors experience losses, they exhibit a risk-seeking disposition. Rau (Citation2015) studied the disposition effects of teams and individuals and describes the disposition effect as the phenomenon that investors are reluctant to realize losses, whereas winners are sold too early.
Coval and Shumway (Citation2005) reported that when traders experience losses in the morning, they tended to perform high-risk behaviors in the afternoon. In other words, traders became risk seekers when facing losses to avoid loss realization. Locke and Mann (Citation2001) observed that the traders held on to losses for a comparatively longer time than that for gains; professional traders also exhibit loss-avoidance behaviors. Shu, Yeh, Chiu, and Chen (Citation2005) examined the market in Taiwan and identified the disposition effect exhibited by Taiwanese investors. Barber, Lee, Liu, and Odean (Citation2007) identified an overall reluctance to realize losses in the stock market. Although individuals, corporations, and dealers exhibit the disposition effect but mutual funds and foreign investors did not. Tung (Citation2012) also observed the period of holding on to lose mutual funds was longer in time length than for winner mutual funds, exhibiting the disposition effect. From above discussions, the majority of the studies focus on the disposition effect exhibited by stock market investors. However, few studies have investigated mutual-fund investors and the disposition effect, compared with those focusing on stock market investors. Our study suggests that similar to stock market investors, mutual-fund investors also exhibit the disposition effect and propose the following hypothesis:
H1: The investment behavior of mutual-fund investors exhibits the disposition effect.
Previous studies typically categorized market states into bull and bear markets to investigate the differences of the disposition effect among these market states. For example, Leal, Armada, and Duque (Citation2010) targeted Portuguese stock market investors and determined that the disposition effect was stronger in bull markets than in bear markets. Based on the categorization of bull and bear markets, Leal et al. (Citation2010) observed that market investors exhibited the disposition effect, and the disposition effect in the bull market was stronger than was that in the bear market. Ammann, Ising, and Kessler (Citation2012) investigated the influence of mutual fund characteristics in the macroeconomic environment in terms of disposition effect, and reported that the two factors exhibited low explanatory power for the disposition effect. Additionally, the disposition effect exerted minor economic influence on fund performance. According to Lee, Yen, and Chan (Citation2013), who classified the market into bull, bear, and neutral states, when a mutual fund experienced a high loss, investors in the bear market exhibited a higher tendency to redeem the fund than did investors in the bull market. In other words, when the gains were low, the number of investors who redeemed their funds was lower in the bull market than in bear market. Investors in the neutral market tended to redeem their funds regardless of gains or losses. Overall, both Taiwanese stock market investors and mutual-fund investors exhibited the disposition effect. Previous studies have demonstrated that the disposition effect does not necessarily exist in all market states. Therefore, this study proposed the following hypothesis:
H2: Mutual-fund investors exhibit the disposition effect in various market states.
Previous studies have investigated the relationship between mutual-fund investors and the disposition effect, predominantly using stock funds as the research sample. For example, according to Sirri and Tufano (Citation1998), stock-fund investors failed to redeem low-performing funds, which typically resulted in fund managers’ engagement in high-risk investment behaviors when performance was low, causing moral hazard. Barber et al. (Citation2007) determined that 84% of investors (including individuals, corporations, and dealers) exhibited a significant disposition effect; however, mutual-fund investors did not exhibit reluctance to realize losses. Therefore, in this study, mutual-fund investors were divided into stock-fund investors and balanced-fund investors to investigate the disposition effect exhibited by varying types of fund investors in various market states. Based on the literature, this study proposed the following hypotheses:
H3: All mutual-fund investors exhibit the disposition effect, regardless of the type of fund.
H4: Stock-fund and balanced-fund investors both exhibit the disposition effect, regardless of the market state.
Targeting individual investors in the stock market in Taiwan, Tung (Citation2012) focused on the mutual fund in Taiwan and reported that fund managers with a high turnover rate in funds exhibited the disposition effect. This study regarded stock-fund investors as active investors regardless of the market state, and balanced-fund investors as robust investors. Therefore, stock-fund investors were assumed to perform fund trading more frequently and exhibit a higher redemption rate, resulting in higher turnover rate, compared with balanced-fund investors. Based on these observations, we proposed three hypotheses:
H5: The difference in redemption rate between stock-fund investors and balanced-fund investors is significant in bull markets.
H6: The difference in redemption rate between stock-fund investors and balanced-fund investors is significant in bear markets.
H7: The difference in redemption rate between stock-fund investors and balanced-fund investors is significant in neutral markets.
2.3. Research methods
Two approaches are typically used to categorize the market states. First, the cumulative return and volatility must exceed a specific threshold concomitantly. For example, Guidolin and Timmermann (Citation2005) investigated the probability of switching between various market states by employing the Markov switching model and identified the following three market states based on the average rate of return and return volatility: (a) bull market referring to the market state that exhibits a high average rate of return and above-average volatility (b) bear market referring to the market state that shows a high negative rate of return and above-average volatility and (c) normal state when the average rate of return and volatility are similar to the previous long-term average. Second, market states can be categorized based on stock index activity (Pagan & Sossounov, Citation2003). When the stock index has risen or dropped for a specific period of time (i.e. a confirmed uptrend/downtrend), and the amount of rise or drop exceeds a specific threshold, this situation is referred to as a bull or bear market respectively. Although periods of time and thresholds varied among previous studies, the majority of studies established a threshold of 20% (more than 20% cumulative increase/decrease in stock index values). For example, Lee, Jiang, and Indro (Citation2002) studied the U.S. market and examined the Dow Jones Industrial Average, S&P 500, and NASDAQ Composite, Edwards, Biscarri, and Pérez de Gracia (Citation2003) explored the emerging markets in South Korea, Thailand, Brazil, Argentina, Chile, and Mexico and Pagan and Sossounov (Citation2003) investigated the S&P 500 in the U.S. market. All of the above studies have used a 20% threshold. Lee et al. (Citation2002) adopted the approach used by Pagan and Sossounov (Citation2003) to divide market states. In this approach, market peak and trough is identified first. When the time interval between peak and trough is 4 months or more, and more than a 20% cumulative increase in stock index values, the market state is considered as a bull market. In contrast, when the time interval between peak and trough is 4 months or more, and more than a 20% cumulative decrease in stock index values, the market state is known as a bear market. The above approach determined market state (bull or bear) based on the changes of the cumulative in stock index values over a specified period of time. Compared with the first approach, this approach is consistent with the general investors’ understanding the market states. Using the above approach, this study divided the fund performance into two categories to investigate the disposition effect; the market state is also classified to explore whether the disposition effect varied based on level of risk. This study also divided the mutual funds into stock funds and balanced funds, and analyzed the difference in the disposition effect exhibited by various types of fund investors in varying market states.
This study adopted the system of market categorization proposed by Lee et al. (Citation2013) namely bull, bear and neutral markets to investigate the influence of various market states on the disposition effect. The methods for the identification of the peak and trough and the market states are as follows:
Peak and trough: the peak and trough adopted in this study are based on those used by Pangan and Sossounov (Citation2003). The peak is determined using (1) proposed by Pagan and Sossounov (Citation2003):
where indicates the TAIEX of month t. If
is higher than the TAIEX in the previous and subsequent 8 months,
is regarded as a peak. The trough was determined using (2), proposed by Pagan and Sossounov (Citation2003):
(b) Bull and bear markets: in a bull market, the TAIEX exhibits a trend of continual increase. Therefore, a bull market must fulfill three requirements: (a) the TAIEX must exhibit an upward trend from trough to peak; (b) the cumulative return on the TAIEX must exceed 20%; and (c) the time period between the trough and the peak must be at least 4 months. When the TAIEX reached the peak, the upward trend finish; and the TAIEX began to exhibit a downward trend. The bear market was also determined using the same procedure.
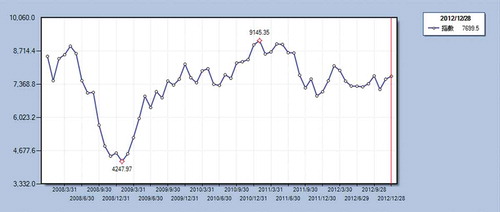
(c) Neutral market: a market state that is neither a bull market nor a bear market is considered as a neutral market. For example, in this study, the periods of neutral market state were the end of December 2009 to the end of August 2010, and the end of November 2011 to the end of December 2012 (Table and Figure ).
Table 1. Market states
Figure 1. TAIEX (2007/12/31–2012/12/31).
Data source: Taiwan Economic Journal (TEJ).
2.4. Model
We have conducted regression analysis and independent-samples t tests. Mutual funds are divided into stock funds and balanced funds, and the market states are classified as bull, bear, and neutral markets based on the TAIEX. Multiple regression analysis is performed to determine the variation in the disposition effect; independent-sample t tests are conducted to verify whether the redemption rate for stock-fund investors and that for balanced-fund investors varied significantly among the market states.
The empirical model in this study is adapted from Lee et al. (Citation2013), who used a multiple regression model to analyze the disposition effect in mutual-fund trading. The regression model was as follows:
where i and t represent the value of fund i in month t, RED is the redemption rate for the fund, and WINNER and LOSER are variables representing the winning and losing funds. The control variables TOR and STD, respectively indicate turnover rate and fund risk.
Variables
Based on the model used by Lee et al. (Citation2013), we adopted the following variables:
(1) RED
where Redeem indicates the fund redemption value.
(2) WINNER and LOSER
Lee et al. (Citation2013) divided mutual-fund performance into winners and losers to investigate the disposition effect of fund investors. Performance indicators that represent winners and losers were simultaneously incorporated into the two types of performance indicator models. To avoid collinearity, dummy variables are multiplied by fund performance to produce the performance indicators.
Dummy variable is multiplied by fund performance (Performance) to yield the performance indicator for winners (Winner). Dummy variable
is multiplied by fund performance (Performance) to produce the performance indicator for losers (Loser). The equations are as follows:
where the Performance represents fund performance, which signifies the return on funds. The rate of change in fund returns over the past year in the TEJ is used for this variable, calculated using the following equation:
(3) TOR
TOR is the mean value of the sum of purchase sales turnover rates within a particular month. The purchase sales turnover rate is obtained as follows: the total value of listed stocks, over-the-counter stocks, and securities investment trust funds purchased within a month, and the average net asset value in that month is multiplied by the percentage of net asset value that could be invested in stocks and securities investment trust funds regulated by a trust deed.
(4) STD
STD is the annualized standard deviation and is calculated as follows:
where σi represents the standard deviation of return on investment for a particular month over the past 12 months. The annualized standard deviation (12 months) in the TEJ is adopted as the variable for fund risk.
3. Results and discussions
The descriptive statistics for the variables are displayed in Table . We have analyzed a total of 10,200 funds, comprising of mutual funds (8,580 stock funds and 1,620 balanced funds) and market states (2,720 funds of bull markets, 3,910 funds of bear markets and 3,570 funds of neutral markets).
Table 2. Descriptive statistics
The RED of stock funds (4.02%) is lower than that of balanced funds (4.22%) indicating the balanced-fund investors tended to place stop-profit and stop-loss orders. The average TOR of stock funds (22.3%) is higher than that of balanced funds (19.5%), revealing the active of stock-fund trading and the stability of balanced-fund trading. Regarding full form of STD (STD), the minimal and maximal rates for stock funds are −64.84% and 121.50%, respectively, and the standard deviation is 29.74; the minimal and maximal rates for balanced funds are −38.5% and 64.17%, respectively, and the standard deviation is 16.48. This indicates that the volatility of the net value as well as the return of stock funds is higher than that of balanced funds. Moreover, the mean value of STD for stock funds (26.85) is significantly higher than that of balanced funds (15.01) indicating the risk in stock funds is higher than that in balanced funds. Consequently, this study argues that the stock funds are characterized as high risk and high return, and the balanced funds exhibits low risk and low return.
3.1. Correlation coefficient analysis
Pearson’s correlation analysis has performed to verify the existence of collinearity among the independent variables and also to ensure the empirical analysis is not influenced by collinearity. Table displays the Pearson correlation coefficient matrix. All the correlation coefficients are lower than 0.7 that indicates the absence of collinearity among the variables.
Table 3. Pearson correlation coefficient matrix
3.2. Multiple regression analysis
We have adopted a multiple regression model to analyze the disposition effect in the trading of mutual funds in bull, bear, and neutral markets. Mutual funds are categorized into two types to investigate the differences in disposition effect. Table shows the standardized coefficients and levels of significance in the multiple regression models that are used to analyze WINNER and LOSER on RED. The existence of disposition effect is determined based on the coefficient results. Specifically, the disposition effect existence could be proven if the standardized coefficients of WINNER and LOSER are both positive. In addition, the two variables are positively correlated with RED when the mutual fund realized a gain: the RED for a mutual fund is high when the fund realized a gain and low when the fund realized a loss. However, the value of LOSER is negative. Model 1 shows that WINNER (0.181, p < .001) and LOSER (0.022, p = .062) are both significantly positively correlated with RED. This indicates that the increased gain of a mutual fund results the decreased redemption rate for the fund while increased loss of mutual fund results decreased redemption rate. Thus, H1 is confirmed and mutual-fund investors in the market exhibit the disposition effect.
Table 4. Multiple regression analysis of the disposition effect
Then, we have examined H2. Model 2 (bull market) reveals the significantly positive correlation between WINNER and RED (0.102, p < .001) and between LOSER and RED (0.111, p < .001). This indicates that increased gain of a mutual fund results the increased redemption rate for the fund; while increased loss of mutual fund results decreased redemption rate. Investors in the bull market exhibit the disposition effect. In Model 3 (bear market), WINNER and RED are positively correlated (0.291, p < .001), and LOSER and RED are negatively correlated (−0.111, p < .001). This indicates that increased gain of a mutual fund results the increased redemption rate for the fund; while the increased loss of mutual fund results the increased redemption rate Therefore, we have concluded that the disposition effect does not exist in the bear market. In Model 4 (neutral market), both WINNER (0.264, p < .001) and LOSER (0.110, p < .001) are significantly positively correlated with RED. This indicates that the redemption rate is high when the gain of a mutual fund is high; while the low redemption rate is observed when the loss of a mutual fund is high. Therefore, the disposition effect also exists in the neutral market. Because the results indicate that the mutual-fund investors in the bear market do not exhibit the disposition effect, H2 is rejected.
Subsequently, H3 is tested. Model 5 shows the significant positive correlations between WINNER and RED (0.193, p < .001) and between LOSER and RED (0.036, p = .004), suggesting the increased gain of a mutual fund results the increased redemption rate for the fund; while increased loss of mutual fund results decreased redemption rate. This indicates that stock-fund investors in the market exhibit the disposition effect. In Model 6, WINNER and RED are positively correlated (0. 182, p < .001), and LOSER and RED are negatively correlated (−0.084, p = .004). This indicates that the redemption rate is high when the gain of a mutual fund is high; however, the redemption rate is still high when the loss of a mutual fund is high. Therefore, balanced-fund investors do not exhibit the disposition effect, meaning that only stock-fund investors exhibit the disposition effect; H3 is rejected.
To examine H4, this study divides the research samples based on the market states and mutual-fund types. Model 7 (stock-fund investors in the bull market) shows that WINNER (0.099, p < .001) and LOSER (0.124, p < .001) are both significantly positively correlated with RED. Therefore, the high redemption rate appears with the high gain of a mutual fund while the low redemption rate is observed with the high loss of a mutual fund. This demonstrates that stock-fund investors in the bull market exhibit the disposition effect. In Model 8 (balanced-fund investors in the bull market), WINNER and RED are significantly positively correlated (0.134, p < .001), but the correlation between LOSER and RED is insignificant (−0.028, p = .616), indicating that the balanced-fund investors in the bull market does not exhibit the disposition effect.
In Model 9 (stock-fund investors in the bear market), the correlation between WINNER and RED is significantly positive (0.372, p < .001), but that between LOSER and RED is significantly negative (−0.122, p < .001). This signifies that the high redemption rate results the high gain of a mutual fund, and remained high until the loss of a mutual fund is high. Thus, the stock-fund investors in the bear market do not exhibit the disposition effect. Similarly, in Model 10 (balanced-fund investors in the bear market), the correlation between WINNER and RED is significantly positive (0.227, p < .001), but that between LOSER and RED is significantly negative (−0.195, p < .001). This indicates that the increased gain of a mutual fund results the increased redemption rate for the fund while increased loss of a mutual fund causes the redemption rate increased. Therefore, the balanced-fund investors in the bear market do not exhibit the disposition effect. In Model 11 (stock-fund investors in the neutral market), the correlation between WINNER and RED (0.2807, p < .001) and that between LOSER and RED (0.1137, p < .001) are both significantly positive. This indicates that the high redemption rate appears with the high gain of a mutual fund while the low redemption rate is observed with the high loss of a mutual fund Therefore, the stock-fund investors in the neutral market exhibits the disposition effect. Model 12 (balanced stock investors in the neutral market) also reveals a significantly positive correlation between WINNER and RED (0.213, p < .001) and between LOSER and RED (0.092, p = .052), indicating that as the gain of a mutual fund increased, the redemption rate for the fund also increased, and as the loss of a mutual fund increased, the redemption rate decreased. Therefore, the balanced-fund investors in the neutral market also exhibit the disposition effect. These results demonstrates that the stock-fund investors in the bull and neutral markets exhibits the disposition effect, but only the balanced-fund investors in the neutral market exhibits the disposition effect. Consequently, H4 is rejected.
The regression results are summarized in Table . In the bear market, the stock- and balanced-fund investors do not exhibit the disposition effect because when the market exhibits a downward trend, investors possess a pessimistic expectation toward the funds that have realized a loss. Therefore, they tend to place stop-loss orders and redeem the losing funds quickly. Consequently, the phenomenon that investors postpone the selling of losing stocks does not occur. By contrast, the stock- and balanced-fund investors in the neutral market all exhibit the disposition effect. When the market is unstable, fund investors are unable to predict future market trends. Therefore, they quickly redeem the winning stocks to avoid market reversal, but are reluctant to redeem the losing stocks to prevent themselves from feeling regret. Thus, they exhibit irrational investment behavior, namely, the disposition effect. In the bull market, only stock-fund investors exhibit the disposition effect during the research period. By comparison, balanced-fund investors are robust and conservative investors; they emphasize stop-profit and stop-loss mechanisms, and therefore do not postpone the selling of losing stocks. Overall, the investment behavior of mutual-fund investors exhibits the disposition effect.
Table 5. Summary of regression results
Table 6. Difference analysis between types of mutual funds
3.3. Difference analysis
We have performed independent-sample t test to analyze the difference between the redemption rate for stock funds and that for balanced funds, and the differences in fund investors’ redemption rates in bull, bear, and neutral markets. Table summarizes the difference analysis between types of mutual funds. In the bull market, the difference between the average redemption rate for stock fund (5.3%) and that for balanced fund (4.9%) is insignificant (0.513, p = .608), that indicates the investment strategies for fund redemption do not differ significantly between active stock-fund investors and the robust balanced-fund investors. Therefore, H5 is rejected.
In the bear market, the redemption rates for stock and balanced funds show significant difference at a 10% significance level (1.704, p = .089). In addition, the average redemption rate for stock funds (4.4%) is higher than that for balanced funds (3.9%), indicating that the active stock-fund investors exhibit a higher redemption rate and are more prone to exhibit the disposition effect than the robust balanced-fund investors. Therefore, H6 is confirmed. In the neutral market, the difference between the redemption rates for stock funds (3.4%) and for balanced funds (3.5%) is insignificant (−0.487, p = .627), demonstrating that the investment strategies used by active stock-fund investors and the robust balanced-fund investors for fund redemption do not differ significantly. Therefore, H7 is rejected.
4. Conclusions
In this study we have shown that in the bear market, the stock- and balanced-fund investors do not exhibit the disposition effect. In contrast, such effect is observed in the neutral market. Fund investors are unable to predict future market trends in unstable market condition and hence they quickly redeem the winning stocks to avoid market reversal, but are reluctant to redeem the losing stocks to prevent themselves from feeling regret, exhibiting irrational investment behavior. We have shown that the stock funds are characterized as high risk and high return, while the balanced funds show low risk and low return. In the bull market, only stock-fund investors exhibit the disposition effect while balanced-fund investors are robust and conservative investors; they emphasize stop-profit and stop-loss mechanisms, and therefore do not postpone the selling of losing stocks. Overall, the investment behavior of mutual-fund investors exhibits the disposition effect.
Conflict of Interests
The authors declare that there is no conflict on interests regarding the publication of this paper.
Additional information
Funding
Notes on contributors
Shih-Wei Wu
Shih-Wei Wu is an associate professor in the Department of Business Management, National Taipei University of Technology (NTUT), Taiwan. He has received his PhD in from University of Southampton, UK. Juli Dutta is a graduate student in the College of Management at NTUT. Chin-Yu Huang is a Master student Department of Business Management, National Taipei University of Technology (NTUT).
References
- Aliprantis, C., & Border, K. (2006). Infinite dimensional analysis. Berlin, Heidelberg: Springer.
- Ammann, M., Ising, A., & Kessler, S. (2012). Disposition effect and mutual fund performance. Applied Financial Economics, 22(1), 1–19. doi:10.1080/09603107.2011.595676
- Barber, B. M., Lee, Y. T., Liu, Y. J., & Odean, T. (2007). Is the aggregate investor reluctant to realise losses? Evidence from Taiwan. European Financial Management, 13(3), 423–447. doi:10.1111/j.1468-036X.2007.00367.x
- Barberis, N., & Xiong, W. (2009). What drives the disposition effect? An analysis of a longstanding preference-based explanation. The Journal of Finance, 64(2), 751–784. doi:10.1111/j.1540-6261.2009.01448.x
- Coval, J. D., & Shumway, T. (2005). Do behavioral biases affect prices? The Journal of Finance, 60(1), 1–34. doi:10.1111/j.1540-6261.2005.00723.x
- Dooren, B. V., & Galema, R. (2018). Socially responsible investors and the disposition effect. Journal of Behavioral and Experimental Finance, 17, 42-52.
- Dorow, A., Costa, N. W., Jr., Takase, E., Prates, W., & Silva, S. D. (2018). On the neural substrates of the disposition effect and return performance. Journal of Behavioral and Experimental Finance,17, 16-21.
- Edwards, S., Biscarri, J. G., & Pérez de Gracia, F. (2003). Stock market cycles, financial liberalization and volatility. Journal of International Money and Finance, 22(7), 925–955. doi:10.1016/j.jimonfin.2003.09.011
- Guidolin, M., & Timmermann, A. (2005). Economic Implications of bull and bear regimes in UK stock and bond returns. The Economic Journal, 115(500), 111–143. doi:10.1111/ecoj.2005.115.issue-500
- Kahneman, D., & Tversky, A. (1979). Prospect theory: An analysis of decision under risk. Econometrica: Journal of the Econometric Society, 47, 263–291. doi:10.2307/1914185
- Leal, C. C., Armada, M. J. R., & Duque, J. L. (2010). “Are all individual investors equally prone to the disposition effect all the time? New evidence from a small market.”
- Lee, J. S., Yen, P. H., & Chan, K. C. (2013). Market states and disposition effect: Evidence from Taiwan mutual fund investors. Applied Economics, 45(10), 1331–1342. doi:10.1080/00036846.2011.617696
- Lee, W. Y., Jiang, C. X., & Indro, D. C. (2002). Stock market volatility, excess returns, and the role of investor sentiment. Journal of Banking & Finance, 26(12), 2277–2299. doi:10.1016/S0378-4266(01)00202-3
- Locke, P., & Mann, S. C. (2001). Do professional traders exhibit loss realization aversion. In Working Paper, George Washington University, Department of Finance and Texas Christian University, M. J. Neeley School of Business.
- Muhl, S., & Talpsepp, T. (2018). Faster learning in troubled times: How market conditions affect the disposition effect. The Quarterly Review of Economics and Finance, 68, 226-236.
- Odean, T. (1998). Are investors reluctant to realize their losses? The Journal of Finance, 53(5), 1775–1798. doi:10.1111/0022-1082.00072
- Pagan, A. R., & Sossounov, K. A. (2003). A simple framework for analysing bull and bear markets. Journal of Applied Econometrics, 18(1), 23–46. doi:10.1002/(ISSN)1099-1255
- Ploner, M. (2017). Hold on to it? An experimental analysis of the disposition effect. Judgment and Decision Making, 12, 118–127.
- Rau, H. A. (2015). The disposition effect in team investment decisions: Experimental evidence“. Journal of Banking & Finance, 61, 272-282.
- Seru, A., Shumway, T., & Stoffman, N. (2010). Learning by trading. Review of Financial Studies, 23, 705–739. doi:10.1093/rfs/hhp060
- Shefrin, H., & Statman, M. (1985). The disposition to sell winners too early and ride losers too long: Theory and evidence. The Journal of Finance, 40(3), 777–790. doi:10.1111/j.1540-6261.1985.tb05002.x
- Shoji, I., & Kanehiro, S. (2016). Disposition effect as a behavioral trading activity elicited by investors’ different risk preferences. International Review of Financial Analysis, 46, 104–112. doi:10.1016/j.irfa.2016.03.017
- Shu, P. G., Yeh, Y. H., Chiu, S. B., & Chen, H. C. (2005). Are Taiwanese individual investors reluctant to realize their losses? Pacific-Basin Finance Journal, 13(2), 201–223. doi:10.1016/j.pacfin.2004.08.001
- Sirri, E. R., & Tufano, P. (1998). Costly search and mutual fund flows. The Journal of Finance, 53(5), 1589–1622. doi:10.1111/0022-1082.00066
- Talpsepp, T., Vlcek, M., & Wang, M. (2014). Speculating in gains, waiting in losses: A closer look at the disposition effect. Journal of Behavioral and Experimental Finance, 2, 31–43. doi:10.1016/j.jbef.2014.04.001
- Thaler, R. (1985). Mental accounting and consumer choice. Marketting Science, 4, 199–214. doi:10.1287/mksc.4.3.199
- Tung, S. T. (2012). Disposition effect among high-turnover mutual fund managers in Taiwan. Journal of Innovation and Management, 9(1), 2–24.
- Wu, S. W., Johnson, J. E., & Sung, M. C. (2008). Overconfidence in judgements: The evidence, the implications and the limitations. Journal of Prediction Markets, 2(1), 73–90.
