
 ?Mathematical formulae have been encoded as MathML and are displayed in this HTML version using MathJax in order to improve their display. Uncheck the box to turn MathJax off. This feature requires Javascript. Click on a formula to zoom.
Abstract
The study examined stock prices (SP) and exchange rate (ER) interactions with multivariate VAR-GARCH model using monthly data from January 2000 to October 2014. The results of the Engle and Granger and Johansen cointegration test show that there is stable long-term relationship between SP and ER. The empirical evidence of the VAR-GARCH model shows a significant mean spillover running from stock market to exchange market but not a mean spillover from exchange market to stock market. The variance equation results indicated the existence of bidirectional volatility transmission effect between SP and ERs, indicating the past innovations in stock market have the great effect on future volatility in foreign exchange market, and vice versa. The results have important implications for international portfolio managers in the portfolio diversification decisions and risk hedging strategies.
PUBLIC INTEREST STATEMENT
As the cost of purchasing security on an exchange, stock prices (SP) are affected but not restricted to exchange rate (ER), information asymmetry, and size of the company among others. Considering the fact that market volatility is mostly determined by the interplay of ERand stock price movement, the study explains the nature of the relationship existing between SP and ER in the long run, and as well identify how increase/decrease in ER or share prices can affect each other. Based on the monthly data generated from National Bureau of Statistics used to estimate the relationship and direction of causality between SP and ERs, we found a stable long-run and bidirectional relationship between SP and ER. This implies that future volatility in stock and exchange markets affects each other greatly by past movement in either of the markets. Thus, this affects the investor’s confidence and the level of investment in the markets.
1. Introduction
The introduction of Structural Adjustment Programme (SAP) in the 1990s by the Bretton Woods Institution (BWI) led to a vast spread in the establishment of Nigerian stock market. The aim of BWI was to promote equity financing, reduce debt crises, move from fixed to flexible exchange rate (ER), and manage float ER regime in line with removing trade barriers and other forms of restrictions. Consequently, SAP was fully adopted in 1986 in line with the country’s commitment to strengthen her financial system. After 1986, the market performed relatively well, and the investors were not worried or frightened on the market collapse not until the emergence of global financial crisis, which started to show its effects in the middle of 2007 in Europe, but were experienced in Nigeria in January 2008. During this crisis, the world stock markets have fallen, along with the collapse of large financial institutions such as the African stock markets (e.g. Nigerian stock exchange (NSE)), and other emerging economies. The persistent fluctuations of stock prices (SP) and instability of ERs created doubt in the minds of investors and portfolio managers. This affected the investor’s confidence and general performance of the economy through a drastic fall in the inflow of portfolio investment, especially in Nigeria. The unexpected fall in prices of equities and astonishing fluctuations in ERs left many investors in a state of dismay, owing to further dwindling in stock market indices. Thus, this has made accessibility of loans through equity financing and the distribution of resources in most efficient way more difficult, affecting the performance of the economy due to decline in the inflow of investment (Murinde, Citation1996).
Considering the challenge of global financial crisis, governments in even the wealthiest nations had to come up with rescue packages to bail out their financial systems. This effort led to the unexpected performance of the Nigerian stock market in 2009 with a record of about N12.5 trillion market capitalisations from N9.7 trillion recorded in 2008. However, in 2010, the market experienced a sharp fall in portfolio investment inflow, resulting in a fall in its contribution to GDP from 87.1% to 65.5%, which amounted to about $3.9 billion. Similarly, in 2011, foreign direct investment inflow as a share of GDP, that got to its peak in 2009 with a record of 89.9% drastically fell to 19.7% due to the dwindling confidence, is caused by ER volatility and fluctuation in SP (CBN, Citation2012). As a result, many investible ideas of portfolio managers to buy and sell securities in the market were thrown to an abyss. This caused an increased repatriation of foreign portfolio investments in both the capital and money markets due to the sense of insecurity and fear of losing their investible fund (Zubair, Citation2013; Manasseh et al., Citation2018). The instability of the local currency (Naira) rooted in ER volatility also dared the performance indicators through its ugly influence on SP. Hence, the unstable ER environment and a continuous depreciation of Naira relative to dollar have thrown the investors into sceptic mood, leaving the stock market in a state of chaos which resulted in a withdrawal or loss of N2.8 trillion worth of investment from the market. This was not a very simple arithmetic for an emerging market economy like Nigeria, especially given the fact that many of the investors in the market were yet to understand the full mode of operation of the stock market (Agu, Manasseh, & Aneke, Citation2012).
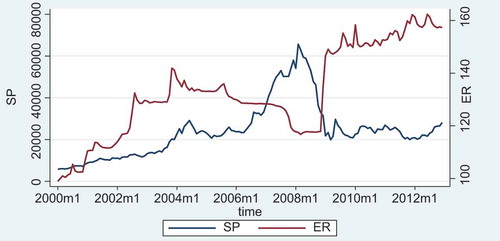
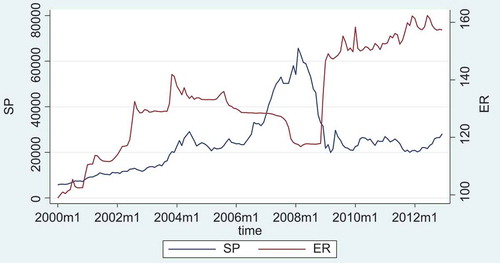
Subsequently, the high rate of ER and the persistent depreciation of Naira have not fared well in Nigeria because of its influence on SP' fluctuations. This has limit the access of quoted firms including the banks to operating capital, reducing the volume and values of stock traded in the market. The interactions of SP and ER in Nigeria have really called for concern in the mind of every meaning Nigerian and policy makers. The persistent increase in ER has been a strong challenge facing the SP. As the ER keeps increasing, the depreciation of the domestic currency (naira) endured. This led to a fall in demand for Nigerian currency (naira), with its consequence on SP (see Figure ). This challenge has been argued to have contributed to the slowdown of Nigerian economy owing to the collapse of investor’s confidence, biting credit crunch, and degenerating business activities (Ngwube & Ogbuagu, Citation2014). Amidst, the market authorities and central government have had incessant policy reforms that could help to restore investor’s confidence and promote economic activities in the country.
Figure 1. NSE monthly all share index and exchange rate in Nigeria 2000–2012.
Source: Author’s Computation.
Different policy interventions aimed at addressing the inherent challenges had been implemented to strengthen the market and to regulate the ER dynamic. These policies include the replacement of Inter-Bank Foreign Exchange Market (IFEM) with Dutch Auction System (DAS) viewed to be more effective than Autonomous Foreign Exchange Market (AFEM). The establishment of Security Acts, Asset Management Corporation of Nigeria, Economic and Financial Crimes Commission as a law enforcement agency investigate financial crimes and money laundering to stabilize the ER environment and restore investors’ confidence in the market (Manasseh, Asogwa, Agu, & Aneke, Citation2014). Yes, certain measures had been taken to stabilize the ER environment and SP, but evidence has shown that these efforts are not translated to improvement in market performance, believing that the reforms seem to be more suitable on paper than proving healthy business environment (Agu et al., Citation2012). However, the understanding of the working of stock price and ER interaction could enhance the effectiveness of policy intervention and provide more insight on the need for ER environment stabilization and the stock price. Therefore, it is pertinent to investigate the nexus, direction of mean spillover, and volatility transmission between SP and ER. Previous studies in the like of Aliyu (Citation2009), Adebiyi, Ayo, and Otokiti (Citation2009), Okpara and Odionye (Citation2012), and Zubair (Citation2013) applied Granger causality and VAR models respectively in estimating the relationship between ERs and SP. However, this study adopted VAR-GARCH model to account for ARCH effect present in most of the financial time series data and detect the volatility response of the variables of interest which was neglected in the above-mentioned studies in Nigeria. This paper is divided into six sections. Section 2 gives the historical overview of ER regimes and stock market development in Nigeria. The review of literature and method for the study was presented in Sections 3 and 4, respectively, while Section 5 presents and discusses the empirical results. Hence, Section 6 presents the policy recommendation and conclusion.
2. History of ER regimes and stock market development in Nigeria
2.1. An overview of foreign ER regimes in Nigeria
Nigeria has experienced various ER systems and undertaken several liberalization measures over the past four decades. Prior to the introduction of SAP in 1986, the country adopted a fixed ER regime supported by exchange control regulations that engendered significant distortions in the economy. During this era, the ER was managed and backed up by control measures, and the conduct of monetary policy under the colonial government was largely dictated by the prevailing economic conditions in Britain (Ifionu & Ogbuagu, Citation2007; Olowe, Citation2009). The ER, which was one of the monetary instruments at the time, was fixed at par between the Nigerian pound and the British pound, and the fixed parity lasted until 1967 when the British pound was devalued (Nnanna, Citation2001). According to Ifionu and Ogbuagu (Citation2007), before and after the establishment of Central Bank of Nigeria (CBN), Nigerian pound was pegged to the British pound and following the floating of the major currencies in 1972, the Nigerian currency was devalued in February 1973 by 10% in sympathy with the dollar devaluation. This development has been linked to many factors. Thus, Nnanna (Citation2001) argued that one of the reasons for devaluating the currency could be the intention of diverting proportion of the country’s resources to finance war, as well as raising the domestic price of imports without any appreciable impact on exports which were largely primary products. This resulted in independently ER management, and the pegging of Nigerian currency to a basket of 12 currencies of her major trading partners in 1978. Furthermore, the regime shift continues until 1982 when comprehensive exchange controls were initiated due to increasing demand for foreign exchange at a time when the supply was shrinking, which further led to foreign exchange crisis occurring the same year (Adeleke and Dallah, Citation2010).
During the SAP period (1986–1995), the pitfalls of the exchange control led to its abandonment. Consequently, market-based system commenced with the SAP. The key element of SAP was free-market determination of Naira ER through an auction system. Apart from the shift to market-determined ERs and ER control deregulation, other policy measures adopted under the previous system were with modifications, where necessary, to accord with the policy framework of the deregulation. Under the new system, the Foreign Exchange Market (FEM) was conceived as a mechanism for the determination of an appropriate ER for the Naira to reduce the pressure on foreign exchange resources and stabilize the balance of payments. In line with the SAP strategy, the Second-tier Foreign Exchange Market (SFEM) was introduced in September 1986. Under the SFEM, the determination of the Naira ER and the allocation of foreign exchange were based on the market forces (Ifionu & Ogbuagu, Citation2007).
With the introduction of SFEM, the Federal Ministry of Finance had its allocative powers transferred to the CBN, but it retained approving powers on public sector interactions. During these periods, different exchange pricing methods were adopted and amongst these methods were the Dutch system, Marginal rate pricing system, and Inter-bank system. The IFEM came into existence with the merging of the official FEM and the Inter-Bank Market in 1989. This was as a result of the loopholes experienced in the DAS. In the same year, the Bureau de Change was introduced with the aim of dealing with privately sourced foreign exchange and IFEM was abolished because it was outlawed. On 5 March 1992, auction system collapsed, but before 5th of March, other auction system were practised (e.g. average rate pricing system with weekly bidding, marginal rate pricing system with weekly bidding, DAS with daily bidding, inter-bank pricing system with weekly bidding etc.), and under each system, some were marked volatile while others were stable. Hence, because of the unsuccessful nature of some reforms, FEM was initiated in 1994—which include pegged Naira ER, centralization of foreign exchange, restriction of Bureau de change to buy foreign exchange as agents of the CBN, reaffirmation of illegality of parallel market and the discontinuation of open accounts and bills for collection as means of payment sectors (Adeleke & Dallah, Citation2010). Then, in 1995 the AFEM emerged, the banks were once allowed to engage in inter-bank dealings with only private sourced foreign exchange, and ERs in the Bureau de Change market are market determined (Ifionu & Ogbuagu, Citation2007).
In addition, during the post-SAP (i.e. from 1995), the FEM was liberalized with the introduction of an AFEM for the sale of foreign exchange to end user by the CBN through selected authorized dealers at market-determined ER. Furthermore, Bureau de Change was once accorded the status of authorized buyers and sellers of foreign exchanges. The AFEM metamorphosed into a daily, two-way quote IFEM in 1999. That is, the dual ER system which was retained in 1998, had its operation modified. Thus, most of the transactions were conducted at AFEM. As a result, the fixed official ER was applicable to only a small proportion of foreign exchange transactions as such unification of the dual ERs was almost accomplished. At present, the dichotomy has been totally eliminated and we now have only IFEM rate applicable to all transactions (Adeleke & Dallah, Citation2010; Ifionu & Ogbuagu, Citation2007).
2.2. Stock market development in Nigeria
Before the emergence of Nigerian capital market, almost all formal savings and deposits were controlled by the banking system, and the country’s substantial resources were invested in London Stock Exchange through London-based stock brokers. With the establishment of Lagos Stock Exchange, in 1960, the Nigerian Stock Market was established and became NSE in 1977 following the Financial Review Committee’s recommendation in 1976 headed by Okigbo with branches in different parts of the country. Initially, the market comprises the NSE with six branches, a number of stock brokerage firms and the Securities and Exchange Commission (SEC). As at 2008, the NSE had 13 branches spread across the country apart from its world-class trading floor in Lagos. These are Abuja, Kaduna, Ibadan, Kano, Port-Harcourt, Onitsha, Yola, Benin, Uyo, Ilorin, Abeokuta, Owerri and Bauchi (SEC).
Stock exchange is a market where those who wish to buy or sell shares, government bonds, debentures and other approved securities can do so through the stockbrokers (Anyanwu, Oyefusi, Oackhenan, & Dimowo, Citation1997). The NSE provides the essential facilities for companies and governments to raise money for business expansion and development projects for the ultimate economic benefit of the society. In other words, it is a self-regulatory organization that provides the framework and facilities for the trading of securities in the secondary market. Through its listing requirements, opportunities for companies and governments to list shares through new issues of securities in primary market abound. Investment analysts are of the opinion that the growth of the Nigerian stock market were influenced by government patronage and reform policies. In the 1970s, government raised funds from the market by floating development stocks. It also enacted legislations which required both the Pension and Provident Funds to invest a substantial proportion of their funds in government stock. The implementation of the Nigerian Enterprises Promotion Decree significantly streamlined the growth of the Nigerian capital market by making more equities available. The Exchange provides a means for trading existing securities. It encourages large-scale enterprises to gain access to public listing. In 1984, the stock market took the initiative of introducing the Second-tier Securities Market) which gives encouragement to small-/medium-scale industries to seek quotation on the stock exchange by stipulating less stringent listing requirements. The Nigerian equity market has improved over the years looking at the infrastructural facilities, market integration and awareness creation. This has promoted the efficiency of information and resource allocations to an extent. Though the market is still under the attack of poor rating of World Bank ease of doing business, and this has affected not only the investors’ confidence but the economy in general.
The role of infrastructural facilities in attracting foreign portfolio investment cannot be over emphasized. In many economies, information technology is tipped a part to development (Ekineh, Citation2003). The NSE incorporated the Central Securities Clearing System (CSCS) (i.e. the Clearing House) as a subsidiary company to establish and manage an automated clearing and settlement system for the Nigerian stock market. The CSCS had set the pace in electronic trading on the Nigerian Stock Market (NSE). This has made the market more efficient, investor friendly and internationally attractive. As a result of this stride, settlement period has reduced from T + 14 days to T + 3 days. This development has contributed positively to the market. The Guarantee Fund, as distinct from the Investors Protection Fund, is a necessary component of the Clearing House System. It is a pool of funds to which stock broking firms contribute specific amount so that any over trading by brokers, beyond what the funds in their Trading Accounts can cover, is settled from the Fund (SEC, Citation2006). In an attempt to make the market cost effective for its users, SEC took various efforts to reduce market transaction cost. According to SEC (Citation2009), high transaction costs impact negatively on yields and reduces the frequency of trades with attendant effect on liquidity as investors will have to weigh gains to cover all transaction costs before disposing their investments. Before 2007, transaction cost on equity in the primary market was 6.92%, while that of bonds was 7.03%. But on 24 April 2007, they were reduced to 4.32% and 4.97%, respectively. Similarly, transaction costs on equities in the secondary market were reduced on the buy-side from 4.07% to 2.36%, while the sell-side fell from 4.12% to 2.65% (Chuks; Nwaora cited in Okpara & Odionye, Citation2012). Since then, there have been further adjustment in the transaction cost of equity in the Secondary market. As of March 2013, for transaction amount less than 1 million, the cost of buying is 1.86% and 2.19% when selling. For larger transactions, commission and fee total were 1.49% of the total transaction value to buy and 1.82% of the total transaction value to sell (SEC, Citation2013).
The NSE became internationalized in 1995. The major policy reforms leading to this change were the abrogation of the Nigerian Enterprises Promotion Decree of 1989, the Exchange Control Act of 1962 and their respective replacement by the Nigerian Investment Promotion Commission Decree 16 of 1995 and the Foreign Exchange Decree 17 of 1995. The seven-man committee, led by Chief Dennis Odife, recommended the enactment of a more comprehensive capital market law which gave birth to enactment of Investment and Securities Act Number 45 of 1999. The Act amended a number of legislations including the Securities and Exchange Commission Decree No. 29 of 1988, the Lagos Stock Exchange Act of 1961, the Nigerian Enterprises Promotion Issue of Non-Voting Equity Shares Decree 1990; part XVII of the Companies and Allied Matters Decree of 1990, Section 3(d) of the Capital Gains Act and Sections 1(2), 3(a), (4) and (5) of the venture capital—Incentives Decree 1993 (SEC, Citation2008). Given the abrogation of the laws, foreigners now participate in the market both as operators and investors. Also, there are no more limits to the percentage of foreign holding in any company registered in Nigeria. Transaction on the Exchange is regulated by the NSE, as a self-regulatory organization, and SEC. Giving these improvements in the NSE, it can be conjectured that there should be commensurate improvements in its level of efficiency. Also, the BB-rating by two leading international global rating agencies in 2007 has helped in rebuilding confidence in the Nigerian economy.
This development had resulted in the significant influx of foreign investment and tremendous development in the market (SEC, Citation2009). In response to the forces of globalization, the Exchange became the fourth stock exchange in the world to be hooked on-line through the Routers Electronic Contributor Systems (RECS) which daily beams Nigeria’s stock market information to the global community. The ECS service provides automated access by foreign investors to relevant information on companies quoted on the NSE (SEC, Citation2009). In terms of market awareness, there is a gradual shift in the funding sources for private investments with the stock market taking a lead. Public business community and various tiers of government were becoming more enlightened on the operation of the stock market in recent times (Tanko, Citation2004), and resulting increase in market operators has created a healthy competition as the operators seek to enlarge the market by creating awareness of the benefits of participating in the capital market (SEC, Citation2009).
3. Theory and empirical review of literature
The classical theory in economics suggests that SP and ERs interrelate. The first approach involved the flow-oriented theory (Dornbusch & Fischer, Citation1980). This approach argued that ER fluctuations could cause stock price instability. This theory is built on the macro-view that supports the premise which maintained that SP represent present value of a firm’s expected future cash flows, and any occurrence that affects firm’s cash flow will reflect in that firm’s stock price if the market is efficient (Richards, Simpson and Evans, Citation2009), and otherwise if the market is inefficient. According to Franck and Young (Citation1972), the effect of ERs on SP depends on whether the listed firms were multinational or domestic in nature. In the case of multinational firms, the value of ERs and the values (profit or loss) of the multinational firms also change, which affectthe company’s share prices. But the way in which the movements in ER affect firm’s earning and its stock price depend on the characteristics of firms. Certainly, because of the differences in firm’s characteristics, their values tend to be affected by ER movements in a different way. Although the increasing use of derivatives like forward contracts and currency options could help to reduce the effect of ER fluctuations on the firms earning (Richards et al. Citation2009). Hence, flow-oriented theory sometimes referred to as traditional approach strongly believes that there exists a causal relationship between ERs and SP which runs from the former to the latter (Dornbusch & Fischer, Citation1980), and studies by Aggarwal (Citation1981), Soenan and Hennigar (Citation1988) and Tabak (Citation2006) provided some evidence in support of the theory.
Aggarwal (Citation1981) examined the relationship between ERs and SP. He looked at the correlation between changes in US trade-weighted ER and US stock market indices each month for the period 1974–1978. The evidence revealed that the US trade-weighted ER and US stock market indices were positively correlated during this period. Thus, from the findings, the study draws an inference by concluding that the interactions of the two variables are consistent with the flow-oriented theory, which claimed that ER movements could affect the SP of multinational firms directly by influencing the value of its overseas operations and indirectly on the domestic firms through the influence on the prices of its exports or its imported inputs. In contrary, Soenan and Hennigar 's (Citation1988) study reveals the existence of significant negative correlation between the effective value of the US dollar and changes in US SP using monthly data for the periods 1980–1986, while the report from Tabak (Citation2006) shows no long-run relationship between stock price and real ER in Brazil, but with evidence of nonlinear causality running from ER to SP.
Contrary to flow-oriented theory, stock-oriented theory put forward that improvement in stock market affects ER through liquidity and wealth effects. Hence, stock-oriented theory as proposed by Frankel (Citation1983) and Branson (Citation1983) pointed that capital account is the major determinant of ER. The postulate of this theory implies that decrease in SP reduces local investor’s wealth, which in turn lowers their demand for money. Consequently, as the demand for money falls, banks will react by lowering interest rates which in turn dampens capital inflows. This may likely reduce the demand for local currency further and thus results in depreciation of the local currency. Since domestic and foreign assets are not perfect substitutes in the portfolio balancing effect, as investors adjust their portfolio ratio of domestic to foreign assets in response to changes in economic conditions, the ER responds accordingly. However, this theory is consistent with the findings of studies by Aliyu (Citation2009), Adebiyi et al. (Citation2009), and Okpara and Odionye (Citation2012), which shows a long-run relationship between SP and ER as well as unidirectional causality running from SP to real ER. Though Zubair's (Citation2013) studies in Nigeria show evidence of no long-run relationship between SP and real ER, but found a unidirectional causality running from SP to real ER. Zubair (Citation2013) further investigates the long-run relationship before and after the 2008 financial crises using a monthly data that span the periods 2001–2011, and found no existence of long-run relationship before and after the 2008 financial crises.
Cross-country evidence from the past studies has shown mixed findings. While some findings are consistent with flow-oriented theory, others contradicted the theory and lay a support to stock-oriented theory. In a study by Agus and Carl (Citation2004), there exists a co-integrating relationship among the four countries—Indonesia, Philippines, Singapore and Thailand with evidence of unidirectional causality running from ER to SP using weekly data that covered 1 January 1993 to 31 December 2002. But in a similar study by Smyth and Nandha (Citation2003) in Bangladesh, India, Pakistan and Sri Lanka, there was no evidence of long-run relationship between SP and ER in any of the four countries. However, there exists a unidirectional causality running from ER and SP especially in India and Sri Lanka. In addition, Yau and Nieh (Citation2009) investigated the relationship between Taiwan and Japan with monthly data running from 1991 to 2005. Their findings show the existence of no cointegrating relationship between SP and ER. Further inquiry reveals no causality existing between financial variables in Taiwan and Japan. Findings from other studies such as Diamandis and Drakos (Citation2011), Muhammad and Rasheed (Citation2011) and Alagidede, Panagiotidis, and Zhang (Citation2010) are consistent with those of Yau and Nieh (Citation2009). But further inquiry by Muhammad and Rasheed (Citation2011) revealed a bidirectional causality between SP and ER among the four countries—Pakistan, India, Bangladesh and Sri Lanka. Tsai's (Citation2012) study on six selected Asian countries such as Singapore Thailand, Malaysia, Philippines, South Korea and Taiwan shows a negative relationship between ER and SP. The observed inverse relationship is more pronounced when the rates of exchange are extremely low or high, thus supporting the portfolio balancing effect, which postulates that an increase or decrease in the value of stock price results in an appreciation or depreciation of domestic currency through a decrease or increase in ER. According to Tsai's (Citation2012) findings, the relationship is not homogeneous across the six selected Asian countries and across market situations.
Lin (Citation2012) examined the relationship between the ER and SP in Asia’s emerging markets from 1986 to 2010 using monthly data and ARDL method for analysis. This method was designed to account for structural breaks. The results from cointegration tests as well as the short-run causality tests indicate co-movement between ER and SP. The findings also show that SP increase during times of economic crisis but reduce when the economies are stable. The results also show that most spillovers are from stock price shocks to ERs. In Bhunia (Citation2012), there exists a causal relationship between ER and all stock indices. This finding suggests an outcome of a study conducted on the causal relationship between SP and ERs in India. Seong (Citation2013) examined the reactions of ERs towards Malaysia stock market during January 1981 to October 2013. This study utilized the Engle–Granger Cointegration and Error Correction Model to determine long-run relationships and the speed of adjustment between all variables. The study applied VAR Granger causality to define the causal relationship between variables. The results revealed significant negatively short-run and long-run associations between ERs and Malaysia stock market which is consistent with the findings of Mlambo, Maredza, and Sibanda (Citation2013), which assessed the effects of currency volatility on the Johannesburg Stock Exchange. Similarly, Paramati and Gupta (Citation2013) on a relationship between ERs, call money and stock returns in India show evidence of bidirectional relationship between call money rates and ERs. The study also identified that call money rates and ERs in Granger causality test cause stock returns and did not find reverse causality from stock returns to call money rates and ERs. To explore lead–lag interaction among the variables, the study employed VAR models. The results suggested substantial lead–lag relationship from call money rates to ERs and stock returns. A similar relationship was also found from ERs to call money rates and stock returns. However, there was no evidence of lead–lag causation from stock returns to call money rates and ERs.
Hussian and Bashir (2013) study on the dynamic linkages between ERvolatility and stock returns volatility in Pakistan, India and China for the period 2007–2012 shows little evidence of cointegration relationship between ERand stock returns volatility for all the countries studied. Furthermore, the Granger causality test also confirmed that there is no causal relationship between ERand stock returns volatility for India and China, but for Pakistan. Athanasios and Costas (Citation2013) examined the nexus of SP and ERin the EU and USA during the era financial crisis—2008–2012. The results exhibit a causal relationship from SP to ERs. Caporale, Hunter, and Ali (Citation2013) examined the nature of the linkages between stock market prices and ERs in six advanced economies like the US, the UK, Canada, Japan, the euro area, and Switzerland, using data on the banking crisis between 2007 and 2010. Bivariate GARCH-BEKK models were estimated, which produced evidence of unidirectional spillovers from stock returns to ERchanges in the US and the UK, in the opposite direction in Canada, and of bidirectional spillovers in the euro area and Switzerland. Furthermore, causality-in-variance from stock returns to ER changes was found in Japan and in the opposite direction in the euro area and Switzerland, whilst there was evidence of bidirectional feedback in the US and Canada. Inci and Lee (Citation2014) examined the relation between stock returns and changes in ER in five major European countries—France, Germany, Italy, Switzerland, and the UK. The study found a significant impact of lagged ERs on stock returns. There is also evidence of Granger causality from ERchanges to stock returns.
4. Model for the study
The multivariate VAR-GARCH model in BEKK representation is employed for the analysis of interactions between SP and ER. The mean spillover between the two variables of interest is captured via the conditional mean equation while the volatility transmission between the two variables can be captured through the conditional variance (Ht) of the VAR-GARCH model expressed as follows:
where = [RSPt and RERt] and expresses the rate of changes in market price level denoted with i (i = 1 for SP, and i = 2 for ER).
= [
,
]T is the random error at time t, which indicates the effect of innovation in the market as at the time of the study. Equation (4.1) is also augmented by a lagged error correction term (ectt-1). Thus, the conditional mean equation becomes
where is the coefficient of the error correction term, while other notifications remained the same as defined earlier. The conditional variance is thus expressed in Equation 4.4.
where is white noise process with the covariance matrix I. B is the 2 × 2 upper triangular matrix. The element of
of the 2 × 2 matrix
indicates the impact of market
volatility on market
and reflects ARCH effect of volatility. The element
of the 2 × 2 matrix
as shown in Equation 4.5 indicates the persistence of volatility transmission between market
and
, and reflects GARCH effect of volatility. The bivariate conditional variance equation can be more explicitly represented as follows:
where denotes the variance of stock price return,
denotes the covariance of stock price return and the change rate in ER, and
denotes the variance of changes in ER. To investigate the volatility spillover effect from stock price to foreign ER, we tested if the coefficients
and
are statistically different from zero. Also, we trace the volatility transmission from FEM to stock market by looking at the statistical significance of the coefficients
and
. If there is no evidence of volatility spillover effect between foreign exchange and stock markets, the non-diagonal elements
,
,
and
of matrices
and
will not be statistically significantly different from zero. The volatility spillover effects are checked by likelihood ratio statistic:
where and
show the values of constrained log-likelihood function and unconstrained log-likelihood function, individually.
follows the chi-squared distribution with the degrees of freedom of the number of constrained conditions. For a wide range of financial data series, time-varying conditional variances can be well explained through the use of the Autoregressive Conditional Heteroscedasticity (ARCH) of Engle (Citation1982) and the Generalized ARCH (GARCH) technique developed by Bollerslev (Citation1986). However, it is commonly accepted that multivariate GARCH specifications such as BEKK model of Engle and Kroner (Citation1995), CCC-GARCH model of Bollerslev (1990) and DCC-GARCH model of Engle (2002) are more relevant than univariate settings as far as volatility transmission issues among multiple financial variables are concerned (Abdalla, 2012). The choice of VAR-GARCH model in BEKK representation is made based on its significance in multivariate analysis of conditional volatility, and conditional cross effects and volatility spillovers between series. The model also provides efficient estimates of unknown parameters. This approach has been applied in various studies such as Chan, Jegadeesh, and Lakonishok (Citation2006), Hammoudeh, Ramazan, and Alesia (Citation2009), Chang, Chiang, Wehner, Friedman, and Ruedy (Citation2011), Arouri, Jawadi, Louhichi, and Nguyen (Citation2011) and Abdalla (2013), and appears to provide meaningful and interpretable coefficients.
4.1. Estimation procedure
Because the order of integration of a time series is of great importance for time-series analysis, unit root test was carried out. The Engle and Granger (Citation1987) and Johansen cointegration by Johansen (Citation1990, Citation1992) were employed to determine the number of cointegrating vectors. The advantage of this approach is based on its strength to resist normalization problem and departure from normality (Gujarati, Citation2003). To ensure the suitability of model, ARCH test was performed to examine the ARCH effects on the residuals of the series. The presence of ARCH effects should indicate the appropriateness of the VAR-GARCH framework.
4.1.1. Unit root test
To avoid a spurious regression and to test for a long relationship between the SP and ER, the order of integration of each variable becomes important. Various parametric and non-parametric tests have been developed to investigate whether a series is stationary or contains a unit root. Thus, this study adopted Augmented Dickey–Fuller (ADF) and Phillip–Perron to identify if the series used contain unit roots. Comparing the obtained t-statistics with the critical value, the decision on whether to accept or reject H0 hypothesis will be made. According to Enders (Citation1995), H0 indicates the non-stationarity of the series, while the alternative hypothesis shows the stationarity of the series. If the computed value is higher than the critical value, then H0 hypothesis is rejected and the series is decided to be stationary (Fuller, Citation1976). In general, an ADF (p) model is given:
The information criterion for the order of lags (p) in Equation (4.7) is Bayesian Schwarz. If the resulting model has white noise residuals or serial correlated, the order of lags will be augmented until residuals with no serial correlation are obtained.
4.1.2. Cointegration test
To examine the presence of long-run relationship between the series, different cointegration techniques were adopted—Engle and Granger (E-G) and Johansen cointegration.
4.1.3. E-G cointegration
The first test is the pairwise Engle and Granger (Citation1987) two-step procedure, which is based on the following cointegration regression:
where SPt and ERt remain as defined above. If the estimated residuals of the regression and
are found to be stationary using the ADF unit root test, then cointegration exists between SPt and ERt. The null hypothesis of no cointegration (H0: δ = 1) is estimated by the test of statistic and compared with the MacKinnon (Citation1991) critical values. The choice of optimal lag length in the ADF test is based on Akaike information criterion.
4.1.4. Johansen cointegration
Although E-G cointegration method could have been adequate in a bivariate system, additional evidence of cointegration would help to provide a more accurate result. To strongly ascertain the evidence of cointegration (if any), we chose to compare the results obtained from E-G cointegration to Johansen cointegration test. Johansen proposed a maximum likelihood estimation procedure, which allows simultaneous estimation of the system involving two or more variables to circumvent the problems associated with the traditional regression methods. Further, this method is independent of the choice of endogenous variable, and it allows estimation and test in the presence of more than one cointegrating vectors in the multivariate system. Therefore, multivariate Johansen cointegration test was adopted, incorporating other variables, such as interest rate and consumer price index (CPI), that might influence the relationship between SP and ER. In general, Johansen co-integration test is given by Equation (4.10):
where is a vector of non-stationary I(1) variables;
is a vector of deterministic variables and
is a vector of innovations. We may rewrite this as in VAR form as
where
If the coefficient matrix has reduced rank r < k, then there exists k < r matrices. r is the number of cointegrating rank and each column of
is the cointegrating vector. Johansen’s method is to estimate the
matrix from unrestricted VAR and to test whether the rejection implies by the reduced rank, and in such situation
should be integrated of 1(0). Hence, if evidence of cointegration exists between SP and ER, the VAR model in Equation (4.1) should incorporate the error correction terms, to determine the speed of adjustment of the series to long-run equilibrium.
4.2. ARCH effects test
Before estimating ARCH models, it is important to check the presence of ARCH effects to determine the appropriateness of the GARCH estimation method. This test is performed by testing Breusch–Pagan, which entails estimating the mean equation in Equation (4.1) using OLS estimation techniques to obtain the residuals, and then run an auxiliary regression of the squared residuals upon the lagged squared terms and a constant. Under the null hypothesis of homoscedasticity, the resulting test statistic follows a chi distribution. Rejection of the null suggests evidence of ARCH effects.
5. Empirical results
Several tests such as descriptive statistics, unit root test, cointegration test and ARCH test were performed to examine the data characteristics. This was done to avoid spurious results and to make sure that the estimation technique of VAR-GARCH chosen is appropriate for the study. The result of the study is presented in the following sections.
5.1. Descriptive statistics
Descriptive statistics were performed to examine if the SP and ERexhibit time-varying volatility and leptokurtosis characteristics. The statistics of the SP and ERseries are presented in Table .
Table 1. Descriptive statistics
From Table , we observed high standard deviation values for both SPt and ERt indicating that both series have high variations making the series prone to be highly volatile. The skewness statistic shows that SPt is positively skewed while ERt is negatively skewed. This implies that both series are not symmetric; while SPt has extreme tail to the right, ERt has extreme tail to the left. Also, the kurtosis statistic shows that SPt is platykurtic while ERt is leptokurtic. The Jarque–Bera statistic which combines both skewness and kurtosis statistics show that we can reject normality assumption for both SPt and ERt.
The results of Table show that the SP (SPt) and exchange rate (ERt) are stationary at levels, because the computed value is greater than the critical value (−2.10 > −2.88) at 5% level of significance. As stock price return and ER changes series are integrated of the same order I(0), we test for the long-run relationship between the two variables of interest.
Table 2. Unit root test results
5.2. Cointegration test result
A prerequisite step for specifying the conditional mean equation (Equation 4.1) is examining the long-run time-series properties of stock market prices and ERs to know whether they are cointegrated or not, because the series under observation appeared to be I(0). In this subsection, the study reports the estimated cointegration results of the pairwise Engle and Granger (Citation1987) two-step procedure and the Johansen (Citation1992) multivariate technique.
5.3. E-G cointegration test results
The E-G test is referred to as residual-based approach. It tests the stationarity condition of the residual obtained from the regression of the relationship between SP and ERas specified in Equations 4.8 and 4.9. The null hypothesis of no cointegration is rejected if the ADF statistic exceeds the critical value. The result for the E-G test is shown in Table .
Table 3. Engle–Granger test results
From the above results as presented in Table , the null hypothesis of no cointegration is rejected, since the ADF test statistics are significant at level. Therefore, based on the residual approach of cointegration test, the study concludes that there exists a cointegrating relationship between the SP and ER.
5.4. Johansen cointegration test result
To confirm the result yielded by E-G cointegration test and to ensure robustness of the results, we further examine Johansen cointegration test incorporating other control variables, like interest rate and CPI, to check if these macroeconomic variables influence the relationship between SP and ERas well avoid simultaneity bias in single equation model. Two statistical tests were used in Johansen cointegration tests: trace and the maximal Eigen value test. The first row in the table tests the hypothesis of no cointegrating relation, the second row tests the hypothesis of one cointegrating equation, etc., against the alternative of full rank of cointegration. The result is presented in Table .
Table 4. Johansen cointegrating test result
The test results in Table fail to reject the null hypothesis of no cointegration between the variables at 5% significance level. This is consistent with the previously obtained result of E-G cointegration test. Therefore, the study concludes that there is a significant long-run relationship between SP and ERin Nigeria. These findings are consistent with Agus and Carl (Citation2004), Seong (Citation2013), and Athanasios and Costas (Citation2013). Furthermore, to circumvent potential missing variable errors in the conditional mean in Equation 2.1, the model is extended to incorporate the underlying short-run deviation between SP and ERin the conditional mean; therefore, Equation 4.3 becomes the appropriate model to be estimated.
5.5. ARCH effects results
Brooks (2008) argues that it is worthwhile first to compute the ARCH test to make sure that this class of model (GARCH) is appropriate for the data. In this regard, the ARCH test was used to test for ARCH effects on the residuals of series. The results are presented in Table .
Table 5. ARCH test result
Table shows that the statistic labelled “Obs*R-squared“ (i.e. the ARCH test of autocorrelation in the squared residuals) is 29.37 and 16.56 for SP and ERwith a probability value 0.0000 and 0.0024, respectively. This clearly suggests the rejection of null hypothesis of homoscedasticity or that ARCH effects are present. In other words, the zero probability value strongly shows the presence of heteroscedasticity in the residual. Therefore, the result suggests that the GARCH model is appropriate for the current study.
5.6. VEC-GARCH model results
The study estimates simultaneously the conditional mean and time-varying variance-covariance equations by the maximum log-likelihood method. The estimate of the multivariate VAR (1)—GARCH (1,1) in the BEKK model allows us to study the dynamic mean spillover and volatility transmissions between stock and FEMs. The estimated results for VAR (1)—GARCH (1,1) are displayed in Table .
Table 6. Parameter estimates of conditional mean equation
Table 7. Parameter estimates of conditional variance equation
Table 8. Test of volatility spillover effects
Table presents the results of the interactions between stock return and changes in ER. From the mean equation results, the first diagonal parameter is significant with respect to stock return suggesting that stock return depends on their first lag value. On the other hand, the insignificant diagonal parameter of ERindicates that changes in ER do not depend on their past changes. The mean spillovers between stock and FEMare represented by the off-diagonal parameters of the matrix. The off-diagonal parameter result shows that there is significant negative return spillover (a21) from stock market to FEM. On the other hand, there is no significant return spillover from FEMto stock market (a12). This implies that if there exist positive stock return (i.e. stock price appreciation) in the current period, there may exist negative ERreturn (ERappreciation) in the next period. This suggests that the inclusion of stock market performance when modelling foreign exchange may improve its forecast performance. This result validates the proposition of portfolio balance model on the relationship between SP and ERs. In addition, the finding of this study is consistent with the results of Adebiyi et al. (Citation2009) and Okpara and Odionye (Citation2012) in terms of direction of relationship between the two markets, but contradicts the works of Granger, Huang, and Yang (Citation2000) which suggested that the ERled stock price in Korea. On the basis of the results of the cointegration tests, the lag error correction terms are included in the conditional mean equations. The coefficient of the error term (ѱ) is negative and significant only in the equation for ER changes, suggesting that the adjustment towards equilibrium takes place through this variable and more so the speed of adjustment is slightly faster in the exchange market than the stock market.
Meanwhile, the result from the variance equation shows that there is volatility persistence in stock market with positive significance ARCH term (c11) and GARCH term (g11). This implies that shocks and past period volatility are major drivers of stock market volatility. In other words, an unanticipated rise or fall in SP and fluctuation in the number of deals experienced by stock investors in the immediate past period may fuel volatility in the stock market. In essence, greater uncertainties in the stock market in the current period may lead to panic stock trading and consequently generate higher volatility in the future period. Furthermore, the result reveals that there is no volatility persistence in FEM in the presence of insignificant GARCH term (g22). Nonetheless, the volatility in the market is shown to be due to shocks and innovations in the immediate past period. This implies that if there exist unanticipated rise or fall in ER in the current period, the FEMmay experience greater fluctuations in exchange in the next period. Hence, considering the cross-volatility effects between stock and FEMusing likelihood ratio statistic, we observed null hypothesis of non-diagonal elements of matrices C and G to be 0 with chi-squared distribution having degree of freedom 4 to be rejected at 1% level of significance. Thus, there exists the cross-volatility spillover effects between the two markets. The study further examined the directions of volatility spillovers. The result shows significant volatility spillover from stock market to exchange market and persistent volatility spillover from FEMto stock market, and they are positive and statistically significant.
In the unidirectional causality from stock to FEMs, the likelihood ratio statistic (62.3921) with the chi-squared distribution having degree of freedom 2 is significant at 1% level of significance. Hence, suggesting the existence of volatility spillover effects from stock to FEMs. This indicates a unidirectional causality in variance from SP to ERs. It implies that persistent volatility in stock market has a significant effect in increasing the current period volatility in ER. This is however not impossible since ERreturn is significantly dependent on the past value of stock returns which is inadvertently affected by persistent volatility in the market. Also, the results show a unidirectional causality from foreign exchange to stock markets. The likelihood ratio statistic (476.9999) with chi-squared distribution having degree of freedom 2 is significant at 1% level of significance. Therefore, there exists also volatility spillover effects from ERto SP. In summary, there is bidirectional volatility spillover effects between ERand SP, indicating the past innovations in stock market have great effect on future volatility in exchange market, and vice versa.
5.7. Discussion
The E-G residual method of cointegration showed long-run relationship between SP and ER. When Johansen cointegration test and CPI proxied for inflation and interest rate were incorporated, the result showed the existence of cointegration between SP and ER. This means that there exists a stable long-run relationship between SP and ER. Thus, the error correction term was taken into account and the VAR model in the conditional mean equation was modified to VEC model. The mean equation in the VEC-GARCH model reveals significant mean transmission from stock price to ER. Moreover, movements of SP affect the ER, but on the other hand, there is no significant return spillover from ERto stock price. This implies that if there exist positive stock return in the current period, there may exist negative ERreturn in the next period. The coefficient of the error term is negative and significant only in the equation for changes in ERs, suggesting that the adjustment towards equilibrium takes place through this variable and more, so the speed of adjustment is slightly faster in the exchange market than the stock market. The variance equation in the VEC-GARCH framework indicates that there exists significance ARCH and GARH terms in the stock market while exist insignificance GARCH term in the exchange market. Therefore, the time-varying and persistent characteristics of the stock market is higher than those of the exchange market. The SP are more sensitive than the ERin the reactions to information, and the investment risks of the stock market are higher than the exchange market. Furthermore, causality-in-variance test results of the volatility spillover show a bidirectional short-term volatility spillover effects between foreign exchange and stock markets, indicating the past innovations in stock market have the great effect on future volatility in exchange market, and vice versa.
6. Policy recommendations and conclusion
In view of the findings of the study and the relevance of stock and exchange market, the market authorities should ensure and pursue stable ERpolicy because its influence promotes growth in the stock market and other sectors of the economy. Therefore, anti-inflationary policy like inflation-adjusted interest rate policy should be pursued to attract foreign investors and discourage capital flight in the country. Government and market authorities should ensure meritocracy in the choice of appointees as top executive’s offices in SEC and NSE without political sentiment. The appointment of an experienced and right-minded person could promote research in NSE and the outcome could be used for more policy options. In addition, it is recommended that appropriate macroeconomic policies are put in place to promote the capital market growth since volatility in macroeconomic environment could spill over into the capital market especially in import oriented economies like Nigeria. Non-volatile macroeconomy, particularly the FEM, is suitable for promoting domestic and foreign investments. Whereas an unstable FEMincreases operating risks of companies by increasing their costs and hence hurting their profitability, growth and survival. This is important because the nature of FEM necessitates the use of forward contracts, options, and futures to hedge against potential risk from trade transactions. Finally, there is need to align with a trend in infrastructure development like power, transport, water, as this will reduce the operating cost, increase firms’ profits and stabilize SP which will in turn attract foreign investors and sustain growth in the country.
Cover Image
Source: Author
correction
This article was originally published with errors, which have now been corrected in the online version. Please see Correction (http://dx.doi.org/[10.1080/23322039.2020.1752449)
Additional information
Funding
Notes on contributors
Charles O. Manasseh
Dr Charles Manasseh is currently a lecturer in Banking & Finance Department, University of Nigeria. He is also an adjunct lecturer in the Department of Economics, Coal City University Enugu; Institute of Climate Change Study, Energy and Environment, University of Nigeria; and National Open University, Enugu Centre. He obtained an MSc degree in Monetary Economics from the University of Nigeria in 2008 and a PhD in Financial Economics in 2015 as a Council for Social Science research scholar (CODESRIA) in Africa. He previously worked as a project coordinator at Remif Rems Nigeria Limited, USAID MARKET II Consult. He has actively participated in many research consultancies such as Centre for Entrepreneurship Development Research on youth empowerment facilitated by Central Bank of Nigeria; Assessment of Economic Impacts of Avian Influenza in Nigeria conducted by International Institute of Tropical Agriculture (IITA) Ibadan, Measurement and Benchmarking of Nigeria’s Digital Opportunities Index commissioned by Nigerian Communications Commission, and Customer Satisfaction in Nigeria sponsored by Nigeria Communications commission.
References
- Adebiyi, A. A., Ayo, C. K., & Otokiti, S. O. (2009). Stock price prediction using hybridized market indicators. Proceedings of international conference of artificial intelligence and pattern recognition, MultConf’2009 (pp.372–19). USA.
- Adeleke, I., & Dallah, H. (2010). Time series forecasting of naira against major currencies exchange rates. International Journal of Applied Mathematics and Statistics, 19(D10).
- Aggarwal, R. (1981). Exchange rates and stock prices: A study of the US capital markets under floating exchange rates. Akron Business and Economic Review, 12, 7–12.
- Agu, D. O., Manasseh, C. O., & Aneke, G. C. (2012). The relative importance of macro and firm-level fundamentals to Nigerian stocks’ prices: Lessons for other emerging markets. Journal of Economics and Sustainable Development, 3(14).
- Agus, D., & Carl, B. (2004). Stock price and exchange rate causality: The case of four SEAN countries. Applied Financial Economics, 6, 5–15.
- Alagidede, P., Panagiotidis, T., & Zhang, X. (2010). Causal relationship between stock prices and exchange rates. The Journal of International Trade & Economic Development, 20(1), 67–86. doi:10.1080/09638199.2011.538186
- Aliyu, S. U. R. (2009). Oil price shocks and the macroeconomy of Nigeria: A non-linear approach (Munich Personal RePEc Archive, MPRA Paper No. 18726). Retrieved from http://mpra.ub.uni-muenchen.de/18726/
- Anyanwu, J. C., Oyefusi, A., Oackhenan, H., & Dimowo, F. A. (1997). The structure of Nigerian economy (1960–1997). Onitsha: Joanee educational publishers.
- Arouri, M. H., Jawadi, F., Louhichi, W., & Nguyen, D. K. (2011). Nonlinear shift contagion modeling: Further evidence from high frequency stock data. halshs-00601428
- Athanasios, T., & Costas, S. (2013). A long-run relationship between stock price index and exchange rate. A structural non-parametric cointegrating regression approach. Journal of International Market Institutions and Money, 25, 106–118. doi:10.1016/j.intfin.2013.01.008
- Bhunia, A. (2012). A causal relationship between stock indices and exchange rate: Empirical evidence from India. Research Journal of Finance and Accounting, 3(1), 47–63.
- Bollerslev, T. (1986). Generalized autoregressive conditional heteroscedasticity. Journal of Econometrics, 31, 307–327. doi:10.1016/0304-4076(86)90063-1
- Branson, W. H. (1983). Macroeconomic determinants of real exchange rate risk. In R. J. Herring (Ed.), Managing Foreign exchange rate risk. Cambridge, MA: Cambridge University Press.
- Caporale, G. M., Hunter, J., & Ali, F. M. (2013). On the linkages between stock prices and exchange rates: Evidence from the banking crisis of 2007–2010 (Economics and Finance Working Paper Series; Working Paper No. 13–07). London: Department of Economics and Finance, Brunel University. Retrieved from http://www.brunel.ac.uk/__data/assets/pdf_file/0005/285647/1307.pdf
- CBN. (2012). Central Bank of Nigeria statistical bulletin. Retrieved from www.cbn.gov.ng/documents/Statbulletin.asp
- Chan, C. K., Jegadeesh, N., & Lakonishok, J. (2006). Earnings quality and stock returns. Journal of Business, 79(3), 1041–1082. doi:10.1086/500669
- Chang, C.-Y., Chiang, J. C. H., Wehner, M. F., Friedman, A., & Ruedy, R. (2011). Sulfate aerosol control of tropical Atlantic climate over the 20th century. Journal of Climate, 24, 2540–2555. doi:10.1175/2010JCLI4065.1
- Diamandis, P. F., & Drakos, A. A. (2011). Financial liberalization, exchange rates and stock prices: Exogenous shocks in four Latin American countries. Journal of Policy Modelling, 33, 381–394. doi:10.1016/j.jpolmod.2010.11.004
- Dornbusch, R., & Fischer, S. (1980). Exchange rates and the current account. American Economic Review, 70(5), 960–971.
- Ekineh, D. (2003). Deepening the Nigerian capital market: Regulatory, supervisory and operational imperative in a global financial environment. Abuja: Security and Exchange Commission.
- Enders, W. (1995). Applied econometric time series. In Business & economics (pp. 433.)
- Engle, R. F. (1982). Autoregressive conditional heteroskedasticity with estimates of the variance of U.K. inflation. Econometrica, 50(4), 987–1008. doi:10.2307/1912773
- Engle, R. F., & Granger, C. W. J. (1987). Cointegration and error correction: Representation, estimation and testing. Econometrica, 55, 251–276. doi:10.2307/1913236
- Engle, R. F., & Kroner, K. (1995). Multivariate simultaneous generalized ARCH. Econometric Theory, 11, 122–150. doi:10.1017/S0266466600009063
- Franck, P., & Young, A. (1972). Stock price reaction of multinational firms to exchange realignments. Financial Management, 1, 66–73. doi:10.2307/3665374
- Frankel, J. A. (1983). Monetary and portfolio-balance models of exchange rate determination. In J. S. Bhandari & B. H. Putnam (Eds.), Economic interdependence and flexible exchange rates. Cambridge, MA: MIT Press.
- Fuller, W. A. (1976). Introduction to statistical time series. New York: John Wiley and Sons. ISBN 0-471-28715-6.
- Granger, C. W. J., Huang, B. N., & Yang, C. W. (2000). A bivariate causality between stock prices and exchange rates: Evidence from recent Asia flu. The Quarterly Review of Economics and Finance, 40, 337–354. doi:10.1016/S1062-9769(00)00042-9
- Gujarati, D. N. (2003). Basic Econometrics (4th ed.). New York: McGraw-Hill Higher Education.
- Hammoudeh, S. M., Ramazan, S., & Alesia, E. (2009). GCC petrodollar surpluses and the US current account imbalance. doi:10.5455/ey.10695
- Ifionu, P. E., & Ogbuagu, A. (2007). An econometric evaluation of exchange rate and external sector performance in Nigeria. The Nigerian Academic Forum, 13(2), 79–83.
- Inci, A. C., & Lee, B. S. (2014). Dynamic relation between stock returns and exchange rate changes. European Financial Management, 20(1), 71–106. doi:10.1111/j.1468-036X.2011.00621.x
- Johansen, J. (1990). Johansen-Juselius procedure of cointegration analysis. Oxford Bulletin of Economics and Statistics.
- Johansen, J. (1992). Johansen-Juselius procedure of cointegration analysis. Journal of Econometrics.
- Keynes, J. M. (1936). The general theory of employment, interest and money. London: Macmillan.
- Lin, C. H. (2012). The co-movement between exchange rate and stock prices in Asian emerging. doi:10.1094/PDIS-11-11-0999-PDN
- MacKinnon, J. G. (1991). Critical values for cointegration tests (Working Paper No. 1227). Queen’s Economics Department.
- Manasseh, C. O., Asogwa, F. O., Agu, D. O., & Aneke, G. C. (2014). Economic growth in Nigeria: Evidence from the appraisal of financial sector reforms and its causal effects. IOSR Journal Of Humanities And Social Science, 19(5), Ver. II, 01–10.
- Manasseh, C. O., Ogbuabor, J. E., Anumudu, C. N., Abada, F. C., Okolie, M. A., & Okoro, E. O. (2018). The causal effect of stock market development, financial sector reforms and economic growth: The application of vector autoregressive and error correction model. International Journal of Economics and Financial Issues, 8(2), 357.
- Mlambo, C., Maredza, A., & Sibanda, K. (2013). Effects of exchange rate volatility on the stock market: A case study of South Africa. Mediterranean Journal of Social Sciences, 4(4), 561–570.
- Muhammad, N., & Rasheed, A. (2011). Stock prices and exchange rates: Are they related? Evidence from South Asian countries. Retrieved from www.pide.org.pk/pdf/psde%2018AGM/
- Murinde, V. (1996). Financial markets and endogenous growth: An econometric analysis for Pacific Basin countries. In N. Hermes & R. Lensink (Eds.), Financial development and economic growth theory and experiences from developing countries (pp. 94–114). London: Routledge.
- Ngwube, A., & Ogbuagu, M. (2014). Global financial crisis and nigeria economy. Global Journal of Management and Business Research, 14(4), Version 1.0.
- Nnanna, O. J. (2001). Monetary policy framework in Africa: The Nigerian experience. A Paper Presented at the 2001 South African Reserve Bank Conference.
- Okpara, G. C., & Odionye, J. C. (2012). The direction of volatility spillover in stock prices and exchange rate: Evidence from Nigeria. Elixir Finance Management., 51A, 11055–11059.
- Olowe, R. A. (2009). Stock return, volatility and the global financial crisis in an emerging market: The Nigerian case. International Review of Business Research Papers, 5(4), 426–447.
- Paramati, S. A., & Gupta, R. (2013). An empirical relationship between exchange rates and stock returns. European Journal, Finance and Administration Science, 56, 165–179.
- Richards, N. D., Simpson, J., & Evans, J. (2009). The interaction between exchange rates and stock prices: An Australian context. International Journal of Economics and Finance, 1(1), 3–23. doi:10.5539/ijef.v1n1p3
- SEC. (2006). Annual Report and Accounts.
- SEC. (2008). Annual Report and Accounts.
- SEC. (2009). Annual Report and Accounts.
- SEC. (2013). Annual Report and Accounts.
- Seong, L. M. (2013). Reaction of exchange rates towards Malaysia stock market: Goods market approach and portfolio balanced approach. Interdisciplinary Journal of Contemporary Research, 5(8), 113–120.
- Singh, A. (1992). Corporate take-over. In International Journal Eatwell, M. Milgate & P. Newman Eds., The new palgrave dictionary of money and finance (pp. 480–486). London: Macmillan.
- Smyth, R., & Nandha, M. (2003). Bivariate causality between exchange rates and stock prices in South Asia. Retrieved from http://www.tandfonline.com/doi/abs/10.1080/1350485032000133282
- Soenan, L., & Hennigar, E. (1988). An analysis of exchange rates and stock prices: The US experience between 1980 and 1986. Akron Business and Economic Review, 19(4), 71–76. Stock%20Prices%20and%20Exchange%20Rates.pdf
- Tabak, B. M. (2006). The dynamic relationship between stock prices and exchange rates: Evidence for Brazil (Working paper No. 124). The Banco Central de Brasil.
- Tanko, M. (2004). The Nigerian capital market. A performance analysis. Retrieved from https://papers.ssrn.com/sol3/papers.cfm?abstract_id=690621
- Tsai, I. C. (2012). “The relationship between stock price index and exchange rate in Asian markets”, A quantile regression approach. Journal of International Financial Markets, Institutions & Money, 22, 609–621. under Floating Exchange Rates”, Akron Business and Economic Review, 12, 7–12. doi:10.1016/j.intfin.2012.04.005
- Yau, H. Y., & Nieh, C. C. (2009). Testing for cointegration with threshold effects between stock prices and exchange rates in Japan and Taiwan. Japan and the World Economy, 21(3), 292–300. doi:10.1016/j.japwor.2008.09.001
- Zubair, A. (2013). Causal relationship between stock market index and exchange rate: Evidence from Nigeria. CBN Journal of Applied Statistics, 4(2), 87.