
 ?Mathematical formulae have been encoded as MathML and are displayed in this HTML version using MathJax in order to improve their display. Uncheck the box to turn MathJax off. This feature requires Javascript. Click on a formula to zoom.
Abstract
In this article, we examine the dynamic currency linkages for BRIS (Brazil, Russia, India and South Africa) and 15 other emerging market economies (EMEs) using weekly data from 2001 to 2018. Using the asymmetric dynamic conditional correlation (ADCC)-EGRARCH framework, we find that the average correlation between BRIS currencies in the pre-crisis period is low and stood at 0.29, which rose to 0.39 in the post-crisis period implying contagion effects. Based on both ADCC results and Diebold-Yilmaz, Vector Autoregressive (VAR)framework enhanced by Greenwood-Nimmo block aggregation technique, we find that Brazil is a net transmitter while Russia, India and South Africa seem to be net receivers of information based on the first two moments. We further find empirical support for expanding BRIS into a larger economic block. Based on prior research findings on equity market linkages on BRICS and EMEs as well as our work on currency market linkages, we suggest Mexico, Poland and Hungary as potential candidates to be included in this economic block in the first phase. Turkey, Chile, Columbia and Romania may be included in the next phase as they dominate BRIS in either stock or currency markets of BRIS. This study is pertinent for global policymakers, international monetary agencies, currency investors and academia.
PUBLIC INTEREST STATEMENT
In this paper, we examine the dynamic currency linkages for BRIS (Brazil, Russia, India and South Africa) and 15 other emerging market economies (EMEs) using weekly data from 2001 to 2018. Using econometric techniques, we find that Brazil is a net transmitter, while Russia, India and South Africa seem to be net receivers of information based on the first two moments. We further find empirical support for expanding BRIS into a larger economic block. Based on Sehgal and Mittal (Citation2019) findings on equity market linkages on BRICS and EMEs as well as our work on currency market linkages, we suggest Mexico, Poland and Hungary as potential candidates to be included in this economic block in the first phase. Turkey, Chile, Columbia and Romania may be included in the next phase. This study is pertinent to global policymakers, international monetary agencies, currency investors and academia.
1. Introduction
Foreign exchange markets are the largest markets in the world, with over $5 trillion estimated daily turnover on an average as of 2016 (Bank for International Settlements, Citation2016). The foreign exchange market is not located at a specific location and does not have fixed trading hours, making it a 24-h worldwide trading system and making it an over-the-counter market. The foreign exchange regime has evolved over the past century from the beginning with the gold standard in the early twentieth century to the Bretton Woods system after World War II which created a pegged system. Only in the last quarter of the century, most of the currencies of the world moved to floating exchange rates that provided free market conditions. Numerous authors have explored the foreign exchange markets (Sarno & Taylor, Citation2003; Manzur & Elgar, Citation2002; Shamah, Wiley, Atrium, & Gate, Citation2003; Shachmurove, Citation2007). They have given insights into the evolution of international financial systems and also helped in understanding the links between exchange rate determination and domestic inflation, real exchange rate and interest rate and also co-variability of exchange rates and commodity prices. In the last decade of the twentieth century, a large number of emerging economies chose to liberalize their capital account, which was supported by technological innovations that made inter-country capital transactions much smoother and quicker. This, however, paved a way for speculators to trade in individual currency pairs, thus increasing the volume of transactions enormously and also the frequency of currency crisis. Almost by definition, foreign exchange markets are the centre of transmission of shocks and crises internationally. For international investors, the foreign exchange spot and derivative markets connect money, bond and stock markets in different countries. Benchmark performance of investors in their respective domestic currency can change drastically though even local performance of a foreign investment may not have an effect on it. Misalignments of exchange rates are also observed in market economies, which may add bias to investment performance from the view of a foreign investor or sudden fluctuations in exchange rates causing losses.
Currency is a medium of exchange that facilitates economic and trade transactions that are reflected through greater monetary and fiscal policy coordination, larger trade and FDI/FII flows. Hence, foreign exchange besides being an important segment of the financial market system also acts as a vital link of the real and financial economy. Foreign exchange plays a key role in economic, trade as well as market integration. Economic integration is generally based on business cooperation among neighbouring nations or nations in the same continent that are mostly referred to as natural partners. Transaction costs in all financial markets have been reduced over the past decade by technological progress that has paved the way for intercontinental integration in the current era of globalization (Sperlich, Citation2015). BRICS (Brazil Russia, India, China and South Africa) as an economic block is an outcome of such a process. Economic integration is one of the results of globalization. Economic and trade integration should generally precede financial integration. Evidence of financially integrated markets is thus important. Economic integration can be studied in terms of real GDP linkages, policy coordination, etc. However, in this article, we evaluate it using inter-country linkages in the currency market. Currency linkages also account for financial integration as they impact international portfolio flows. International capital movements/profitability of investments in the long run and export and import price competitiveness are impacted by movements in foreign exchange rates; therefore, international investors and companies pay close attention to countries’ inflation and interest rates. Businesses involved in foreign exchange transactions may benefit by tracking short-term foreign exchange movements and their linkages with other currencies. Purchasing power parity theory and International Fisher Effect suggests that a country with a relatively higher interest rate will experience depreciation of home currency as high nominal interest rates may reflect expected inflation. Currency is not only a market in itself, but also a major link between trade and economics. Currency itself is an asset and a unit of trade that acts as an interface.
Sehgal, Pandey, and Diesting (Citation2017) have suggested that trade linkages, economic risk and currency market openness are among the fundamental drivers of currency market integration of the East Asian Economic Community region (ASEAN+6) nations. Dbrowski et al. (Citation2002) have pointed out that, with an increase in integration and sophistication of economies and their financial markets, there have been new types of crisis that have enhanced over time. They have found some fundamental factors of currency crises: current account deficits, fiscal imbalances, currency overvaluation, structural weaknesses in financial architecture, specific exchange rate regimes and political instability and the like. Owing to the above-mentioned factors, the emerging markets of the world have experienced several currency crises, seeing the value of their currencies erode. To name a few, Mexican peso crisis 1994, Brazilian real crisis 2014, Russian ruble fall 2014–2015, Venezuela bolivar crisis fall 2016 and Argentina peso crisis 2018 have had long-lasting impact on the economy of the respective countries.
There have been studies to analyse linkages in currency markets among regional groups as well as geographically dispersed markets. These studies also identify the determinants of such currency market interactions. To cite a few, see Bahmani-Oskooee, Bolhassani, & Hegerty (Citation2010) for NAFTA, Pandey & Sehgal (Citation2017); Sehgal et al. (Citation2017); Shafighi & Gharleghi (Citation2016) for Asian region, Antonakakis, Floros, & Kizys (Citation2016); Baruník, Kočenda, & Vácha (Citation2017); Sehgal, Ahmad, & Deisting (Citation2014); Stoupos & Kiohos (Citation2017) for Europe, and Dbrowski et al. (Citation2002); Du, Hu, & Wu (Citation2014) for emerging markets. While there has been considerable literature to assess the closely integrated European Union having a common currency, there have been only a few studies to assess currency market linkages in BRIC and other emerging economies.
The empirical research on linkages among BRIC/S countries have mostly evolved in the past decade after BRICS countries were being initially resilient to the global financial crisis of 2008, with some contagion effect being noticed in the post-crisis period. BRICS in some manner rescued some of the advanced economies of the world in Europe, USA and Japan that were trembling due to fiscal mismanagement and overspending and were entirely dependent being a consumer-driven economy. BRICS even after suffering for a short while helped recover the advanced economies by its increased demand. The central banks of BRICS and other emerging markets cooperated on global monetary easing. Inflation in Brazil, India and China also rose to high levels causing spurts of instability in the block (Agatmel, Citation2012). During the year 2011 to 2012, BRICS currencies depreciated against the USD and lost their purchasing power considerably. As of 2012, USD accounted for over 40% of the world trade. However, in the first half of 2012 itself, Russian ruble, South African rand, Indian rupee and Brazilian real lost 4%, 8%, 10% and 16%, respectively, of their value against USD. Numerous authors have explored the foreign exchange markets (Sarno & Taylor, Citation2003; Manzur & Elgar, Citation2002; Shamah et al., Citation2003; Shachmurove, 2007). They have given insights into the evolution of international financial systems and also helped in understanding the links between exchange rate determination and domestic inflation, real exchange rate and interest rate and also co-variability of exchange rates and commodity prices.
Engle, Ito, and Lin (Citation1990) show that exchange rate uncertainties are generated not only from shocks caused locally but are transmitted across markets as well. Glick and Rose (Citation1999) conclude that currency crises remain regional which is explained by the contribution of trade linkages for the spread of such crises. Hartmann (Citation2003) discusses extreme co-movements between currencies of 14 countries including industrialized as well as emerging economies to conclude that even though crisis is more often in emerging economies, contagion is more severe for industrial economies. This study linkages in major European currencies and currency options on Euro, British Pound and Swiss franc against US dollar and conclude that the expected future volatilities are linked closely among the major European currencies. Nikkinen, Sahlström, and Vähämaa (Citation2006) after examination of expected future volatilities among some of the major European currencies conclude that EUR’s implied volatility affects those of CHF and GBP. Dimitriou and Kenourgios (Citation2013) utilize daily dollar exchange rates of EUR, JPY, GBP, CHF and AUD from 2004 to 2011 to show a decrease in correlation in exchange rates during turmoil periods, suggesting difference in vulnerability of these currencies. Qiao, Li, and Xia (Citation2015) on analysis of real effective exchange rates and monthly data for 61 major currencies from 1994 to 2014 demonstrate linkage effects among currency networks with EUR as the predominant currency with crises having effects on network topology structures causing more clustered networks. Dimitriou, Kenourgios, and Simos (Citation2017) using daily data from G7 countries from 2004 to 2015 find JPY to be safe-haven, while CAD and GBP were being affected by USD during crises due to strong economic and financial ties. Maria, Spagnolo, and Spagnolo (Citation2017) study the effect of news headlines on foreign exchange rates vis-a-vis USD and EUR for BRICS currencies from 2000 to 2013 to provide a case for significant spillovers whose strength increased during crisis though the results differed across countries. Sehgal et al. (Citation2017) on examining daily data from 2004 to 2016 conclude that South Asian nations, except India, Nepal and Bhutan, have low currency market linkages. Pandey and Sehgal (Citation2017) examine the dynamic currency market linkages by analysing return co-movement of ASEAN+6Footnote1 currency markets with the Asian benchmark currency index. Rufino (Citation2018) conclude that there exist numerous significant long-run equilibrium relationships that link the floating currency markets of the ASEAN+3Footnote2 region. Aroul and Swanson (Citation2018) utilizing data from 2000 to 2013 find out that Chinese, Indian and US currency markets are tied together, while Brazilian and Indian currency markets do not share any short-run lead–lag relationship with USA.
Following the 2008 financial crisis, the volatility of BRICS currency pairs viz-a-viz USD also increased. This rise/fall in linkages may imply contagion/decoupling, which is important to understand the true dynamics of currency market linkages in BRICS along with other EMEs. Blagrave and Vesperoni (Citation2018) point out that in the last two decades, irrespective of capital controls, BRICS members have liberalized their investment framework witnessing an extensive growth in trading of BRICS currencies. With the objective of mitigation of dollar funding risks, some BRICS members have also entered into currency swaps. The BRICS during the Brazil Summit in 2016 inaugurated two key institutions that could act as an economic challenge to the world status-quo and shall act as competitors to International Monetary Fund (IMF) and the World Bank which are US and Europe dominated. Contingency reserve arrangement (CRA) can be drawn by any of BRICS nations and has $100 billion as initial capitalization. New Development Bank (NDB), with $100 billion authorized capital, is open to all United Nations members. It is aimed at promotion of infrastructure along with sustainable development projects, to form networks of global partnership development institutions and other development banks (New Development Bank). In 2016, NDB in its annual meeting decided on adding new members for future development of the Bank and BRICS would maintain at least 51% share. Another element to enhance the financial architecture of BRICS is to create a new payment system that can act as an alternate to the Society for Worldwide Inter- bank Financial Telecommunication (SWIFT) system. There has been an increase in capital flows in between various emerging economies including BRICS and advanced economies (Val, Pereira, & Deus, Citation2011). This capital flow as a form of both FDI and FPI is affected by movement in currency values. Therefore, it is inevitable to study currency markets and integration among the currency markets which act as a key to globalization.
While there has been a flood of literature dealing with integration in a regional group of ASEAN markets and the extended group, literature on BRICS specially dealing with currency markets is limited. Further, no study till date has covered a time frame from 2001 till 2018 covering the pre and post of global financial crisis (GFC) period. Further, this study employs Asymmetric dynamic conditional correlation (ADCC)-EGARCH model along with analysis using Diebold & Yilmaz (Citation2012) later enhanced by Greenwood-Nimmo, Nguyen, & Rafferty (Citation2016) to identify the emerging economies which have bidirectional linkages with BRIS and dominate/gets dominated by BRIS countries. The primary objectives of this article were (a) to study interactions among currency markets of Brazil, Russia, India and South Africa (BRIS), which are also the constituent members of BRICS block; (b) to study linkages on currency markets of BRIS and other EME; (c) to identify new members and to expand BRIS into a larger emerging market economic block based on currency linkages.
The study concludes by suggesting that Hungary, Mexico and Poland emerge as common countries which show a higher level of equity as well as currency market integration with BRICS/BRIS. This makes them the most feasible candidates to be included in the BRIS/BRICS block and create a larger emerging market economic block for ensuring a better economic and trade balance between G7 and emerging economies. Turkey, Chile, Columbia and Romania may be kept under watch and can be included in the emerging market block in the later phase when they exhibit stronger equity/currency market integration with BRIS/BRICS members.
This rest of the article is structured as follows. Section 2 describes the data along with its properties. Section 3 discusses the methodological framework adopted in the article. Section 4 provides the empirical results. Section 5 provides conclusions and policy suggestions.
2. Data and its properties
Various sources provide a list of “emerging markets.” However, one of the most used sources by researchers is the list published by IMF which includes Argentina, Bangladesh, Brazil, Bulgaria, Chile, China, Colombia, Hungary, India, Indonesia, Malaysia, Mexico, Pakistan, Peru, Philippines, Poland, Romania, Russia, South Africa, Thailand, Turkey, Ukraine and Venezuela. (IMF, 2015).
The data comprises weekly values of closing direct currency quotes (closing rate on Wednesdays) (value of one unit of US dollar vis-à-vis the home currency) for the stated 23 emerging markets as per the IMF, 2015 list from 1 January 2001 to 30 June 2018. Weekly data are used to avoid biases with daily series (Azad, Citation2009; Darrat & Zhong, Citation2000; Rufino, Citation2018). The quotes are converted to indirect quotes (value of one unit of home currency vis-à-vis the US dollar). Since the sample countries are emerging markets, some countries may have direct quotes with each other; however, their trading frequency and volumes are limited. Therefore, the possibility of arbitrage has limited scope but may not be fully ruled out. In the case of EMEs, trading with USD is more desirable as is the case in almost all studies discussed in the previous section. The weekly returns are calculated as the first difference of log-transformed indirect weekly closing quotes on Wednesdays. The starting date has been chosen to match the date when the term “BRIC” was coined by Goldman Sachs Economic Research Group in their paper in the year 2001. Leme, Potter, Walton, and Neill (Citation2002), Das (Citation2019); Lahr (Citation2003) have pointed out that China’s exchange rate has remained fixed till 2005;, even after that, it has been carefully managed by holding the flexibility in exchange rates at the time of crisis. China’s foreign exchange market is characterized by low liquidity as compared to other countries having a flexible exchange rate regime. Effectively, for most of the period of this study, China’s exchange rate has remained fixed/pegged with the US dollar or highly managed not exhibiting properties of floating regime in real practice. Therefore, we exclude China from the analysis. Bangladesh, Venezuela and Malaysia have also been excluded from the study due to lack of availability of sufficient data. Hence, BRIS as a group and 15 other EMEs are studied. The data source is Thomson Reuters Eikon. Finally, data of 910 weekly observations for each of the 19 currencies have been utilized for this study.
3. Methodology
3.1. ADCC-EGARCH model
ADCC model proposed by Cappiello, Engle, & Sheppard (Citation2006) allows for series-specific news impact along with smoothing parameters. It also permits conditional asymmetries in the dynamics of correlation. ADCC specifications are suited to study the dynamics of correlation among varied asset classes and also investigate the presence of asymmetric response in the conditional variances as well as correlations to negative returns. We employ the ADCC model to analyse and study the behaviour of the sample EMEs including BRIS.
Integration across varied sub-periods cannot be measured by a static measure of correlation. Therefore, we use ADCC-EGARCH model given by Cappiello et al. (Citation2006) accounting for heteroscedasticity and also continuously adjusting for time-varying volatility. ADCC takes into account the asymmetry in correlations which are observed to rise more post-joint negative shock than a positive shock as pointed by Baumohl (Citation2013) and exponential GARCH (E-GARCH) model accommodates the asymmetries in conditional variances of asset returns, as the bad news has greater impact than the good news (Nelson, Citation1991)
The ADCC-EGARCH as discussed above has been estimated by modifying a program in EViews 9 econometric analysis software as per the requirements of the study to derive and analyse dynamic correlations for our sample countries. Pairwise ADCC is conducted for 19 EMEs. Hence, we obtain 171 (19C2) such pairwise correlation series over the entire sample period. Mean ADCC values for each pair are then presented in a matrix. Since this study focuses on BRIS and other EMEs related to BRIS, the average correlation of BRIS has been calculated. The average correlation of each of the EMEs with BRIS has also been calculated to see the associations and interaction of BRIS with each of the EMEs. To capture the dynamics over the pre/during/post-crisis period, the average ADCC values of each of the BRIS with other BRIS members and identified sample economies are also calculated. However, ADCC-EGARCH methodology used for this study as developed by Cappiello et al. (Citation2006) is also presented in brief as follows:
The mean equation is specified as an AR (1) process (based on SIC criteria):
where and εt = (εi,t, εEME,t), εt|Зt−1∼ N(0, Ht). Ht is the (n × n) conditional covariance matrix, decomposed as
Rt is the time-varying correlation matrix, Dt is the (n × n) that represents the diagonal matrix of the time-varying standard deviations for returns, obtained by estimating EGARCH (1,1) process which generates conditional variance of the residuals from the mean equation. EGARCH model is justified as negative and significant value of δ coefficient indicates asymmetric effect caused by news on volatility factor which increases more after a negative shock than a positive shock.
Correlation equation as evolved in ADCC model (Cappiello et al., Citation2006) is given by:
where Qt = (qij,t) is the (n × n) symmetric positive definite matrix of εt, = E(εtε’t) is the (n × n) unconditional correlation matrix of standardized residuals εt, N = E(ηtη’t) and the asymmetric term g captures the periods where both markets jointly experience negative shock. The scalar parameters θ1 and θ2 are non-negative and satisfy θ1 + θ2 < 1. Finally, the dynamic correlation matrix among the two series is represented by:
where Q∗t = [√qiit] is the diagonal matrix with entries as the square root of ith diagonal elements of Qt.
ADCC as a measure of interactions only gives correlations but not spillovers or dominance; however, to study the to and from linkages in detail, we employ block aggregation technique as given under Diebold–Yilmaz framework that was proposed by Greenwood-Nimmo et al. (Citation2016).
3.2. Diebold and Yilmaz (Citation2012) spillover index
Diebold & Yilmaz (Citation2009, Citation2012) have proposed the spillover index methodology which is based on the VAR framework that allows us to examine spillovers across variables. The contribution of shocks from and to each variable in terms of each variable’s forecast error variance (FEV) through variance decomposition analysis is quantified, thereby providing the magnitude and direction of spillovers. Diebold and Yilmaz (Citation2012) use generalized VAR framework of Pesaran and Shin (Citation1998) and Koop et al. (1996) which yields FEV decompositions that are invariant to ordering of variables.
Following the spillover index methodology by Diebold & Yilmaz (Citation2012, Citation2012), the author estimates the results using RATS-10.0 econometric analysis software. The programme of the said methodology is downloaded from their webpageFootnote3 which has been modified to analyse the spillovers among the sample markets. Sample series of returns and conditional volatilities derived from EGARCH(1,1) process along with US returns and conditional volatility are provided as input into the software. However, methodology as developed by Diebold & Yilmaz (Citation2012, Citation2012) and Greenwood-Nimmo et al. (Citation2016) used for this study is briefly discussed below.
The N variable VAR of pth order can be written as , where
is a vector with N endogenous variables,
is
parameter matrix and
is a vector of innovations. Its moving average representation is written as
, where Ai =
and j = 1, …, p.
The H-step ahead FEV decomposition of ith variable which can be attributed to shocks for jth variableis:
, for
where ∑ is the estimated variance matrix for the error term of VAR, is the standard deviation for the error term of the ith equation and
is the selection vector with one for the ith element and zero otherwise. Each FEV decomposition is normalized given by the row sum as:
connectedness matrix can thus be constructed using the FEV decompositions as follows:
where measures the pairwise spillover from variable j to variable i.
3.3. Greenwood-Nimmo (Citation2016) Block Aggregation Framework
While Diebold-Yilmaz framework provides the measure of pairwise directional spillovers among individual markets, it does not quantify the spillovers between a group of variables. Greenwood-Nimmo et al. (Citation2016) extend Diebold–Yilmaz framework by exploiting block aggregation of the connectedness matrix which applies an aggregation routine for grouping sets of individual variables.
We, therefore, adopt the same methodology to examine linkages among the EMEs including BRIS. We examine the linkages among 19 emerging markets, wherein each market encompasses two variables—return and conditional volatility in a similar manner as in Greenwood-Nimmo, Nguyen and Shin (Citation2016). The variables are arranged in the order .
A generalized VAR framework adopted in Diebold and Yilmaz (Citation2012) ensures that forecast error decomposition is not sensitive to the variable reordering and hence supports any desired block structure. Therefore, the connectedness matrix is arranged in the following form:
where , for
Total within-market FEV contribution for market i is given as:
and the total pPairwise directional spillover from market j to market i (i ≠ j) at horizon H is given as:,
where m is the number of variables that each group is composed of (in this case, m = 2) and is
vector of ones.
Hence, the aggregated connectedness matrix following Greenwood-Nimmo, Nguyen, and Shin (Citation2015) can be written as:
Now, total within-market contribution, , is decomposed into common-variable FEV contribution within-market i,
, and cross-variable effects,
, which are given as follows:
and
It should be emphasized here that is the proportion of FEV of
that is not attributable to spillovers among moments within market i nor to the spillovers from other markets to market i. On the other hand,
is the proportion of FEV of
that is ascribed to spillovers among moments within-market i.
We can also decompose total pairwise directional spillovers into common-variable, , and cross-variable effects,
, expressed as:
and
, where i ≠ j
Here, measures the proportion of common-variable FEV of
that is attributable to spillovers from other markets to the market i, while
captures the proportion of FEV of
that is ascribed to spillovers among moments from other markets to the market i.
Total directional spillover of market i to/from all other markets in the model can also be estimated from the connectedness matrix. Total directional spillovers transmitted by market i from and to all other markets, in other words, the aggregate from and to connectedness of market i, are expressed as:
and
, respectively.
Gross and net directional spillover of market ican be obtained as follows:
and
, respectively.
Similarly, the total directional spillover of market i to/from BRIS markets along with gross and net directional spillovers of market i (in terms of BRIS) in the model is also estimated from the connectedness matrix.
4. Empirical results
4.1. Descriptives
The descriptive statistics for the sample currency markets along with their SWIFT currency codes used as short in the rest of our article are shown in Table . The weekly mean return is highest for THB (Thailand baht) (0.0129%) and lowest for ARS (Argentine peso) (–) 1.58%. The weekly standard deviation as a measure of volatility is highest for UAH (1.19%) and lowest for PKR (0.261%). All the weekly return series except BGN, IDR, PKR, PEN, PHP and THB are negatively skewed and exhibit high kurtosis (leptokurtic), meaning that they are more peaked than a normal distribution with longer fatter tails. The normality assumption is violated for all sample currency markets as reflected by Jarque–Berra (JB) statistics. The result regarding autocorrelation is mixed shown by Ljund Box Q statistic. The results of ARCH LM test show the presence of conditional heteroscedasticity in most of the series, which implies volatility clustering in the sample series and hence need for analysis of the second moment. Augmented Dickey–Fuller, (Citation1979) and Phillips and Perron (Citation1998) tests have been performed to the time-series analysis, revealing that all sample weekly return series are stationary in their log return form that are presented in Table .
Table 1. Descriptive statistics for sample currency markets
Table 2. Test of stationarity of sample currency return series
4.2. ADCC model results
The dynamic conditional correlation (ADCC-EGARCH model) is estimated using weekly log returns to measure the co-movements between the currency markets. Le, Martin, Nguyen, and Martin (Citation2018) point out that consistent strong linkage has been found in currencies over the same region as well as across regions after studying 35 global currencies.
Table (Panel A) provides the average correlation coefficients for all the 19 EMEs. The average correlations have been estimated by taking the mean of time-varying ADCC values. The highest average correlation is exhibited by HUF-PLN (0.8065). Kočenda and Moravcová (Citation2019); Le et al. (Citation2018); Marcus Pramor (Citation2006) also suggest close linkages in the pair. They suggest most of the regional Eastern European currency pair to be tied to each other owing to geographical proximity, high international trade, investment and portfolio rebalancing opportunities among substitute currencies. Analysing within BRIS pairwise correlations, BRL has the highest correlation with ZAR (0.4174) and INR and RUB (0.3007) exhibits the lowest pairwise correlation.
Table 3. ADCC results for sample currency markets
Table (Panel B) shows (i) the average correlation of each of the EMEs with all other EMEs (Row 20), (ii) average correlation of each of the EMEs with BRIS (Row 21) and (iii) classification of each EMEs into high (low) if the average correlation of that EME with BRIS is greater (less) than the average correlation among BRIS (Row 22). BRIS among themselves show an average correlation of 0.349. Within BRIS, ZAR has the highest correlation with BRIS (0.376) and RUB has the lowest (0.329). Among the other EMEs, CLP (0.3662), COP (0.3411), HUF (0.4037), MXN (0.4045), PLN (0.4118), RON (0.3462) and TRY (0.3937) exhibit higher/close to BRIS average correlation. Within these EMEs, PLN has the highest association with BRIS followed by MXN and HUF. Dua & Tuteja (Citation2016) identify the global financial crisis from 2008 to 2009. Following their work, we study our sample in three periods: (a) pre-crisis period from 2001 to –2007, (b) crisis period from 2008 to 2009 and (c) post-crisis period from 2010 to 2018.
4.2.1. Time-varying ADCC results
Table (Panel C) reports the average ADCC values for all the BRIS currency markets along with BRIS average over all the three periods as mentioned above. It also reports the average ADCC values for the three periods for each EME, with BRIS reported only for those EME currencies that have average ADCC values higher than/close to BRIS average, namely, CLP, COP, HUF, MXN, PLN, RON and TRY. The average correlation for BRIS is 0.2899 during the pre-crisis period which increases to 0.3903 during the crisis period and marginally declines to 0.3868 during the post-crisis period. The correlation of Mexico with BRIS has increased sharply from 0.327 in the pre-crisis period to 0.458 in the post-crisis period while that of Turkey increased from 0.304 in the pre-crisis period to 0.439 in the post-crisis period. The overall rise in BRIS average correlations might be showing contagion effect among the group. It can further be noted that there is a 33% increase in the average ADCC values in the post-crisis period among BRIS currency markets as compared to pre-crisis values. The effect of contagion among BRIS is lowest in RUB and highest in ZAR. Among other EMEs, COP, TRY and MXN seem to be highly affected by contagion as shown by high post/pre-crisis average ADCC ratio (Row 27) in Table (Panel C).
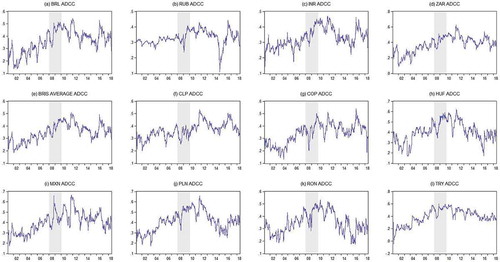
Figure shows 12 graphs. Graphs (a) to (d) show the average ADCC values of each of BRIS with other BRIS markets over the sample period. Graph (e) shows the average BRIS ADCC values. Graphs (f) to (l) show the average ADCC values over the sample period of each EME with BRIS (reported only for those EME currencies that have average ADCC values higher than/close to BRIS, namely, CLP, COP, HUF, MXN, PLN, RON and TRY). The crisis period has also been highlighted. The graphs in Figure show that the average correlations have increased in the crisis period. The general increase in ADCC values from normal to crisis period may not imply higher integration, but rather depict contagion effects in BRIS and other EME’s currency markets.
Figure 1. Time-varying ADCC graphs of select emerging economies with BRIS (currency markets).
Notes: (i) The graphs in the figure show time-varying conditional correlations of only for those EMEs that have average ADCC values higher than/close to BRICS with rest of the BRICS markets, computed from the ADCC model. (ii) Graphs (a) to (d) show average ADCC values over the sample period of each EME with BRIS (reported only for those EME currencies that have average ADCC values higher than/close to BRIS, namely, CLP, COP, HUF, MXN, PLN, RON and TRY). Graphs (f) to (l) show average ADCC values of each of BRIS with other BRIS markets over the sample period. Graph (e) shows the average BRIS ADCC values. (iii) The crisis period has also been highlighted, reflected by the shaded region in each graph.(iv): x-axis represents year, y-axis represents average ADCC values.
ADCC is a measure of association only; it does not show interactions; hence, analysis cannot be made on information spillovers or dominance. The results from the study of “to and from” linkages in detail using the block aggregation technique under Diebold–Yilmaz framework as proposed by Greenwood-Nimmo et al. (Citation2016) are presented in the next sub-section.
4.3. Diebold and Yilmaz (Citation2012) spillover index results
We employ full-sample Diebold and Yilmaz (Citation2012) spillover index methodology. The analysis is done by estimating the connectedness matrix under Diebold-Yilmaz framework, wherein the optimal lag length is determined by minimizing Schwarz information criterion (SIC) and the forecast horizon is set to H = 10 weeks.
4.3.1. Return and volatility spillovers
Diebold and Yilmaz (Citation2012) spillover index methodology is employed to return and conditional volatility of 19 sample markets that give a 38 × 38 connectedness matrix. The matrix quantifies the magnitude of pairwise linkages between the first two moments of each market in the sample. The connectedness matrix depicting pairwise spillovers across return and volatility for all 19 markets is presented in Table displaying the magnitude of pairwise linkages between individual variables for the full sample period. The diagonal elements in the matrix represent within-moment spillovers and off-diagonal elements represent cross-moment/directional spillovers.
Table 4. Return and volatility spillovers for all sample currency markets
Considering the return spillovers across the BRIS markets, within own-market spillover ranges around 30%. The cross-return spillovers among BRIS are low. With respect to volatility spillovers across BRIS, within own-market spillover varies from 14.89% for ZARV to 61.91% for RUBV. Analysing the spillovers across return and volatility among BRIS, the cross-interaction between risk and volatility varies in magnitude. The spillovers from the same currency return to its volatility are around 15%. However, spillovers from volatility to return and cross-currency spillovers are low, as much of the interactions are within its own moment.
The sum of off-diagonal column elements in the matrix (contributions to others) or the sum of row (contributions from others) gives the numerator of total spillover index when summed across countries. Similarly, the sum of column or sum of row including the diagonals, when aggregated across all countries, gives the denominator of total spillover index. Total volatility spillover index is reflected in the lower right corner of Table . It is expressed in percentage terms. Total spillover index is at 62.00%, which indicates that the interdependencies among the financial markets are high, as around 62% of the FEV comes from spillovers. The spillover table exhibits an approximate “‘input–output’” decomposition of total volatility spillover index.
Table also displays net and gross spillovers for all markets as well as for BRIS. Column 39 of Table labelled “Contribution from Others” sums the directional spillovers to market “i” from the rest of the sample markets. Row 39 labelled “Contribution to Others” represents the directional spillover from market “i” to other markets in the model. Similarly, Column 40 labelled “Contribution from BRIS” sums the directional spillovers to market “i” from BRIS markets and Row 41 labelled “Contribution to BRIS” represents the directional spillover from market “i” to BRIS markets in the model. Dominance of financial markets can be inferred by directional spillovers “to” and “from” other markets that are the two key aspects based on the combined effect. Dominance of a country’s market can be established if it influences in transmitting information to other markets but is relatively less influenced from them. Therefore, calculating and analysing differences between “contribution to others” and “contribution from others” also known as net spillovers of the financial markets is an important tool to evaluate dominance/subordination of a given market. In addition, we estimate the gross spillover which is the sum of “contribution to others” and “contribution from others”. Both net and gross spillovers have their own relevance in cross-country interactions. Gross spillover can be a measure of enhanced linkages, thereby showing a level of openness of a given financial market. Since the study focuses on interactions between the BRIS economies, we wish to identify other EMEs which have strong interactions with BRIS based on currency market analysis and hence can be potential candidates that could be considered for expanding BRIS into a more comprehensive EME block. A similar analysis for BRIS has been repeated. To find the markets having dominance over BRIS, we calculate the net spillover (BRIS) as the difference of contribution of the market to BRIS and contribution to the market from BRIS. A positive value of net contribution establishes the dominance of market in transmitting information to BRIS. Gross spillover (BRIS) refers to the sum of the contribution of the market to BRIS and from BRIS. Rows 42 and 43 show these figures, respectively. Analysing the net spillover results, it is found that within BRIS, return spillovers of Brazil, Russia, India and South Africa seem to dominate volatility (shown by positive net spillover values for these markets), implying there is flow of information from returns to volatility within the BRIS markets. Among other EMEs, BGN, CLP, COP, HUF, MXN, PLN, RON and TRY returns dominate BRIS return and volatility markets combined. All these markets also exhibit a higher level of openness as shown by large gross spillover values for them.
4.3.2. Block aggregation approach under Diebold–Yilmaz results
Greenwood-Nimmo et al. (Citation2015) have given a novel method in which block aggregation approach is used under Diebold–Yilmaz framework to integrate sets of individual variables for examining linkages among the group of variables. The block aggregation technique is utilized to capture the spillover effects that flow through return and volatility across the EMEs. Therefore, we aggregate the first two moments by applying block aggregation method to the 38 × 38 matrix presented earlier in Table . This helps us to examine linkages among the emerging markets flowing through risk and return in a common framework providing a comprehensive picture to elucidate their interactions. Table (Panel A) presents 19 × 19 market connectedness matrix depicting the combined spillovers among the sample markets aggregated over the two moments (return and conditional volatility).
Table 5. Block aggregation approach under Diebold–Yilmaz results of currency markets
Greenwood-Nimmo et al. (Citation2015) find that cross-market spillovers between returns of different currencies accounted for over 50% of the return FEV in most cases. However, own-variable effects accounted only for 20–30% of the return FEV and an average of 20% for volatility spillovers. Among return, spillovers were found strong where the currencies shared an underlying linkage especially in the case of European and currencies of commodity-driven economies (AUD, CAD and NZD). In these groups, most bilateral return spillovers were in between 10% and 15%. Unlike the evidence for developed markets in Greenwood-Nimmo, we find that among emerging economies the own-variable effect varies from 20% to 80% of the return FEVs.
As in the case of Table , the diagonal elements of the matrix represent combined within-market spillovers and off-diagonal elements represent cross-market spillovers. The within-market spillovers among BRIS range from 28.96% for South Africa to 56.78% for Russia. Similar to Table , the sum of off-diagonal column elements in the matrix (contributions to others) or the sum of row (contributions from others) gives the numerator of total spillover index when summed across countries. Similarly, the sum of column or sum of row including the diagonals, when aggregated across all countries, gives the denominator of total spillover index. The total volatility spillover index appears in the lower right corner of Table . It is expressed in percentage terms. Total spillover index is 56.69%, which indicates that the interdependencies among the markets are high as over 56% of the forecast errors come from spillovers.
Table (Panel B) also displays net and gross spillovers for all markets as well as for BRIS computed separately as done in Table . Analysing the net spillovers results, we find that among BRIS, Russia, India and South Africa are the net receivers of total spillovers, meaning that the information arising from Brazil has spillover implications for Russia, India and South Africa. Brazil is a net transmitter of information to the other members of BRIS which is shown by positive net (BRIS) contribution (Row 25). Currencies, namely, COP, HUF, MXN, PLN and RON, have a positive net contribution and also exhibit a high value of gross contribution. A high value of gross contribution of these markets also reflects a higher level of globalization/openness (Row 26).
4.3.3. Rolling-sample analysis: time-varying spillover results
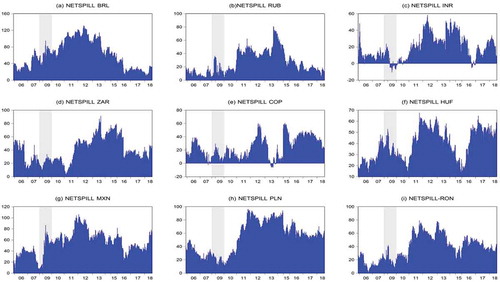
The static spillover results are supplemented with rolling window analysis to capture the time-varying characteristics of the spillover indices. We present results with h = 10 weeks and a rolling window of 250 weeks. Figure depicts the dynamic total spillover index for all sample emerging markets. The shaded area presents the crisis period. We notice a sharp increase in the spillover effect post the crisis period. This indicates an increase in contagion showing the presence of connected economies in the sample. The time-varying evolution of net spillovers of BRIS along with COP, HUF, MXN, PLN and RON with the entire sample EMEs is presented in Figure . Graphs (a) to (d) represent BRIS and graphs (e) to (i) represent EMEs (reported only for those EMEs that have high gross spillover (BRIS) values and a positive net spillover (BRIS)). Highlighted portion marks the crisis period. As stated earlier, a positive net contribution means that the market is able to have an influence in transmitting information to EMEs including BRIS, but is relatively less influenced by EMEs including BRIS. All the countries in the figure have high positive net contributions throughout the sample period. As mentioned earlier, the net spillovers show dominance, indicating that the given currency market effect has net information flow to others in the sample.
Figure 2. Dynamic total spillovers for the entire sample EMEs (currency markets).
Notes: (i) The graph in the figure shows dynamic total spillovers for all the sample EMEs including BRIS for the entire period of study.(ii) Dynamic spillover index is obtained using 250-week rolling window for estimation and 10-week forecast period.(iii) Crisis period is highlighted, reflected by the shaded region.(iv): x-axis represents year, y-axis represents total spillover (%).
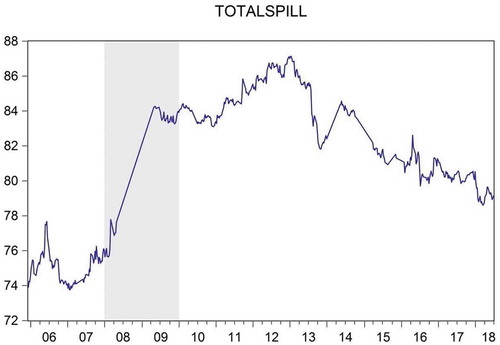
Figure 3. Dynamic net spillovers for select emes including BRIS (currency markets).
Notes: (i) The graphs in the figure show dynamic net spillovers for only those EMEs that have high gross spillover (BRIS) values and a positive net spillover (BRIS) with all the sample EMEs including BRICS for the entire period of study. (ii) Figures (a) to (d) represent BRIS, (e) to (i) represent COP, HUF, MXN, PLN and RON, respectively.(iii) Dynamic spillover index is obtained using 250-week rolling window for estimation and 10-week forecast period.(iv) Crisis period has also been highlighted reflected by the shaded region in each graph.(v): x-axis represents year, y-axis represents net spillover (%).
5. Conclusions and policy suggestions
In this article, dynamic interactions between BRIS and other select EMEs from January 2001 to September 2018 are analysed. Weekly returns as the first difference of log-transformed indirect weekly closing quotes on Wednesdays for each county’s currency viz-a-viz USD are analysed for the stated 23 EMEs as provided by IMF, 2015 list. However, we exclude China as for most of the period of our analysis, its exchange rate has remained fixed/pegged. We also exclude Bangladesh, Venezuela and Malaysia from the study due to lack of availability of sufficient data, finally covering 19 emerging markets including BRIS.
Using appropriate econometric techniques, it is found that within BRIS, South Africa has the highest association with other members of the block and Russia has the lowest. With respect to other emerging economies, Columbia, Hungary, Mexico, Poland and Romania are identified as common counties that show higher association with BRIS as compared to their average as well as dominate BRIS. Further, it was found that within BRIS, Brazil dominates other BRIS members. Associations in the group and other select EMEs seem to have increased during the crisis and post-crisis period, but this may reflect contagion. Prior research has suggested that trade linkages, economic risk and currency market openness are among the fundamental drivers of currency market integration of the East Asian Economic Community region (ASEAN+6) nations. It is noted that the cohesiveness among this emerging block of BRIS/BRICS is low. It will further be important for this emerging block to focus on the above-mentioned factors, as the study suggests improving the integration among the block.
On the basis of Sehgal and Mittal (Citation2019) studying dynamic interactions in BRICS and other emerging equity markets, it is found that Mexico, Chile, Hungary, Turkey and Poland are good candidates to be included in an extended block as inclusion of these members will help strengthen trade and financial ties among the emerging markets of the world. Results from our study on currency market linkages show that Colombian peso, Hungarian forint, Mexico peso, Polish zloty and Romanian leu have a high impact on BRIS and will strengthen the BRIS block when included. Thus, based on results of the previous study dealing with equity market integration and the findings of this study, Hungary, Mexico and Poland emerge as common countries which show a higher level of equity as well as currency market integration with BRICS/BRIS. This makes them the most feasible candidates to be included in the BRIS/BRICS block to form a larger emerging market economic block for ensuring a better economic and trade balance between G7 and emerging economies. Turkey, Chile and Columbia may be kept under watch and can be included in the emerging market block in the later phase when they exhibit stronger equity/currency market integration with BRIS/BRICS members. For the countries lying in the European Union, improving trade and ensuring efforts to integrate with the BRICS economies will have positive spillover effects. However, emerging EU economies have a limitation that they are not free to pursue independent trade policy with non-EU members. China is an integral part of BRICS and continues to be an important member of the proposed emerging market block; however, it needs to work on its currency market policy to make RMB a fully floating currency with greater liquidity. Internationalization of currencies of all BRICS member countries should also be enhanced by deepening exchange traded currency contracts, developing currency swap market and through trade in national currency-denominated bonds in various offshore BRICS centres. In general, EMEs need to work on their economic and trade integration. BRICS as well as other EMEs, besides strengthening the currency linkages and interactions, need to work on greater economic integration and policy coordination as well as strengthening trade through bilateral agreements and forming trade routes. They also need to focus on improving the interaction between other elements of the financial system such as banking/equity/bond and commodity markets.
This article is of importance to global policymakers, central banks, international monetary agencies, currency investors and academia. For policymakers around the globe, the study is of particular relevance as it suggests expanding the existing economic block, and the expanded block will be more capable in achieving enhanced economic and trade linkages along with increasing the political influence among economies as well as developing a coordinated response to global risks including financial contagion. Policymakers and governments of BRICS member countries should check the feasibility of developing currency and trade arrangements in local currencies and encourage swap deals among members, thereby reducing the foreign exchange risk and ensuring better stability of trade. By enhancing CRA established in 2016 by BRICS, it is possible to check over-reliance on USD and thereby mitigating global financial risk and neutralize effects of systemic risks and external shocks. For international monetary agencies like the World Bank and IMF, setting up of New Development Bank by BRICS can provide a viable alternative for emerging markets with regard to development credit. Inclusion of new members will increase the bank capital base and ease the problems faced by emerging economies in procuring finance. Moderate stock and currency market correlations suggest that the EMEs (including BRIS) are a heterogeneous group and hence provide global investors and portfolio managers good opportunities for risk diversification. The expanded block in the near future will be able to compete with the advanced economies of the world by checking their influence on the world economic order and other international institutions. Deeper spot and derivative currency markets and stronger cross-country linkages shall lead to better exchange rate determination, making currency markets more efficient. For the academic community, it will be interesting to analyse the role of the proposed economic block in future world economic order, global level policy and strategy formulation. The article contributes to fill the gaps in currency market integration literature for emerging markets.
Additional information
Funding
Notes on contributors
Arjun Mittal
Arjun Mittal is an Assistant Professor, at ShriRam College of Commerce, University of Delhi and Ph.D. in finance from University of Delhi. He has over 45 books and research papers published in journals of repute.
Sanjay Sehgal
Prof. Sanjay Sehgal is Head, Department of Financial Studies, University of Delhi. He is Ph.D. from Delhi School of Economics and has done his post doctorate from Department of Finance, London School of Economics. He has 30 years of teaching experience, completed 8 major research projects and published 154 research papers. He was conferred with Commonwealth Fellowship award and Indo French Social Sciences award.
Anand Mittal
Dr. Anand Mittal is Professor at Hansraj College, University of Delhi. He is Ph.D. in Economics and postgraduate from Delhi School of Economics. With teaching experience of 35 years, he has 70 books and research papers published and recipient of Radha Krishnan Memorial National Teacher Award.
Notes
1. ASEAN+6 countries include the 10 members of the Association of Southeast Asian Nations (Brunei Darussalam, Cambodia, Indonesia, Lao People’s Democratic Republic, Malaysia, Myanmar, the Philippines, Singapore, Thailand, and Viet Nam) plus China, Japan, South Korea, India, Australia, and New Zealand.
2. ASEAN+3 countries include the 10 members of the Association of Southeast Asian Nations plus Japan, China and South Korea.
3. https://estima.com/ratshelp/index.html?dieboldyilmazspilloverpapers.html.
Related Research Data
References
- Agatmel, A. (2012). Think again: The BRICS. Foreign Policy, 1–35, 8 October. 1037//0033-2909.I26.1.78.
- Antonakakis, N., Floros, C., & Kizys, R. (2016). Dynamic spillover effects in futures markets: UK and US evidence. International Review of Financial Analysis, 48, 406–31. doi:10.1016/j.irfa.2015.03.008
- Aroul, R. R., & Swanson, P. E. (2018). Linkages between the foreign exchange markets of BRIC Countries — Brazil, Russia, India and China — USA. Journal of Emerging Market Finance, 1–21. doi:10.1177/0972652718800081
- Azad, A. S. M. S. (2009). Random walk and efficiency tests in the Asia-Pacific foreign exchange markets: Evidence from the post-Asian currency crisis data. Research in International Business and Finance, 23(3), 322–338. doi:10.1016/j.ribaf.2008.11.001
- Bahmani-Oskooee, M., Bolhassani, M., & Hegerty, S. W. (2010). The effects of currency fluctuations and trade integration on industry trade between Canada and Mexico. Research in Economics, 64(4), 212–223. doi:10.1016/J.RIE.2010.05.001
- Bank for International Settlements. (2016). Triennial central bank survey : Foreign exchange turnover in April 2016. Triennial Central Bank Survey, (September), 1–21. Retrieved from www.bis.org
- Baruník, J., Kočenda, E., & Vácha, L. (2017). Asymmetric volatility connectedness on the forex market. Journal of International Money and Finance, 77, 39–56. doi:10.1016/j.jimonfin.2017.06.003
- Baumohl, E. (2013). Stock market integration between the CEE-4 and the G7 markets: Asymmetric DCC and smooth transition approach. Eduard. Munich Personal RePEc Archive, (15211).
- Blagrave, P., & Vesperoni, E. (2018). The implications of China’s slowdown for international trade. Journal of Asian Economics, 56, 36–47. doi:10.1016/j.asieco.2018.01.001
- Cappiello, L., Engle, R. F., & Sheppard, K. (2006). Asymmetric dynamics in the correlations of global equity and bond returns. Journal of Financial Econometrics, 4(4), 537–572. doi:10.1093/jjfinec/nbl005
- Darrat, A. F., & Zhong, M. (2000). On testing the random-walk hypothesis : A model-comparison approach. The Financial Review, 35, 105–124. doi:10.1111/fire.2000.35.issue-3
- Das, S. (2019). China ’ s evolving exchange rate regime. IMF Working Paper, WP/19/50. doi:10.5089/9781498302029.001
- Dbrowski, M., Antczak, M., Antczak, R., Baszkiewicz, M., Ganev, G., Jakubiak, M., … Tomczyñska, M. (2002). The global financial crisis and its impact on emerging-market economies : Causes, consequences. Rapporty Case Report, 51.
- Dickey, D, & Fuller, W. (1979). Distribution of the estimators for autoregressive time series with a unit root. Journal Of The American Statistical Association,74(366), 427–431. doi: 10.2307/2286348
- Diebold, F. X., & Yilmaz, K. (2012). Better to give than to receive : Predictive directional measurement of volatility spillovers. International Journal of Forecasting, 28(1), 57–66. doi:10.1016/j.ijforecast.2011.02.006
- Diebold, F.X, & Yilmaz, K. (2009). Measuring financial asset return and volatility spillover with application to global equity markets. The Economic Journal, 119, 158–171.
- Dimitriou, D., & Kenourgios, D. (2013). Financial crises and dynamic linkages among international currencies. Journal of International Financial Markets, Institutions and Money, 26(1), 319–332. doi:10.1016/j.intfin.2013.07.008
- Dimitriou, D., Kenourgios, D., & Simos, T. (2017). Financial crises, exchange rate linkages and uncovered interest parity : Evidence from G7 markets. Economic Modelling, (June), 1–9. doi:10.1016/j.econmod.2017.06.003
- Du, D., Hu, O., & Wu, H. (2014). Emerging market currency exposure: Taiwan. Journal of Multinational Financial Management, 28, 47–61. doi:10.1016/j.mulfin.2014.10.001
- Dua, P., & Tuteja, D. (2016). Financial crises and dynamic linkages across international stock and currency markets. Economic Modelling, 59, 249–261. doi:10.1016/j.econmod.2016.07.013
- Engle, R. F., Ito, T., & Lin, W. (1990). Meteor showers or heat waves? Heteroskedastic intra-daily volatility in the foreign exchange market. Econometrica, 58(3), 525–542. doi:10.2307/2938189
- Glick, R., & Rose, A. K. (1999). Contagion and Trade: Why are currency crises regional. Journal of International Money and Finance, 18, 603–618. doi:10.1016/S0261-5606(99)00023-6
- Greenwood-Nimmo, M., Nguyen, V. H., & Rafferty, B. (2016). Risk and return spillovers among the G10 currencies. Journal of Financial Markets, 31, 43–62. doi:10.1016/j.finmar.2016.05.001
- Greenwood-Nimmo, M., Nguyen, V. H., & Shin, Y. (2015). Measuring the connectedness of the global economy measuring the connectedness of the global Economy *. Melbourne Institute Working Paper Series Working Paper No. 7/15, 7.
- Hartmann, P. (2003). A Global Perspective on Extreme Currency Linkages, Asset Price Bubbles: The Implications for Monetary, Regulatory, and International Policies, Chapter 25..
- Kočenda, E., & Moravcová, M. (2019). Exchange rate comovements, hedging and volatility spillovers on new EU forex markets. Journal of International Financial Markets, Institutions and Money, 58, 42–64. doi:10.1016/j.intfin.2018.09.009
- Lahr, A. (2003). Trade Linkages and exchange rates in Asia : The role of China. Centre d’Etudes Prospectives et d’Informations Internationales Working Paper, 21.
- Le, T., Martin, F., Nguyen, D., & Martin, F. (2018). Dynamic connectedness of global currencies: A conditional Granger-causality approach. HAL Id.
- Leme, P., Potter, S., Walton, D., & Neill, J. O. (2002). Building better global economic BRICs. Goldman Sachs Economic Research Group Jim, Global Economics, 66, 1–16.
- Manzur, M., & Elgar, E. (2002). Exchange rates, interest rates and commodity prices., Edward Elgar, Cheltenham, U.K: Northhampton, Mass.
- Marcus Pramor, M. N. T. T. (2006). Common volatility trends in the central and Eastern European Currencies and the Euro (EPub). E Publication, IMF. 06/206
- Maria, G., Spagnolo, F., & Spagnolo, N. (2017). Macro news and exchange rates in the BRICS. Finance Research Letters Journal, 21, 140–143. doi:10.1016/j.frl.2016.12.002
- Nelson, D. B. (1991). Conditional heteroskedasticity in asset returns: A new approach. Econometrica, 59(2), 347–370. Retrieved from https://www.jstor.org/stable/2938260?seq=1#page_scan_tab_contents
- Nikkinen, J., Sahlström, P., & Vähämaa, S. (2006). Implied volatility linkages among major European currencies. Journal of International Financial Markets, Institutions and Money, 16(2), 87–103. doi:10.1016/j.intfin.2004.12.007
- Pandey, P., & Sehgal, S. (2017). Dynamic currency linkages and its determinants: An empirical study for East Asian economic community region. Emerging Markets Finance and Trade. doi:10.1080/1540496X.2017.1380621
- Pesaran, H., & Shin, Y. (1998). Generalized impulse response analysis in linear multivariate models. Economics Letters, 58(1), 17–29,ISSN 0165–1765, https://doi.org/10.1016/S0165–1765(97)00214–0
- Phillips, P. C. B., & Perron, P. (1998). Testing for a unit root in time series regression. Biometrika, 75(2), 335–346. doi:10.1093/biomet/75.2.335
- Qiao, H., Li, Y., & Xia, Y. (2015). Analysis of linkage effects among currency networks using REER Data. Hindawi Publishing Corporation Discrete Dynamics in Nature and Society, 2015, 9.
- Rufino, C. C. (2018). Long-Run Linkages of ASEAN + 3 Floating Currencies. Business & Economics Review, 27, 1–14.
- Sarno, L., & Taylor, P. M. (2003). The economics of exchange rates, Cambridge University Press (pp. 318)
- Sehgal, S., Ahmad, W., & Deisting, F. (2014). an Empirical examination of the process of information transmission in India ’ S Agriculture Futures Markets. Journal of Quantitative Economics, 12, 1.
- Sehgal, S., & Mittal, A. (2019). Dynamic linkages between BRICS and other emerging equity markets. Theoretical Economics Letters (August 2019), 9, 2636–2666.
- Sehgal, S., Pandey, P., & Diesting, F. (2017). Examining dynamic currency linkages amongst South Asian economies: An empirical study. Research in International Business and Finance, 42, 173–190. doi:10.1016/j.ribaf.2017.05.008
- Shachmurove, Yochanan, & Shachmurove, Tomer. 2007. In the Same Boat: Exchange Rate Interdependence in the Asia-Pacific Region. PIER Working Paper No. 07-019. Available at SSRN: https://ssrn.com/abstract=999387 or doi:http://dx.doi.org/10.2139/ssrn.999387
- Shafighi, N., & Gharleghi, B. (2016). Feasibility of a currency union in East Asia using the five-variable structural vector autoregressive model. Economic Analysis and Policy, 52, 45–54. doi:10.1016/J.EAP.2016.07.002
- Shamah, S. (2003). A Foreign Exchange Primer. In A Foreign Exchange Primer. John Wiley & Sons. doi:10.1002/9781119207092
- Sperlich, Yvonne. 2015. From Power Transition to Economic Integration Theory: A Review of the BRICS Literature. Available at SSRN: https://ssrn.com/abstract=2671421.doi:http://dx.doi.org/10.2139/ssrn.2671421
- Stoupos, N., & Kiohos, A. (2017). EU unification and linkages among the European currencies: New evidence from the EU and the EEA. Research in International Business and Finance, 41, 28–36. doi:10.1016/J.RIBAF.2017.04.015
- Val, C., Pereira, V. D. P., & Deus, L. N. (2011). Dynamics of Financial flows in BRICS Countries : An analysis of the period 2000-2010, Brazilian Keynesian Review, 2(2) (pp. 462–476).