
 ?Mathematical formulae have been encoded as MathML and are displayed in this HTML version using MathJax in order to improve their display. Uncheck the box to turn MathJax off. This feature requires Javascript. Click on a formula to zoom.
Abstract
This research examined the effect of the Government of Ghana’s agricultural policy of Planting for Food and Jobs (PFJ) on rice farmers` productivity and welfare in Northern Ghana. The study used survey data collected from beneficiaries and non-beneficiaries of the programme who cultivated rice in 2018 production season. Respondents were randomly selected, and data analysed using empirical methods of Inverse Propensity Weighting Estimation and the Local Average Treatment Effect. The results indicate an insignificant increase in income levels from rice production, but a significant reduction in farm expenditure, an increase in per capita monthly spending and a decrease in income poverty of households. The findings reveal a positive impact of the agricultural technologies implemented under Planting for Food and Jobs programme on rice productivity and welfare of rice farmers in Northern Ghana. The research recommends the need for government to expand the beneficiaries using local media and the policy instrument of input subsidies to promote the use of fertiliser and improved rice varieties.
PUBLIC INTEREST STATEMENT
The Government of Ghana has implemented an agricultural policy of Planting for Food and Jobs (PFJ) in 2017. The policy aims at reducing rice importation which is about 70% and to improve farmers’ welfare in the country. Northern Ghana is characterised by low adoption of agricultural technologies (improved seed, used of fertiliser, agricultural mechanisation and acceptable planting method) and high poverty but has the highest potential to produce rice. This research assessed the impact of adopting agricultural technologies under Planting for Food and Jobs programme on 144 beneficiaries and 144 non-beneficiaries. Beneficiaries of PFJ are farmers who obtained improved seed, fertiliser, and extension services. The research findings indicate an insignificant increase in the income from rice production, but significantly reduce farm expenditure, increases per capita monthly spending and decreases income poverty.
Competing Interest
The authors do not have a competing interest.
1. Introduction
In Africa, agriculture is recognised as the sector for the reduction of poverty (SRID, Citation2016). The development of the agriculture sector is a priority for the government of Ghana (FAO, Citation2015). The agricultural sector is the backbone of the Ghanaian economy. Though the contribution of agriculture to national Gross Domestic Product (GDP) has dwindled in recent times, the sector’s contribution to the economy is still enormous as it contributed about 18.9% to GDP in 2016 (MOFA, Citation2017) and has regained its position as the largest employer (after dropping second to the Service’s Sector in 2010), employing 44.7% of the labour force in 2013 (GLSS6, Citation2014).
To revamp the agricultural sector, the government of Ghana introduced a flagship policy called Planting for Food and Jobs (PFJ) in 2017. The main aim of the programme is to address the declining growth of agriculture in Ghana. The policy focused on increasing food production and ensuring food security in the country as well as reducing the food import bills to the barest minimum, especially rice. The project consists of five significant pillars; supply of improved seeds to farmers at subsidised prices (50% subsidy), supply of fertiliser at subsidised prices (50% price cut out), free extension services to farmers, marketing opportunities for produce after harvest, and E-Agriculture (a technological platform to monitor and track activities and progress of farmers through a database system) (PFJ, Citation2017). The five main crops selected are Maize, Rice, Soybeans, Sorghum and Vegetables (tomato, onion, Chili pepper) in line with priority crops as proposed in Food and Agriculture Sector Development Policy II (FASDEP II) and its investment programme, the Medium-Term Agricultural Sector Investment Plan (METASIP) (PFJ, Citation2017).
To ensure self-sufficiency and surplus for export, the Planting for Food and Jobs (PFJ supported the Youth in Agriculture Programme (YIAP). The PFJ seeks to motivate and encourage farmers to adopt certified seeds and fertilisers through a private sector-led marketing framework, by raising the incentives and complimentary service provisions on the usage of inputs, good agronomic practices, and marketing of outputs over an E-Agriculture platform (PFJ, Citation2017). The PFJ programme empowered the beneficiaries with knowledge and skills on maximising the benefits of the usage of subsidised inputs like fertiliser through proximity extension services (MOFA, Citation2017). The outcome of the PFJ programme is measurable in terms of rice productivity, income from rice production, and the trickle-down effect on consumption expenditure, among other variables.
Under the PFJ policy, rice production increased in the country, especially in the Northern part of Ghana. The increased access to adequate fertilisers and certified seeds in 2017, brought about an increase in yields of rice. Average yields of rice increased from 2.7 MT to 4 MT per hectare, and more than 100% increase in yields for rice (from 2.7MT to 5.5 MT per hectare) under the Youth in Agriculture Programme of PFJ, in Northern Ghana (Alidu, Tanko, & Iddrisu, Citation2016; MOFA, Citation2017; Tanko & Alidu, Citation2016). The five Northern regions (Northern, Upper East, Upper West, Savannah and North-East regions) have about 78% of its economically active population in agriculture (SRID, Citation2016), ranked the poorest regions in Ghana, and accounts for more than half of the total domestic rice production in Ghana. Given this, it is therefore imperative to assess the benefits of this policy on the lives of farmers in these regions. In this regard, the researchers intended to evaluate the impact of the government flagship policy (Planting for Food and Jobs policy) on the welfare of rice farmers in Northern Ghana.
2. Literature review
Rice is a major staple food and ranked the second-largest caloric food consumed after maize (SRID, Citation2016). From 2007 onwards, rice production in Ghana is increasing, having more than double its levels from 185,300 tonnes in 2007 to 491,600 tonnes in 2010 (Abdulai, Zakariah, & Arkoh Donkoh, Citation2018; Angelucci, Asante-Poku, & Anaadumba, Citation2013). However, Ghana is not food self-sufficient in rice. This deficit is due to high national demand compared to quantity produced; the domestic rice production compared to consumption keep on decreasing from 55% in 2014 to 44% in 2016, after which it increased marginally to 47% in 2017. The rise in the quantity of milled rice produced during the period is attributed to the use of improved seed, fertiliser application and increased area under cultivation coupled with favourable rainfall and enhanced extension service delivery during the period (MOFA, Citation2017).
According to Tanko and Amikuzuno (Citation2015), there is an increase in the import share of rice which is attributed to high consumption due to better taste and preference for foreign rice by Ghanaians over the years. The high importation of rice attracts high import bills (averaging US$376million annually) on the economy; hence, extra effort is needed to reduce the increasing volumes of imported rice. Rice is one of the commodities purchased by the National Food Buffer Stock Company (NAFCO) to build its operational and emergency stocks (Angelucci et al., Citation2013).
The role of the rice crop is inevitable in current and future global food security (Chauhan, Jabran, & Mahajan, Citation2017). Rice is arguably the most important cash crop in the communities which cultivates it, besides being an important staple food for both rural and urban communities across Ghana (Asuming-Brempong & Osei-Asare, Citation2008). Rice is the only staple food that piles up Ghana import bills annually, and yet the country has the potential to produce enough to feed herself (See Figure below).
Figure 1. Rice Imports, Domestic Production and Import Penetration.
Source: MoFA. (Citation2014)
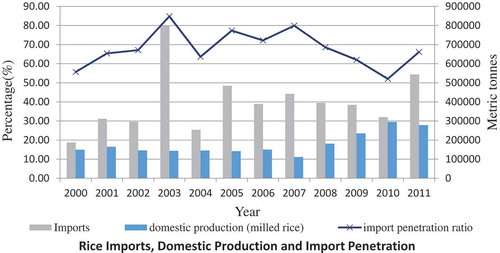
Because of these, successive governments and donor partners have made interventions to develop the local rice industry for over a decade (MOFA, Citation2017). However, the establishment of rice industries without improvement in rice production or yield will not save Ghana from being a net importer of rice (Tanko, Iddrisu, & Alidu, Citation2016). From Figure above, Ghana importation of rice from the year 2000 to 2014 is unprecedentedly higher than the domestic production leading to a high import penetration ratio (FAO, Citation2018; Ministry of Food and Agriculture, Citation2017; MoFA., Citation2014). Though, Ayeduvor (Citation2018) and Donkor, Matthews, and Ogundeji (Citation2018) observed that as a target to reduce rice importation, farmers efficiency and access to the market considered as an increase in productivity complemented with the right consumer taste and preferences.
Rice cultivation is believed to have great potential in reducing poverty levels in Northern Ghana. Among the five ecological zones in Ghana, the Northern zone has the greatest potential in rice production. The zone’s lowlands represent the largest area but are mostly unused (Donkoh, Awuni, & Namara, Citation2010). Rice is a water gulping crop and on an average of about 2,500 litres of water need to be supplied (by rainfall or irrigation) to the rice field to produce 1 kg of rough rice (Bouman, Citation2009). The area of lowlands liable for flooding in the region is at about 400,000 hectares. The swamps and Midlands (Inland valley production systems) account for 75% of domestic rice production. Hydrological characteristics of the soil, such as high-water retention capacity in the region, makes it the highest potential for rice production in Ghana (Donkoh et al., Citation2010). However, based on a three-year (2014–2016) average weight (volume), the Volta region has overtaken the Northern region and Upper East region to become the leading rice (paddy) producer in Ghana (SRID, Citation2016). The programme, Planting for Food and Jobs targeted Northern Ghana with rice production and aimed at using that to reduce unemployment in the zone and improve rice farmers’ welfare (PFJ, Citation2017). The question imposed is: Does the programme achieved its target of improving rice farmers’ welfare in Northern Ghana?
Several significant constraints beset the rice production in the North, and for Ghana to achieve self-sufficiency in rice production, these major constraints will have to be overcome to enhance output (Oteng, Citation1997). These challenges are natural and artificial. The natural challenges are the extensive occurrence of groundwater laterites (shallow and poorly drained, light-textured soils overlying ferruginous gravelly clay and mudstones) occupying about 50% of the soils in the region and 25% of the entire country (Adu & Stobbs, Citation1981) and poor/erratic rainfall pattern. The artificial constraints are poor extension services, lack of improved seeds of various varieties, low usage of agrochemicals (mostly due to the high cost of agrochemical) and low farm mechanisation.
Donkoh et al. (Citation2010) observed that, if rice cultivation in the North is to develop to reduce poverty, it would need support in terms of water harvesting and regulating structures, education to develop human resources, quality extension services, and the involvement of the youth, hence the need to revive the Youth in Agriculture Programme (YIAP). Oteng (Citation1997) also noted that to create a meaningful impact on rice output in Northern Ghana efforts should be made to increase the production technology of the rain-fed ecology since it controls 75% of the total rice area in Ghana.
Among the selected crops in the Planting for Food and Jobs (PFJ) programme is rice, which is vital to the economy of Ghana; Rice is a source of employment and income for numerous Ghanaian farmers (Donkoh et al., Citation2010). All the major ecological-climatic zones of Ghana; the Interior Savannah zone, the High Rain Forest Zone, the Semi-deciduous Rain Forest zone, and the Coastal Savannah zone produced rice. The greatest potential in rice production lies in the Interior Savannah zone, which covers almost the whole of the northern belt of the country, covering over nearly 9.32 million ha (Oteng, Citation1997).
3. Methodology
3.1. Econometric framework for impact assessment
Two approaches are adopted in this study to examine the effect of Planting for Food and Jobs (PFJ) on the productivity of rice farmers as reported by the Ministry of Food and Agriculture (Citation2017) and the trickle-down impact on rice farmers’ welfare. The research adopts the Inverse propensity Score Weighting (IPSW) techniques and the Local Average Response Function (LARF) method. The LARF is used to confirm the results of the IPSW and by extension, serve as a robustness test.
3.1.1. Inverse propensity score weighting (IPSW) techniques
The study assessed the welfare impacts of benefiting from PFJ policy using, among other techniques, the inverse propensity score weighting estimation. The basic principle underlying this framework developed by Rubin (Citation1974), assume predicted potential binary outcomes for every event. Taking this study into consideration, a selected rice farmer has two potential outcomes; beneficiary and non-beneficiary status in PFJ. Let 1 represents beneficiary and 0 non-beneficiary. Now, if represents beneficiary status in PFJ programme and
non-beneficiary, where d denotes the status of benefiting from PFJ. With this, we denote the outcome variable when benefiting from PFJ as
and outcome when not-benefiting as
, where
represents the observed decision outcome of a rice farmer. The function can, therefore, be written based on the beneficiary status and outcome as (Rubin, Citation1974):
Now, the causal effects for any beneficiary household on its observed outcome is simple the variance between the two potential outcomes thus
. However, in reality, an outcome cannot be observed, so
is indeterminate for any farmer. But, we can estimate the mean effects of beneficiary status on the population of farming households; such estimation is called the Average Treatment Effect
:
Where denotes a mathematical expectation operator. Following Takahashi and Barrett (Citation2013), the average treatment effects on the treated (
) is the average difference in outcomes among the subpopulation of rice farmers who participated in PFJ:
It is also possible to estimate mean effects on non-beneficiaries on the subpopulation of non-beneficiaries; known as average treatment effects on the untreated ():
In pursuit of removing or minimising the effects of selection bias associated with noncompliance or endogenous treatment variables, two broad methods have been proposed (Imbens, Citation2004). One of these methods is based on “ignorability” (Rosenbaum & Rubin, Citation1983; Rubin, Citation1974) or “conditional independence assumption (CIA)”(Lechner, Citation1999, Citation2001), which assumes the existence of a set of observed covariates , which, when controlled for, renders the treatment status
independent of the two potential outcomes
and
. The estimators under the CIA can be obtained either by pure parametric regression-based model, where the covariates are assumed to possibly interacted with treatment status variable to account for varied responses or by two-stage estimation procedure. The conditional probability of treatment or the propensity score
is estimated in the first stage, and in the second stage, the
parameters (
and
are estimated using parametric regression-based methods or by non-parametric methods (Adekambi, Diagne, Simtowe, & Biaou, Citation2009).
This paper focused on or used the inverse propensity score weighting estimators (conditional independence based estimators) such asthese formulae are given below (Adekambi et al., Citation2009; Imbens, Citation2004),
The study adopts probit to estimate the propensity score with representing the sample size, thus
Where n is the number of treated and is the consistent estimate of the propensity score.
3.1.2. Local average response function (LARF) technique
The study used Abadie’s Local Average Treatment Effect (LATE) estimator as a robustness test under the LARF technique because the assumption that farmers’ access to PFJ policy components is random is unrealistic. Abadie’s LATE estimator does not require such assumption but instead involves the much weaker CIA, which assumes that instrument is independent of the potential outcomes
and
conditional on a vector of covariates
that determines the observed outcome
. Based on these assumptions, the following results can be shown to hold for the conditional average outcome function for potential beneficiaries
and any functions of
of
(Abadie, Citation2003; Adekambi et al., Citation2009; Lee, Citation2005):
Where is a weight function that takes the value of 1 for a potential beneficiary and negative value otherwise. The function
is referred to as Local Average Response function (LARF) by Abadie (Citation2003) and Adekambi et al. (Citation2009). Proceeds from parameterisation estimation of LARF:
Then using Equation (6); the equation with
, where parametre
is estimated by a weighted least squares scheme that minimises the sample analogue of
with the conditional probability
appearing in the weight
is estimated by a probit model in the first stage. The resulting estimator of
is consistent and asymptotical as proved by Abadie (Citation2003) and once
, is estimated, the function;
was used to recover the conditional average treatment effect
as a function of
. We then estimated the LATE by averaging across
using Equation (8). For instant with a linear function of
where
and then
. With this, there is no need to obtain LATE by averaging, which is equal to
. Therefore, a simple linear functional form for the LARF with no interaction between
and
implies a constant treatment effect across the subpopulation of potential beneficiaries. We hypothesised an exponential conditional average response function with and without interaction to guaranty both the positivity of predicted outcomes rice productivity and welfare and heterogeneity of the treatment effect across the sub-population of potential beneficiaries from PFJ, is shown in the estimation below. Since access to subsidised fertiliser, subsidised improved seeds and free extension service are necessary conditions for benefitting from PFJ, hence, it can be shown that the LATE for the subpopulation of potential beneficiaries is the same as the LATE for the subpopulation of actual beneficiaries. that is
=
(Adekambi et al., Citation2009; Awotide, Diagne, & Omonona, Citation2012).
3.2. Empirical model specification
The dichotomous nature of benefiting deems it fit to use the Probability regression or Logistic regression model. In this research, as our variables are dummies in nature, we specifically used probit model. With this, we denote for farmers who are non-beneficiaries and
for farmers who are beneficiaries of PFJ in the assessment of
and
. In Probit model, it is assumed that the outcome
(dependent variable) is always influenced by
(independent variable). Specifically, the probit model is stated as:
Where represents probability,
as the parameters to be estimated and
is the standard normal distribution function which distribution is cumulative. The welfare computation though considered significant socio-economic variables such as age, sex, and income among others as independent variables for the treatment variable (Planting for Food and Jobs) but did not report them as factors that influence the beneficiary status in programme.
3.3. Study area and data set
The study was carried out in selected districts of Northern Ghana. Until December 2018, Northern Ghana had three regions; Northern, Upper West, and Upper East regions, but currently has five regions namely; Northern, Upper West, Upper East, North-east and Savannah regions. Northern Ghana covers an area of 97,702 square kilometres (40.96% of the total land area of Ghana) and has 78% of its economically active population in agriculture (GSS, Citation2013; SRID, Citation2016). The region is one of the driest in Ghana, owing to its proximity to the Sahara Desert and the Sahel region. The climate in the region is hot and dry, and it has only one rainy season, from July to September (mono-modal rainfall system)(SRID, Citation2016). The region shares international boundaries with the Republic of Togo to the east, Ivory Coast to the west, Burkina Faso to the north, and domestic boundaries with Brong Ahafo, Bono-East and Volta regions on the south. The main crops grown in the region are cereals such as Rice and Maize.
Data for this study is based on a survey conducted in Northern Ghana. Information on the socio-economic characteristics of rice farmers, rice productivity, expenditure, and income was collected. The study was conducted from January to March of 2019, targeting the population of rice farmers. A total of 288 rice farmers participated in the field survey within Northern Ghana, given an equal chance to beneficiaries (144) and non-beneficiaries (144) of Planting for Food and Jobs. Rice farmers who participated in this study were purposively selected with the help of extension officers in the region. A simple random sampling technique was used to select rice farmers from the regions. The selection of rice farmers ensured an equal number of beneficiaries and non-beneficiaries. A pre-test of the questionnaire was carried out, using 40 rice farmers from the selected zone, taking into consideration the beneficiary status of farmers. The pre-test helped to identify and clarify questions that could have led to misunderstanding. After the pre-test, the researchers reviewed the questionnaire before full implementation was carried out.
4. Results and discussion
4.1. Descriptive analysis of the variables
The descriptive analysis of the impact of PFJ on rice productivity, rice income, income from other crops, farm expenditure, per capita monthly consumption expenditure, income from other occupation and percentage of households who are poor among farmers is shown in Table below. From Table , though, beneficiaries seemed to be better off in terms of rice productivity compared to non-beneficiaries of the programme, the mean difference (66.235) is statistically insignificant at even 10%. The average income from rice production for all farmers (pooled) was GH¢7,302.435, while the mean difference test showed that, non-beneficiaries (GH¢7,308.622) was marginally less than that of beneficiaries (GH¢7,388.688), which is statistically significant at 1%. The significant difference could be attributed to the higher price level of improved rice as against an unimproved commodity of the same kind. The study finds a considerable gap with regards to income generated from other crops and expenditure incurred in the production of rice for the 2018 cultivation season. From observation in Table , non-beneficiaries have higher figures of 632.281 for the former and 525.169 for the latter. As observed by Tanko et al. (Citation2016), adopting a project with subsidised inputs might have reduced the farm expenditure of beneficiaries relative to non-beneficiaries. The results in Table shows that, beneficiaries spent significantly more money on consumables which include water, electricity, food, gas, rent, fuel among other and has a less percentage of the population of the household been poor (i.e., persons who do not earn $1.25 a day) (See Hickel, Citation2015).
Table 1. Descriptive Analysis
On the welfare impact of PFJ on beneficiary status of farmers, an assessment made between the monthly consumption expenditure of beneficiaries and non-beneficiaries revealed that effective consumption expenditure of households provides vivid information on the food security status of households. The results showed that beneficiaries could afford to spend a significant amount of GH¢1,160.71 monthly than that of non-beneficiaries who spent GH¢785.29 on average. Also, beneficiaries’ average income generated from other occupation was higher than that of non-beneficiaries and significant at 5%, which could be attributable to beneficiaries having enough income to invest in other occupations, thereby increasing their incomes from other occupations.
From the t-test analysis (Table ), although the average income from other crops of beneficiaries was marginally less than that of non-beneficiaries, other factors might have accounted for the shortfall in the income generated from other crops to beneficiaries. Generally, these comparisons did not account for the effects of different characteristics of farmers that could influence the outcomes. Therefore, the observed differences in the income generated from other crops could not be entirely attributable to benefitting from Planting for Food and Jobs. The study employed other statistical methods to assess the impact of Planting for Food and Jobs on the welfare of rice farmers.
4.2. Econometrics analysis
Table . presents the econometric analysis of the impact of PFJ on the welfare of rice farmers. To assess the impact of PFJ on beneficiaries and non-beneficiaries, and within beneficiaries, the study used the ATE and ATET using IPSW technique and used the LARF as a robustness test. The ATE showed that benefiting from PFJ (i.e., benefiting from subsidised fertiliser, subsidised improved seeds and free extension services) will result in an average increase in yield of 55.605 Mt of rice productivity more than the average of 737.781 Mt of what they could have got if they had not benefited from PFJ. Among the participants, the ATET revealed that there was a mean beneficial difference of 55.153 Mt of rice productivity of an average outcome of 745.423 Mt. This implies that some beneficiaries had an average increased in rice productivity of 55.153 Mt than other beneficiaries
Table 2. Results of inverse propensity score weighting
The results in Table above revealed that beneficiaries gained significant benefits from farm expenditure, monthly per capita consumption expenditure, and the percentage of households who earn below $1.25 a day. The ATE results for per capita expenditure indicate that beneficiaries of PFJ spent additional GH¢300.888 more than GH¢797.974. Also, there was a significantly higher per capita expenditure of GH¢334.571 among beneficiaries (ATET) with an average of GH¢826.139 of what they could have got if they had not benefited from PFJ. The impact of PFJ on the farm expenditure shows that beneficiaries were able to spend an average GH¢240.877 less than the average GH¢527.609. The ATET revealed an average favourable expenditure of GH¢296.803, which implies, within the benefiting sub-group, PFJ has contributed to a saving of GH¢296.803 through farm input subsidies.
Although the rice income was not statistically significant in both the ATE and LATE approaches relative to the t-test, beneficiaries were better-off than non-beneficiaries. As the ATE revealed, beneficiaries have GH¢52.619 increased in rice income above an average of GH¢7,378.811 of what they could have got if they had not participated. Furthermore, an ATET of loss of income of GH¢246.004 of an average of GH¢ 7,534.691 which could be attributed to improper and different farm practices among beneficiaries. The effects of an increase in productivity, farm income, and per capita consumption expenditures without an improvement in the poverty status of the households do not justify welfare improvement. Using the results of Table which is in line with the ATE findings, benefiting from the PFJ programme proved to reduce the percentage of households who were poor by 11 and 8 per cent for LATELARF and LATEWALD respectivelyFootnote1.
Table 3. Results of Local Average Treatment Effect (LATE)
The use of LATE as a robustness test is critical in impact analysis as the independent variables of the treated variable (PFJ) could have a direct or an indirect effect on the outcome variables leading to endogeneity. The results of the LATE by LARF and LATE by WALD estimator confirmed the ATE results in all the outcome variables suggesting the non-existence of endogeneity (See Hanck, Citation2011).
5. Conclusion and policy recommendation
The study evaluated the impact of Planting for Food and Jobs on the welfare of rice farmers in Northern Ghana using descriptive statistics and IPSW as well as LATE estimations. To eliminate noncompliance, biases, and other factors that are associated with descriptive statistics, the IPSW estimation was used to ensure consistent comparisons between beneficiaries and non-beneficiaries, and within beneficiaries. Generally, benefiting from PFJ has a significant impact on the welfare of rice farmers. The ATE results showed that benefiting from PFJ has an impact on rice productivity and rice income, which are not significant. The results also revealed a substantial impact on income from other occupations, farm expenditure, monthly consumption expenditure, and household income poverty. Among the beneficiaries, the ATET results showed that there were higher impacts on some beneficiaries than others.
In conclusion, benefiting from PFJ would not only lead to the much-needed increase in rice productivity, income, consumption, and reduce farm expenditure and income poverty. However, the programme, when well implemented, would reduce rice importation bills, improve farmer living standards, and reduce rural-urban migration through the creation of jobs. The findings show that income generated from agriculture could be invested in other occupations and improve monthly consumption income. Benefitting from the programme would also ensure food security for households’ and the nation. It can also be used as a tool to reduce rural poverty in the North, thereby reducing the income inequality gap that exists between the north and the south, since more than 60 per cent of the people in the north are farmers (MoFA., Citation2014).
For Ghana to achieve the goal of self-sufficiency in rice production and surplus for export, the study recommends that efforts should be made to increase beneficiaries in the PFJ programme, since benefitting from the policy leads to an increase in productivity and a reduction in income poverty. The prospective benefits accruing to beneficiaries of the policy through the adoption of subsidised fertilisers subsidised improved seeds, and free extension services should be intensified through the media. Furthermore, the other policy components such as marketing opportunities for produce after harvest and E-Agriculture should be fully implemented and intensified through the media. Also, efforts should be made to address the inefficiencies that exist between beneficiaries. Since benefiting from the programme leads to improvement in the welfare of farmers, the government should integrate improved farm mechanisation to the policy components, if it is to win the battle of rural poverty eradication particularly in Northern Ghana expediently. If these recommendations are implemented, Ghana’s pursuit of revamping the agricultural sector and making the state a net exporter of rice would be realised.
Cover Image
Source: Author
Supporting Information
The survey data of the University of Newcastle data management system is not allowed to be on the public without the written consent of the researchers and the University of Newcastle, Australia. When demanded, written permission will be sent, and the data will be made available.
Acknowledgements
The authors wish to acknowledge the support of the University of Newcastle, Australia, for financial assistance in the collection of data. Also, we want to express our appreciation to Zakaria A. Yakubu and Fuseini Awal both from the University for Development Studies for their support throughout the data collection and lastly, to the extension officers of the Ministry of Food and Agriculture (MoFA) located in Northern Ghana for introducing the research team to rice farmers.
Additional information
Funding
Notes on contributors
Mohammed Tanko
My name is Mohammed Tanko, a researcher with 17 published articles in international peer-review journals. Like my co-authors, my research focuses in the area of Agricultural Economics, Economic Theory and Policy, Economic Development and Economic Growth. I have published articles in the area of production, efficiency, welfare, marketing and resource management for Ghana and other countries. My research experience won me a publication grant at the International Food Policy Research Institute (IFPRI) in 2013 and research grant at The University of Newcastle, Australia in 2017.
Notes
1. The Local Average Treatment Effect by WALD (LATEWALD) is considered as an alternative non-parametric measure for impact assessment. The estimation used treatment variable (beneficiary), specified observed outcome, and instrumental variable (See Angrist & Pischke, Citation2008).
Related Research Data
References
- Abadie, A. (2003). Semiparametric instrumental variable estimation of treatment response models. Journal of Econometrics, 113(2), 231–14. doi:10.1016/S0304-4076(02)00201-4
- Abdulai, S., Zakariah, A., & Arkoh Donkoh, S. (2018). Adoption of rice cultivation technologies and its effect on technical efficiency in Sagnarigu district of ghana. Cogent Food & agriculture, 4 (1), 1424296.
- Adekambi, S. A., Diagne, A., Simtowe, F., & Biaou, G. (2009). The impact of agricultural technology adoption on poverty: The case of nerica rice varieties in Benin. Retrieved from https://ageconsearch.umn.edu/record/51645/
- Adu, S. V, & Stobbs, A. R. (1981). Soil of the Nasia Basin, Northern Region, Ghana. Soil Research Institute Memoire, 6. Ghana SRI
- Alidu, A. F., Tanko, M., & Iddrisu, A. (2016). Factors enhancing smallholders farmers` access to masara n’arziki project in the northern region of ghana. International Journal of Development Research, 6(10), 9609–9615.
- Angelucci, F., Asante-Poku, A., & Anaadumba, P. (2013). Analysis of incentives and disincentives for rice in ghana: Technical notes series. FAO, Rome, Italy: MAFAP.
- Angrist, J. D., & Pischke, J.-S. (2008). Mostly harmless econometrics: An empiricist’s companion. Princeton, USA: Princeton University Press.
- Asuming-Brempong, S., & Osei-Asare, Y. B. (2008). Has imported rice crowded-out domestic rice production in ghana? What has been the role of policy? Retrieved from https://ageconsearch.umn.edu/record/52002/
- Awotide, B. A., Diagne, A., & Omonona, B. (2012). Impact of improved agricultural technology adoption on sustainable rice productivity and rural farmers’ welfare in Nigeria: A local average treatment effect (late) technique. Paper presented at the African Economic Conference October. doi:10.1094/PDIS-11-11-0999-PDN
- Ayeduvor, S. (2018). Assessing quality attributes that drive preference and consumption of local rice in ghana (Vol. 48). Ghana: Intl Food Policy Res Inst.
- Bouman, B. (2009). How much water does rice use. Management, 69, 115-133.
- Chauhan, B. S., Jabran, K., & Mahajan, G. (2017). Rice production worldwide (Vol. 247). Germany: Springer.
- Donkoh, S., Awuni, J., & Namara, R. (2010). Improving the efficiency of inland valley rice production in northern ghana.
- Donkor, E., Matthews, N., & Ogundeji, A. A. (2018). Efficiency of rice farming in ghana: Policy implications for rice sector development. African Development Review, 30(2), 149–161. doi:10.1111/afdr.v30.2
- FAO. (2015). Food and agriculture organisation of the united nations. Country fact sheet on food and agriculture policy trends- march, 2015. Ghana.
- FAO. (2018). Food and agricultural organisation. Country Statistics. Retrieved from www.fao.org/faostat/eng/data
- GLSS6. (2014). Ghana living standard survey round 6 -main report, ghana statistical service august, 2014. Undp
- GSS. (2013). 2010 population and housing census report, national analytical report, May 2013. Ghana: Ghana Statistical Service.
- Hanck, C. (2011). Joshua d. Angrist and jörn-steffen pischke (2009): Mostly harmless econometrics: An empiricist’s companion. Statistical Papers, 52(2), 503–504. doi:10.1007/s00362-009-0284-y
- Hickel, J. (2015). It will take 100 years for the world’s poorest people to earn $1.25 a day’. The Guardian.
- Imbens, G. W. (2004). Nonparametric estimation of average treatment effects under exogeneity: A review. Review of Economics and Statistics, 86(1), 4–29. doi:10.1162/003465304323023651
- Lechner, M. (1999). Identification and estimation of causal effects of multiple treatments under the conditional independence assumption. doi:10.1046/j.1469-1809.1999.6320101.x
- Lechner, M. (2001). Identification and estimation of causal effects of multiple treatments under the conditional independence assumption. In Econometric evaluation of labour market policies (pp. 43–58). Germany: Springer.
- Lee, M.-J. (2005). Micro-econometrics for policy, program, and treatment effects. Oxford,UK: Oxford University Press on Demand.
- Ministry of Food and Agriculture. (2017). Planting for food and jobs strategic plan for implementation (2017–2020). Retrieved from http://mofa.gov.gh/site/wp-content/uploads/2018/03/PFJ%20document%20New%20New.pdf
- MoFA. (2014). Ministry of food and agriculture in ghana annual report. Retrieved from Ministry of Food and Agriculture Information Directorate.
- MOFA. (2017). Ministry of food and agriculture, ghana. Agricultural sector progress report 2017. Retrieved from http://mofa.gov.gh/site/wp-pontent/uploads/2018/09/MoFA%202017%20AGRICULTURAL%20PROGRESS%20REPORT_Final.PPMED.MoFA.pdf
- Oteng, J. (1997). Rice production and development in ghana. Bulletin de la Commission Internationale du Riz (FAO); Noticiario de la Comision Internacional del Arroz (FAO).
- PFJ. (2017). Planting for food and jobs strategic plan for implementation (2017–2020) ministry of food and agriculture. Ghana: Republic of ghana.
- Rosenbaum, P. R., & Rubin, D. B. (1983). The central role of the propensity score in observational studies for causal effects. Biometrika, 70(1), 41–55. doi:10.1093/biomet/70.1.41
- Rubin, D. B. (1974). Estimating causal effects of treatments in randomised and nonrandomized studies. Journal of Educational Psychology, 66(5), 688. doi:10.1037/h0037350
- SRID. (2016). Agriculture in ghana. Facts and figures (2016) ministry of food and agriculture -statistics, research and information directorate (srid) October 2017.
- Takahashi, K., & Barrett, C. B. (2013). The system of rice intensification and its impacts on household income and child schooling: Evidence from rural Indonesia. American Journal of Agricultural Economics, 96(1), 269–289. doi:10.1093/ajae/aat086
- Tanko, M., & Alidu, A. F. (2016). Supply response of domestic rice and price risk in northern ghana. American International Journal of Social Science, 5(4), 107–115.
- Tanko, M., & Amikuzuno, J. (2015). Effects of rice importation on the pricing of domestic rice in Northern region of Ghana. ABC Research Alert, 3(2)
- Tanko, M., Iddrisu, A., & Alidu, A. F. (2016). Determinants of rice yield in Northern region of Ghana, the role of policy. Asian Journal of Agricultural Extension, Economics & Sociology, 9(2), 1–11. doi:10.9734/AJAEES/2016/22970