?Mathematical formulae have been encoded as MathML and are displayed in this HTML version using MathJax in order to improve their display. Uncheck the box to turn MathJax off. This feature requires Javascript. Click on a formula to zoom.
Abstract
Most research on poverty has focused on causes of poverty and the inequality gap nationally, meanwhile increasing levels of inequality and poverty has actual occurred within population groups. This study focuses on the sources and extent of within-groups (intragroup; blacks African against each other) and between-groups (intergroup; whites, Indians, coloured and black Africans) inequality and poverty which varies more widely today than over the past decade. To achieve this, two harmonised General Household Surveys from 2012 and 2017 were utilised. The study found that poverty was mainly within-groups, yet, inequality was between-groups. Thus, more efforts should be directed in reducing poverty amongst black Africans within sub groups or tribal lines. Furthermore, income sources from agriculture and pension were the more elastic income components, suggesting that any changes in these two has the likelihood of worsening or reducing inequality. The study recommends that the government should focus on ways of boosting agricultural employment and social grants distribution.
PUBLIC INTEREST STATEMENT
Poverty and inequality are two social evils that many governments are trying to eradicate. South Africa like any middle economy tops as one of the most unequal economy per capita. Meanwhile, poverty goes hand in hand with inequality. The current study delves deeper into this paradox and tries to unearth some of the causes of poverty and inequality within—groups and between-groups. This study is relevant in the poverty and inequality discourse given the high levels of youth unemployment current facing South Africa and the rest of the African continent.
1. Introduction
Recent literature on poverty and inequality focuses on group differences in terms of their well-being. Anand (Citation1983) pointed out that subgroup decomposable measures are the sum of equality in terms of differences in inequality within those subgroups and differences in means across those subgroups. Elbers, Lanjouw, Mistiaen, and Ozler (Citation2008) posit that between-group inequality depends on the differences among a group in mean incomes, their relative size and the number of the group. The difficulty arises with a comparison of such decompositions due to the underlying population structure. In South Africa racial income differences are very prominent in the poverty discourse, this means that the share of income inequality attributed to the racial groups is probably high for black Africans given they contributed over 70% of the population. However, does this offer much in terms of policy advice and racial differences in income? In general, the population shares of non-white and whites population differ tremendously in South Africa. Given that the mean income of non-white groups is lower than whites although in terms of population share the opposite is true, the difference between—group inequality may be attributed to that population share.
Another challenge is the interpretation of inequality decomposition and its implication to policy design. Literature has found little evidence in between-group differences. Anand (Citation1983) found 15% in ethnic group differences in Malaysia. This finding led to the Malaysian government focusing on within groups’ inequality instead of between groups. However, Kanbur and Lustig (Citation2000) pointed out that finding small mean differences between groups does not necessarily mean there are less important than within-groups. Consequently, the authors argued that differences between groups break at a certain point and that varies from country to country. The general calculation of between-groups share is done by taking the ratio of between-group inequality to total inequality (Elbers et al., Citation2008)
Since attaining democracy, South Africa has worked tirelessly to address the plight of the poor by establishing policies and strategies meant to reduce poverty. The Reconstruction and Development Programme (RDP), Accelerated and Shared Growth Initiative for South Africa (AsgiSA) and the Growth, Employment and Redistribution Strategy (GEAR) were some of the government initiatives that were meant to redress the legacy of apartheid. While these policies managed to reduce public sector borrowing, the impact they made in terms of poverty reduction is debatable. The major clash is that most of these initiatives managed to improve discipline in both the micro and macroeconomic sector; however, their effect on poverty reduction cannot be ascertained. In 2009 going onwards, they has been an ushering of new policies such as the New Growth Path (NGP) and recently the National Development Plan (NDP). Other poverty reduction strategies include the Poverty Alleviation, the Presidential Poverty Nodes and the War on Poverty Campaign.
This study attempts to contribute to the body of knowledge in the poverty discourse by departing from previous South Africa studies (Krugell, Citation2014; Leibbrandt, Finn, & Woolard, Citation2012; Sartorius & Sartorius, Citation2016; Statistics South Africa, Citation2014). These studies relied heavily on cross-sectional data or limited to national and provincial poverty levels with no effort to understand the underlying causes of poverty beyond the known. Meanwhile, the present study seeks to use longitudinal data to estimate inequality and poverty elasticities within and between groups using two sequential household survey data. To the best of our knowledge, no poverty studies in South Africa have attempted to use the General Household Survey 2012–2017. Furthermore, no attempts have been made this far to estimate the impact of within-group and between-group inequality variations using the Foster-Greer-Thorbecke (FGT) poverty measures. As well as employing FGT elasticities with respect to within/between income components of inequality.
In the present study, I extend current research on between-groups inequality and poverty in many ways. First, I explore the regional variation levels of inequality and population groups to assess the linkages between the two. Numerous studies focus on national level poverty and inequality, with only a few focusing on a micro level. Secondly, given the wide economic conditions variations in the country as a whole, the geopolitical zones allow a comprehensive comparison of various explanations on between-groups and within-groups inequality and poverty than previous studies. Specifically, I calculate the FGT elasticities based on location and sources of income. These factors have not be explored extensively in previous research using large scale data. Another innovation emanates from the spatial design of this study, where the focus is on source of high levels of inequality and poverty between-groups and within-groups rather than changes in inequality and poverty. Chukwu (Citation2017) study focused on within-groups inequality in Nigeria. However, such an in-depth study that goes beyond within-groups has not been done in South Africa.
The rest of the paper is structured as follows; section 2 provides a review of empirical literature. Section 3 discusses the methods used and data. Section 4 presents the empirical results, findings and discussions. Lastly, section 5 concludes and provides policy implications about the study findings.
2. Explanations of inequality and poverty
In post-apartheid South Africa, studies have shown that poverty trends are mainly race and gender driven (Cheteni, Khamfula, & Mah, Citation2018; Posel & Rogan, Citation2012). In other words, the risk of falling into poverty is based on gender differences and race. Statistics South Africa (Citation2014) noted that in 2011, 60 per cent of females were living in poverty compared to 55 per cent males. Similarly, the issue of female-headed households has contributed to a reduction in women access to income because women have more dependents they live with. Consequently, this highlights that gender inequalities in the labour market has accelerated poverty in the backdrop of apartheid made poverty.
Meanwhile, unemployment remains stubbornly high at over 27 per cent within the age group of 18 to 35 years available to work but unemployed (World Bank, Citation2018). On the contrary, those aged 65 years and older saw their poverty levels decline by over 36 per cent in 2011 compared to 2009 figures. This was attributed to the old age grants that have seen levels of food poverty declining substantially among families. The Department of Women (DoW) (Citation2015) and the United Nations Women (Citation2015) pointed out that while South Africa has put in policies to address poverty and protect the vulnerable groups, youth and women remain vulnerable to poverty. Poverty is high among female-headed household, black South Africans who are less educated and have large families (World Bank, Citation2018). Nonetheless, the social security system has addressed some concerns in gender-based inequality and poverty, with over 16.8 million receiving social grants (Statistics South Africa, Citation2017). However, Rogan (Citation2013) found that the expansion of social grants was not enough to cater to gender differences in the labour market, as a result, the poverty gap widened. The majority of the grant beneficiaries were child grants, which are meant to fight child poverty. Whitworth and Wilkinson (Citation2013) pointed out that 81 per cent of South African children experience income and material deprivation. Leading other provinces with the highest deprivation was the Eastern Cape, which has over 70 per cent of child poverty.
In general, South Africa has made strides in addressing some of the problem faced by the poor. However, modest economic growth that has never passed 4 per cent for the past decade highlights big challenges the country needs to conquer. In 2011, the GDP growth was around 3,6 per cent, and in 2015 less than 2 per cent (South Africa Reserve Bank [SARB], Citation2018).
The three socio-economic challenges currently facing the country include inequality, poverty and unemployment, coupled with hunger. While the poverty headcount has progressively declined between 2009 and 2011, growth is expected to be less than 3 per cent in 2018/19. Thus, little progress is expected in reducing inequality, poverty and unemployment. Rising unrest in the manufacturing and mining sectors has also contributed to the bleak outlook prospects. The share of mining to the GDP declined from 11 per cent in 1994 to below 5 per cent in 2012 (South Africa Reserve Bank [SARB], Citation2018). One of the major contributors to economic growth has been the financial and business sector that rose to 24 per cent (2012) from 17 per cent (1994). Unemployment trends have been mimicking economic growth trends, suggesting that as long as economic growth is low, little can be done in poverty reduction initiatives. Unemployment levels have reached over 25 per cent depending on the definition one uses to define it. With the youths accounting to over two-thirds of the unemployed (May, Sulla, & Zikhali, Citation2016).
Trends and variations in inequality at the national level show that the Gini coefficient is roughly 0.65 based on expenditure data and 0.69 based on income data. The share of national consumption of the poorest (20%) remains at 3 per cent, and the share of the richest (20%) climbed slightly from 61 per cent in 2009 to 65 per cent in 2014, suggesting that the gap between the poor and the rich has widened. Statistics South Africa (Citation2017) found that the poorest 20 per cent of the population saw a decline in their share of income in 2011. Nonetheless, the proportion of the poor using the national-bound level revealed that in 2011, 45, 5 per cent were poor. However, it should be noted that the Indian/Asian population is the only that experience a notable decline in inequality based on expenditure from 0, 53 to 0, 45.
3. Methods
In order to achieve the objectives of this study, we follow the Foster, Greer and Thorbecke (FGT) class of poverty measures, exposure to poverty with greater inequality among the poor. Let us consider two incomes below the poverty line, poverty is said to be severe if one of the incomes is 1 per cent below the poverty line and one income is 99 per cent below the poverty line, in comparison toa situation with two incomes 50 per cent below the poverty line. The FGT takes the following form:
Where is a parameter that can be set at 0, 1, 2 or more according to the importance attached to the poorest. If
= 0 we get a headcount measure as follows:
If = 1, the index takes into account the distance of an individual/household to poverty line using the poverty gap (z—
) as follows:
The poorer the individual, the larger their contribution to the value of the index, although the index is insensitive to income distribution among the poor. Consequently, it is insensitive to certain types of transfers among the poor. For = 2, the index measures sensibility of the distribution of income among the poor and takes the following form.
As suggested by Foster, Greer, and Thorbecke (Citation1984), the index can be decomposed because of its linear structure. For instance, let us assume we have a population between urban and rural areas. If X represents the income of the population, then X can be partitioned as follows (X = XU+XR). We the call p the proportion of XU in X. The index is finally decomposed into
Where is the index representing the urban population and
represents the rural population.
3.1. The model
Following Araar (Citation2012), this study utilises marginal impact and elasticity with respect to between-group and within-group inequality models using the Distributive Analysis Stata Package (DASP). Inequality can be caused by the dispersion of human and physical assets within a group, as well as changes in the returns of those assets. The elasticity of total poverty with respect to within-group inequality is estimated as follows in Equation (6):
The impact of bipolarization process that spreads groups apart from each other without affecting within-group inequality could come from widening disparities across space-such as between urban and rural—or between coastal and inner regions (Araar & Duclos, Citation2007). The elasticity of total poverty with respect to the between-group inequality is as follows in Equation (7):
Where Z represents the Poverty Line, P represents poverty; G represents GINI, represents the poverty aversion parameter, y and
represents within group bipolarisation factor.
3.2. Illustration using South African data
The study utilised two harmonised datasets from Statistics South Africa General Household Surveys from 2012 and 2017. These household surveys contain various information from sampled household such as; demographic characteristics of the household head, access to amenities, education, health service, agriculture, consumption, expenditure, income and employment status. In 2012, 12,000 households were surveyed; meanwhile, the 2017 survey has 18,000 households, with the economically active age from 15–65 years. South Africa is the second largest economy in Africa endowed with considerable natural resources, and a country with very significant levels of inequality and absolute poverty worth consideration. This naturally makes South Africa a huge concern in terms of poverty and inequality. Furthermore, given the fact that South Africa is one country were incomes are surveyed, it is important in motivating our choice of selecting this particular African country. We are aware of the difficulties that arise when measuring income in an economy like South Africa where the majority of black Africans are involved in the informal sector. We use month household income as a measure of living stands. Households’ weights, in this case, are weighted by sampling weights and household size. Statistics South Africa usual uses three poverty line namely, Food poverty (ZAR531, 25 % of population below poverty line), Lower Bound (ZAR758, 40 per cent of the population below poverty line) and Upper Bound (ZAR1138, 56 % of population below poverty line). The average of the South African Rand versus the US Dollar is 1US$ = ZAR14. The poverty line which measures absolute poverty are based on consumptions and spending from the 2010/11 Income Expenditure Survey, although in 2015 there were rebased. Statistics SA stated that the lower bound poverty line is the preferred threshold used in various poverty targets such as the National Development Plan, the Medium Strategic Framework and Sustainable Development Goals. provides poverty line estimates based on the 2017 Household Survey Data. The Eastern Cape and Limpopo Province have most household falling below the food poverty line compared to the rest of other provinces. Likewise, the Western Cape and Gauteng province have the highest average of a household falling in the Upper-Bound Poverty Line. Poverty in South Africa is embedded with a strong spatial dimension, a legacy of apartheid. This is illustrated in .
Furthermore, the wellbeing of households living in the Western Cape and Gauteng province is better than the wellbeing of other households. This conclusion is reinforced by comparing FGT Curves (α = 0) as shown in . As illustrated in , the poverty gap is seen widening between 2017 and 2012 for the Gauteng and Western Cape Provinces compared to the rest of other provinces. This indicates that poverty has increased at a provincial level.
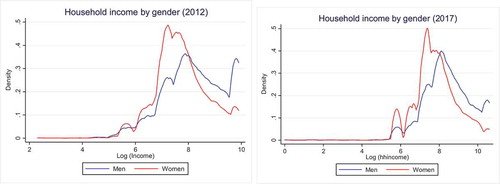
Meanwhile, overlaying density curves in allows us to compare different distributions more easily. The density curve for women is steeper and higher than the one for men in both 2012 and 2017. Furthermore, the log of income with the lowest density is further to the right for men than for women. Thus, the incomes of men are uniformly distributed at the lower end of the income scale, whereas the incomes of females are more concentrated around the average.
4. Empirical results and discussions
Table presents the empirical estimates of the marginal impacts of poverty and inequality, as well as the FGT index associated with elasticities within-group and between-group components by geopolitical zones. The elasticities in both 2012 and 2017 are non-negative and non-zero. The FGT index increased in every province in 2012 and 2017, meanwhile, the marginal impact of poverty (MIP) estimates have increased as well. However, in terms of marginal impact on inequality (MII) between groups, there was a decline in the majority of provinces in 2017, with Gauteng (0.136–0.206), KwaZulu-Natal (0.167–0.181), and the Eastern Cape (0.128–0.142) showing an increase. The provinces with an increase in MII indicate that on average inequalities has increased in those areas. The elasticity for the within-group component is larger than between- group component. This indicates that reducing inequality and poverty within a group will reduce overall deprivation. This is further confirmed by the response to a percentage change in both poverty and inequality captured by the within-group elasticity which is more than the between-group elasticity in both 2012 and 2017.
Table 1. FGT elasticities with respect to within/between group components of inequality
It was further observed that the marginal impact on poverty for within-group in 2012 was 0.704, whilst between groups, it was 0.016. In 2017, the marginal impact on poverty for the within-group rose 0.820 and between groups to 0.023. A trend is observed with marginal impact on inequality within group was at 0.487, yet between group to was at 0.020 in 2012. Meanwhile, in 2017 the marginal impact on inequality rose to 0.543 for within group and 0.030 to between groups. In comparison between the two groups, within-group inequality contribution to total inequality is 96%, meanwhile, the between-group contribution is 4 % in 2012. Similar, in 2017 the within-group contribution to total inequality is 93.1 %, and the between-group was 6.9%. The elasticity estimates show that poverty and inequality have worsened in many provinces. In 2012, the Limpopo (9.284) and Eastern Cape (8.944) provinces were leading in terms of both inequality and poverty. Meanwhile, in 2017 the same provinces show worsened inequality and poverty with the Eastern Cape on 12.229 and Limpopo at 12.292 in terms of elasticity. In addition, in 2017 poverty and inequality worsen in the following provinces Northern Cape (10.428), Free State (11.052) and KwaZulu-Natal (10.808). This is further confirmed by the FGT estimates which show a considerable increase in 2017 compared to 2012 figures in every province. Although, poverty and inequality have remained low in the Gauteng and the Western Cape Province. These two provinces combined contribute over 55 per cent to the South African economy.
The FGT poverty measures have a positive relationship with estimates of elasticities unlike the estimates of the marginal impact of inequality and poverty. Elasticity within-group is numerically larger than betweengroup elasticities in both years. This means changing within-group (intra-group) inequality will have more effect on poverty reduction strategies than changing between-group (inter-group) inequality. It can be noted that there is a non-uniform impact of poverty and inequality in all the provinces under study regardless of the fact that the same poverty line was applied. This variation is possibly caused by the distribution of subgroups, with provinces where most black Africans reside having high inequality and poverty estimates. Bhorat and Leibbrandt (Citation2001) found that inequality between racial groups rather than within-groups was a significant driver of aggregate equality. However, recent studies found the contributing within-group was the main driver of total inequality (Hoogeveen & Ozler, Citation2006). World Bank (Citation2018) pointed out that high concentrations of homelands during apartheid have contributed to this distribution of poverty among province. Homelands were areas set aside for black South Africans along ethnic lines during the apartheid, and the poorest provinces have the majority of these homelands.
Statistics South Africa (Citation2017) found that despite South Africa facing racial segregation two-thirds of total inequality is attributed to within races and not between them. Suggesting that between-group inequality to total inequality was less compared to within-group inequality. Chukwu (Citation2017) found that within-group inequality was high compared to the between-group inequality.
In order to test this claim, we ran estimated FGT elasticities with respect to within/between income component of inequality as shown in Table . In 2012, agriculture and pensions contributed a huge income share compared to other sources of income like salaries, remittance to name a few. However, the impact on poverty and inequality was negative for agriculture and pension, yet the elasticities were higher than 9. Meanwhile, in 2017, pension and agriculture had the largest elasticities, although the contribution of pension on income share decline to 0.00018 compared to 0.00035 in 2012. This simply means that the decline in pensions and agriculture as a source of income worsened inequality and poverty in South Africa between the periods under study. Statistics South Africa (Citation2018) estimated that in 2015, social transfers reduced the poverty headcount by 7.9 % and the poverty gap by 29.5 %. Suggesting that social assistance has proved successful in fighting extreme poverty. The findings of this study disagree with this claim that poverty has reduced due to social grants assistance. Nationally the poverty estimates may be affected by provinces like the Western Cape which have low percentages of people living in poverty. Combined with other similar places, the poverty percentage tends to follow a normal distribution outcome, yet, in reality it skewed to certain provinces.
Table 2. FGT elasticities with respect to within/between income components of inequality
4.1. Deprivation by income components
Furthermore, the impact on inequality within-group (0.513) was lower than the between-group (0.517) in 2012. This remained the same in 2017 with an impact on inequality within-group (0.581) lower than between-group (0.583). However, in terms of impact on poverty in 2012, the within-group (0.737) was also lower than the between-group (0.889). In 2017, the impact on poverty within-group (0.885) was lower than between-group (1.02443). Ararr and Duclos (2012) stated that poverty indices are insensitive to incomes that are higher than the poverty line. Suggesting that in order to fight inequality there is a need to focus on between-groups (inter-group) than withingroup (intra-group) income components. This finding is line with Cheteni et al. (Citation2018) who pointed out that income is unequally distributed among ethnic groups in South Africa. According to Statistics South Africa (Citation2017), poverty and inequality have also widened among population groups in the past few years.
5. Conclusion and implications
This study has attempted to explain the likely causes of poverty and inequality between-groups and withingroups. Given the urgency of this matter as promulgated by the United Nations Sustainable Development Goals, poverty and inequality remain two core areas most developing nations are fighting against. Statistics South Africa revealed that strides have been made in addressing these two social evils; however, labour market dynamics and racial driven inequality are a setback in efforts meant to address poverty.
The main implications of these findings are that there is a need to address the within/between group poverty and inequality in order to foster growth in future. This means that the government should instead focus on policies that improve social cohesion than ones which are meant to address economic growth. As pointed out by Statistics South Africa the labour market is divided between high earners in formal jobs and the fewer earners in low-class jobs that are mainly driven by cheap labour. In addition, given that the labour market is still drawn along racial lines, it may be worthwhile for the government to revise policies such as the Broad-Based Black Empowerment Act, which has instead worsened the inequality gap between population groups. Numerous studies have shown a widening gap between black South Africans and other race. This is a cause of concern considering that most black South Africans are surviving on social transfers. Redistributive policies cannot be used as the main tools to address poverty. Therefore, there is a huge probability that only a few people would exit poverty by 2020. It is possible that pro-poor policies have also contributed to the deteriorating inequalities and disparities in many provinces. For instance, the Free Education stance taken by the South African government might have worsened the public wage bill given that food-fuel has been driving exchange rates downwards in global markets. The ratings from credit agencies such as the Moody’s have done much damage to an economy in a technical recession as pointed by the South African Reserve Bank 2018 second quarterly report.
Correction
This article has been republished with minor changes. These changes do not impact the academic content of the article.
Additional information
Funding
Notes on contributors
Priviledge Cheteni
Dr Priviledge Cheteni is a researcher at the University of Fort Hare. His research interests include inequality and poverty, developmental economics, social policy, agricultural economics, climate change and environmental economics. He has published widely in various peer-reviewed journals.
Related Research Data
References
- Anand, S. (1983). Global income inequality. Washington, DC: World Bank.
- Araar, A. (2012). Expected Poverty Changes with Economic Growth and Redistribution, CIRPEE Cahier de Recherche, Working Paper 12–11.
- Araar, A., & Duclos, J. Y. (2012). DASP: Distributive Analysis STATA Package. Universite Laval and World Bank. doi:10.1094/PDIS-11-11-0999-PDN
- Araar, A., & Duclos, Y. (2007). Poverty and inequality components: A micro framework, Working Paper: 07‐35, CIRPEE, Department of Economics, Université Laval. doi:10.1094/PDIS-91-4-0467B
- Bhorat, H., & Leibbrandt, M. (2001). Correlates of vulnerability in the South Africa Labour markets. South Africa: UCT Press.
- Cheteni, P., Khamfula, Y., & Mah, G. (2018). Drug-Related Crime and Poverty in South Africa. Cogent Finance and Economics, 6(1). doi:10.1080/23322039.2018.1534528
- Chukwu, J. O. (2017). Estimating inequality semi-elasticity of poverty reduction in Nigeria. Social Indicators Research, 131(3), 1087–1101. doi:10.1007/s11205–016–1298–1
- Department of Women (DoW). (2015). Strategic Plan. Pretoria: Government Printers.
- Elbers, C., Lanjouw, P., Mistiaen, J. A., & Ozler, A. (2008). Reinterpreting Between-Group Inequality. The Journal of Economic Equality, 6(3), 231–245.
- Foster, J., Greer, J., & Thorbecke, E. (1984). A class of decomposable poverty measures. Econometrica, 52, 761–766. doi:10.2307/1913475
- Hoogeveen, J., & Ozler, B. (2006). Poverty and inequality in post-apartheid South Africa. Mimeo. Washington, D.C: World Bank.
- Kanbur, R., & Lustig, N. (2000). Why is inequality back on the agenda? Available at SSRN: https//ssrn.com/abstract=2948957
- Krugell, W. (2014). The Spatial Persistence of Population and Wealth during Apartheid; Comparing the 1911 and 2011 Censuses. Economic History Of Developing Regions, 29(2), 336–352. doi:10.1080/20780389.2014.957907
- Leibbrandt, M., Finn, A., & Woolard, I. (2012). Describing and decomposing post-apartheid income inequality in South Africa. Development Southern Africa, 29(1), 19–34. doi:10.1080/0376835X.2012.645639
- May, J., Sulla, V., & Zikhali. (2016). South African Poverty Inequality Assessment Discusion Note, Drafted January 2016
- Posel, D., & Rogan, M. (2012). Gendered trends in poverty in post-apartheid period, 1997–2006. Development Southern Africa, 29(1), 97–113. doi:10.1080/0376835X.2012.645645
- Rogan, M. (2013). Poverty and headship in post-apartheid South Africa, 1997–2006. Social Indicators Research, 113(1), 491–511. doi:10.1007/s11205-012-0107-8
- SARB (South Africa Reserve Bank). (2018). Quarterly Bulletin March 2018. No. 287. Pretoria: SARB.
- Sartorius, K., & Sartorius, B. (2016). Service delivery inequality in South African municipal areas: A new way to account for inter-jurisdictional differences. Urban Studies, 53(15), 3336–3355. doi:10.1177/0042098015613001
- Statistics South Africa. (2014). The South Africa MPI: Creating a multidimensional poverty index using census data, Pretoria. Statistics South Africa: Pretoria.
- Statistics South Africa. (2017). Poverty Trends in South Africa: An examination of absolute poverty between 2006 & 2015. Statistics South Africa: Pretoria.
- Statistics South Africa. (2018). The Vulnerability Report. Statistics South Africa: Pretoria.
- United Nations Women. (2015). Women and Poverty. New York: USA.
- Whitworth, A., & Wilkinson, K. (2013). Tackling child poverty in South Africa: Implications of Ubuntu for the system of social grants. Development Southern Africa, 30(1), 121–134. doi:10.1080/0376835X.2013.756219
- World Bank. (2018). Overcoming poverty and inequality in South Africa an assessment of drivers, constraints and opportunities. South Africa Poverty and Inequality Report. Washington DC: USA
Appendix
Figure A1. Household mean income by poverty line.
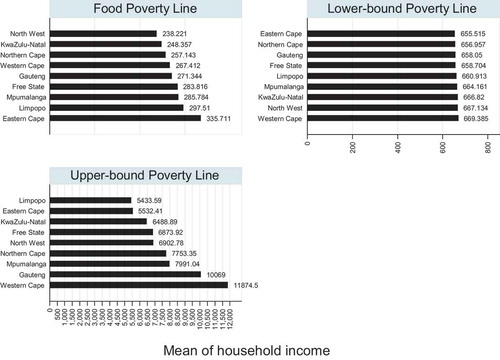
Figure A2. FGT curves.
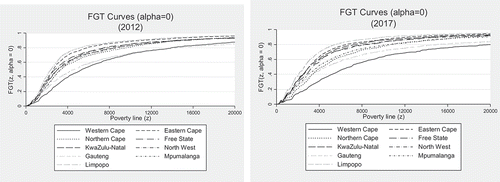
Figure A3. Household mean income by gender.